Analysis of milling of dry compacted ribbons by distinct element
method
C. Hare
a,n, M. Ghadiri
a, N. Guillard
b, T. Bosworth
b,c, G. Egan
b,c aInstitute of Particle Science and Engineering, University of Leeds, Leeds LS2 9JT, UK bProcter & Gamble, Newcastle Innovation Centre, Newcastle upon Tyne NE12 9BZ, UK c
Procter & Gamble, Bethel Technical Center, Bethel, CT, USA
H I G H L I G H T S
Dry compacted ribbons were re-presented in DEM by bonded spheres.
The bond strength was calibrated by experimental and simulated 3 point bend tests.
DEM estimates impact velocities and stresses the ribbons experience in the mill.
Ribbons are exposed to such impacts and stresses to predict size distribu-tion.
Predicted size distribution correlates well with plant data.
G R A P H I C A L A B S T R A C T
a r t i c l e i n f o
Article history:
Received 4 December 2015 Received in revised form 6 April 2016
Accepted 20 April 2016 Available online 22 April 2016
Keywords: DEM
Stress distribution Shearing Breakage Non-spherical
a b s t r a c t
Fine cohesive powders are often dry granulated to improve their flowability. Roller compaction is commonly used to produce dense ribbons which are then milled. The material properties of the powder and the conditions in the roller compactor affect the strength of the ribbons, however there is no method in the literature to predict the size distribution of the product of ribbon milling. Here we introduce a method, by using the Distinct Element Method (DEM) to determine the prevailing impact velocities and stresses in the mill, with bonded spheres representing the ribbons. The bond strength is calibrated by matching experimental results of three point bend measurements and predictions from numerical si-mulations. The ribbons are then exposed to the dynamic conditions predicted by the DEM, by dropping them from a controlled height to cause fragmentation, and subsequently stressing them in a shear cell under the conditions again predicted by the DEM. The fragments are sheared under these conditions to represent repeated passage of bars over the fragments at the mill base. Sieve analysis is used here to determine the particle size distribution under given mill conditions. The predicted size distribution of the mill product compares well with the plant data. It is found that the mill speed and length of ribbons fed to the mill have no significant influence on the product size distribution for the range tested.
&2016 The Authors. Published by Elsevier Ltd. This is an open access article under the CC BY license (http://creativecommons.org/licenses/by/4.0/).
1. Introduction
Fine particulate materials often pose handling problems, such as poorflowability, adversely affecting dose uniformity. To over-come this, particle size can be increased by a variety of granulation methods, such as wet granulation in rotating or tumbling vessels Contents lists available atScienceDirect
journal homepage:www.elsevier.com/locate/ces
Chemical Engineering Science
http://dx.doi.org/10.1016/j.ces.2016.04.041
0009-2509/&2016 The Authors. Published by Elsevier Ltd. This is an open access article under the CC BY license (http://creativecommons.org/licenses/by/4.0/). nCorresponding author.
(Salman et al., 2007), or dry granulation through direct compres-sion in a roller compactor (Guigon et al., 2007), followed by mil-ling. The products of a roller compactor are typically relatively large sheets, known as a ribbons (410 mm in length and width), and as such they are subjected to a subsequent size reduction process by milling.Miguelez-Moran et al. (2008)investigated the effect of lubricants on ribbon density and found that the method of loading in the compactor is crucial in determining density homogeneity, with average density increasing with peak pressure and nip angle.Khorasani et al. (2015)determined ribbon porosity using NIR, mercury porosimetry and oil intrusion, all of which indicated reduced ribbon porosity with compaction pressure.
Muliadi et al. (2013)showed that the predicted density distribu-tion of roller compacted pharmaceutical powders by Finite Ele-ment Method (FEM) can correlate well with experiEle-mentally- experimentally-measured values by X-Ray Tomography (XRT). Both experiments and the FEM showed that when the rollers are free to move lat-erally the inlet stress does not affect the average ribbon density. Ribbon density and strength increase as the hardness of the feed material is reduced, as indicated by nano-indentation measure-ments (Al-Asady et al., 2015).
During milling the size reduction can be driven by impact, shear and compression to varying degrees, depending on the mill type, operational conditions and material properties. Conse-quently, it is difficult to determine the suitable conditions to use for milling of a given ribbon product from roller compaction. Va-narase et al. (2015)compared the performance of a hammer mill and a co-mill in milling extrudates of alumina-magnesia. It was shown that the impeller speed was influential in the size reduction in the co-mill, but not in the hammer mill. An increase in outlet mesh size leads to a coarser product, with the hammer mill being more efficient in allowing particles closer to the mesh size to exit.
Samata et al. (2012)showed that the profile of the screen in a cone mill is influential in determining the milling performance, with a mesh opening inclined to the direction of motion of the impeller leading to better gripping and minimising the production offines.
Yu et al. (2013)investigated the influence of magnesium stearate on formed ribbons of micro-crystalline cellulose (MCC) and di-calcium phosphate dihydrate (DCPD), and their subsequent milling performance in an oscillating mill. Comparing the MCC and DCPD ribbons, it was found that the size reduction in the mill could be related to the fracture energy measured by 3-point bend tests, although it should be noted that the DCPD ribbons were too fragile to be tested in this manner.
Hare et al. (2011)developed a method for predicting size re-duction of pharmaceutical particles in an agitated vessel by esti-mating the bed stresses and strains using the Distinct Element Method (DEM). They related the experimentally-determined breakage to the applied stress and strain, the latter predicted by DEM. DEM is most commonly applied to spherical particles, though it can be used to represent non-spherical particles by the clumped sphere method (Favier et al., 1999).Moreno and Ghadiri (2003) simulated impact breakage of agglomerates generated using DEM with bonds of a given strength acting between con-tacting particles. The breakage mechanisms of chipping and frag-mentation were both replicated by the DEM, with the extent of breakage being a function of the bond surface energy expressed by Weber number.Calvert et al. (2011)simulated aerodynamic dis-persion of cohesive clusters by Computational Fluid Dynamics (CFD) coupled with DEM, and showed the same functional group is also applicable to their case. Breakage of non-spherical particles has also been investigated byGrof et al. (2011), who showed that DEM could be combined with experiments to develop breakage kernels for compression of needle-shaped particles.Kozhar et al. (2015)simulated the compression of irregular titania particles and demonstrated that the bonded sphere approach could better
capture the force-displacement response of the experiments, in comparison to the clumped sphere method.
To our knowledge DEM has not yet been applied to milling of dry compacted ribbons in the literature. Here we propose a com-bined experimental and computational approach to better un-derstand the impact and shearing conditions that the ribbons experience under different mill operations, and to predict the re-sulting particle size distribution and residence time.
2. Materials and methods
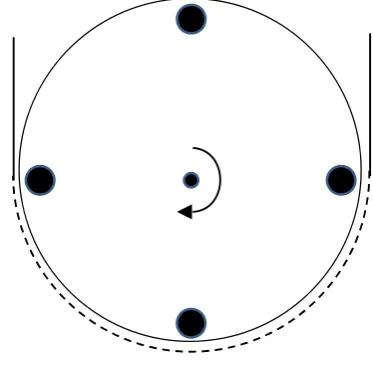
The mill considered in this work is a rotary bar mill, as shown schematically in Fig. 1. It consists of a large horizontally-aligned hemi-cylinder with a length to diameter ratio of 1.89, and vertical side walls, within which four horizontal cylindrical bars of 20 mm diameter, held by a thin disc attached at each end, rotate around an axis, centrally aligned within the hemi-cylinder. The mill dia-meter is approximately 5–10 times the length of the ribbons. The cylinder is constructed using a sieve mesh with an outlet diameter of 3 mm, through which milled material exits. The rotating bars contact the hemi-cylinder when the mill is empty. However, as ribbons are fed into the top of the mill, the weight of feed material in the mill and the nipping of the ribbons by the rollers cause the sieve mesh to be separated from the bars by a narrow gap. As the ribbons enter the mill they may be impacted by a bar at the top of the mill, or they may bypass an upper bar and impact the base of the mill. The likelihood of impact at the top is influenced by the rotational speed of the bars, the sheet length and thickness, and entrance velocity. In the mill analysed here, the entrance velocity is determined by the vertical distance between the mill entrance and the roller compactor, and the feed rate to the roller compactor. Two ribbon formulations are considered in this work; formula A and formula B, as shown inFig. 2. The ribbon lengths, widths and thicknesses are shown for both formulas in Table 1. After the fragments from initial impacts settle at the base of the mill they are continually sheared by the rotating bars until they are small enough to pass through the sieve mesh.
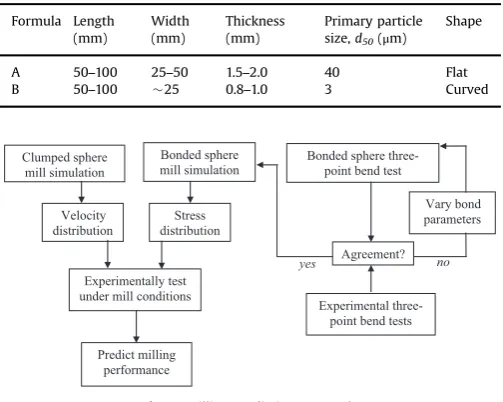
[image:2.595.341.528.556.739.2]In this paper, a combined experimental and computational approach to predict milling performance of the above system is described (shown inFig. 3), implemented and compared to plant data. To understand the impact velocities and stresses that the ribbons experience in the mill, the ribbons are represented in the DEM by using two separate approaches, namely clumped spheres, following the approach ofFavier et al. (1999), and bonded spheres using the method developed by Brown et al. (2014). Since the
clumped spheres remain rigidly attached for the duration of the simulation, regardless of forces experienced, this method is sui-table for determining the initial impact conditions experienced by the ribbons by a bar at the top or the sieve mesh at the base. However, further information taken from such a simulation would not be representative of the true mill conditions, since the ribbons break significantly due to impact. Therefore, to analyse the stresses acting on the fragments, the latter method is used to represent the ribbons. This model ensures spheres remain rigidly aligned with other spheres to which they are bonded; however it allows bonds to be broken when they experience a stress greater than their strength. This approach would also be suitable for determining the initial impact velocities, however the clumped sphere approach is selected here to allow faster simulations to be obtained. For the bonded spheres, the bonds are characterised by the following properties: bond radius, Young's modulus, Poisson's ratio and compressive, tensile and shear strengths, and their distributions. A change in the values assigned to these parameters would lead to a different stress distribution in the mill and breakage pattern of the ribbons. Therefore, to ensure the ribbons are accurately re-presented by the bond parameters chosen, experimental three-point bend tests are carried out and simulated by the DEM. The bond parameters are varied in separate DEM simulations until the predicted breakage force is in agreement with the experimental data. The calibrated bond parameters are then used in the mill simulation to determine the dynamic conditions experienced by
the ribbons. Following the analysis of the impact velocity and shear conditions in the mill, the ribbons are exposed to these conditions in the experimental work to predict the particle size distribution of the mill product. To do this the ribbons arefirst dropped from a controlled height into aflat box with a rigid base, to ensure all fragments are retained. The drop height is varied to represent the distribution of impact velocities, as determined by the clumped sphere simulation. The impacted ribbon fragments are then collected and placed in a single layer in an annular shear cell (Ajax Equipment Ltd, Bolton, UK), based on the design of
Paramanathan and Bridgwater (1983), compressed and sheared under the stresses and strains that were determined by the bon-ded sphere DEM mill simulations. The shearing process is carried out for all impacted material, which is then manually sieved using a 3.35 mm mesh sieve–to replicate the mill outlet. The shearing process is then repeated for all material that remains on the sieve, until the entire feed has passed through the sieve. Following this step the full size distribution is determined by a Retsch mechanical sieve shaker for 3 minutes at amplitude of 0.5 mm.
2.1. Clumped sphere mill simulation
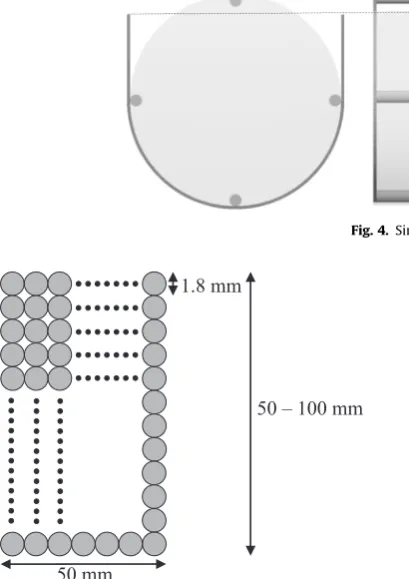
[image:3.595.77.511.60.200.2]The clumped sphere simulations were carried out using LIGGGHTS. The mill is represented by a solid hemi-cylinder with length to diameter ratio of 1.89, withflat ends and vertical side walls, with height equal to the hemi-cylinder radius, extending upwards above the horizontal diametric plane of the hemi-cylin-der. Within the mill, four steel cylindrical bars of 20 mm diameter rotate around the horizontal axis of the mill, with their axes at a radial distance from the mill axis to provide zero clearance with the base of the mill, as shown in Fig. 4. The ribbons are re-presented by a single layer of contacting (but not overlapping) 1.8 mm diameter spheres, with a ribbon width of 25.2 mm (14 spheres) and lengths of 50.4 and 100.8 mm (28 and 56 spheres, respectively) in separate simulations. An example of the structure of the 50 mm ribbon is shown inFig. 5. This approach is taken because the ribbons themselves are 1.8 mm thick. If the particle size were to be reduced to allow a double-layer of spheres in the ribbon, the number of spheres required would increase dramati-cally (by a factor of 8 if no sphere overlap were used), as would the computational time required. The properties of the wall and rib-bon materials are provided inTable 2and the interaction prop-erties are provided in Table 3. The bars are rotated at 50 and 65 rpm in separate simulations, giving bar velocities of 0.92 and 1.19 m/s, respectively. Fifty vertically aligned sheets were in-dividually generated immediately above the mill, with a genera-tion interval of 1 sheet/s and an initial downward velocity of 2.5 m/s. The generation rate and velocity were determined from plant data of the feed rate of material into the roller compacter
Fig. 2.Images of ribbons (a) formula A and (b) formula B.
Table 1
Ribbon dimensions for formulae A and B.
Formula Length (mm)
Width (mm)
Thickness (mm)
Primary particle size,d50(μm)
Shape
A 50–100 25–50 1.5–2.0 40 Flat
B 50–100 25 0.8–1.0 3 Curved
Clumped sphere mill simulation
Bonded sphere mill simulation
Bonded sphere three-point bend test
Agreement?
Experimental three-point bend tests Velocity
distribution
Stress distribution
Experimentally test under mill conditions
Predict milling performance
yes no
[image:3.595.33.285.249.450.2]Vary bond parameters
(above the mill) and the vertical gap between the roller compactor and the mill entrance, assuming no deceleration due to air drag.
2.2. 3-Point bend experiments
A number of ribbons were evaluated by 3-point bend tests, in order for the process to be simulated by the DEM to determine representative bond strength parameters. The ribbons comprising formula A were of irregular shape, so they were cut to a length and width of 50 and 20 mm, respectively, prior to the test. The formula B ribbons were of regular width (26 mm), and hence were cut to a length of 50 mm prior to testing. In each test, a ribbon was placed on two supports with a gap of 25 mm, as shown in Fig. 6. A stainless steel beam, with a rectangular face and 0.5 mm thickness, was clamped above the ribbon (with its longest side aligned along the width of the ribbon) to a Stable Microsystems TA.XTplus Texture Analyser,fitted with a 500 g load cell. The beam was dri-ven vertically downwards at a rate of 0.1 mm/s until the loaded
ribbon was broken, and the force displacement data recorded to determine the breakage force. Ten ribbons of each formulation were tested in this manner. The failure was essentially brittle with a sudden fall of load.
2.3. 3-Point bend test simulations
The 3-point bend tests were simulated in the DEM using EDEM software (DEM Solutions). The geometry setup was identical to that of the experimental procedure. In the model ofBrown et al. (2014), used in these simulations, spheres are given a physical radius and a contact radius (the latter is greater than the former). If thecontactradii of two spheres overlap then they are bonded at the time of bond creation. The ribbons were represented here in a similar manner to that outlined in Fig. 5, however the neigh-bouring spheres (with 0.9 and 0.45 mm radii for formulas A and B, respectively) were separated by a distance of 1
μ
m to enable generation of the square packing arrangement in EDEM. The contact radii had appropriate size to ensure horizontal neighbours were bonded but diagonal neighbours were not. The material properties of the mill and spheres are given inTable 2. The bond properties were varied (as discussed in Section 3.3) in separate simulations until the breakage force was within 10% of the ex-perimental average, for each formula.2.4. Bonded sphere mill simulation
[image:4.595.71.526.57.377.2]The ribbons were created in the same manner as the 3-point bend test simulations, using the sphere and mill properties out-lined inTable 2, and the optimum bond parameters from the si-mulated 3-point bend test. The mill setup was identical to that of the clumped sphere mill simulation, with the exception that the radial distance of the centre of the bars provides a gap of 1 mm between the bar and the hemi-cylinder mill. The ribbon length, formulation and mill speed were varied in separate simulations, as shown inTable 4. A total of eight ribbons were generated in each simulation. Since the contact model creates bonds between all contacting spheres (based on overlap of contact radii) at a
Fig. 4. Simulated mill geometry.
50 mm
[image:4.595.77.282.63.353.2]50 – 100 mm
1.8 mm
[image:4.595.343.529.194.338.2]Fig. 5.Simulated ribbon using the clump sphere method.
Table 2
Simulation materials' properties.
Material Property Ribbon Mill (steel)
Density,ρ(kg/m3) 4000 (A), 7000 (B) 7800
Shear modulus,G(GPa) 0.1 182
Poisson ratio,ν 0.25 0.25
Table 3
Simulation interaction properties.
Material Property Ribbon–Ribbon Ribbon-Mill (steel)
Coefficient of restitution 0.3 0.4
Coefficient of sliding friction (μs) 0.5 0.5 Coefficient of rolling friction, (μr) 0.01 0.01
Loading beam
Ribbon
[image:4.595.43.293.407.457.2]Load cell
Clamp
[image:4.595.41.291.496.544.2]specified timestep, the spheres for all ribbons were generated at the start of the simulation, with their velocity capped to zero until bonds had been created. Following bond creation, the velocity restriction was removed to allow the ribbons to fall under gravity. To ensure the ribbons entered separately, each was created within a bounding box, which was removed as needed to initiate the ribbon's fall. After each individual ribbon reached a vertical posi-tion entirely below the remaining ribbons, the next ribbon was moved horizontally across until it was in line with the centre of the mill. Once in this position, the box motion was stopped and the box was deleted to initiate the fall of the ribbon. The ribbons were inclined 30°to the vertical, since the ribbons tended to impact at approximately this angle in the experimental drop tests (described inSection 2.5). The simulation setup is shown inFig. 7.
The stress,s, acting on the ribbons, taken as normal, was de-termined from the force,F, acting on each individual bar in the mill, usingEq. (1). Since the bonded spheres representflat sheets, the projected area,Ap, is approximated to equal the cross-sectional area of an individual sphere (taken asdp2, since the spheres have square packing arrangement) multiplied by the number of spheres in contact with the bar.
σ=
∑ ( )
F
A 1
i c
p
wherecis the total number of sphere contacts with the given bar. The shear strain,
Γ
, for each pass of the roller was determined usingEq. (2).Γ= ⋅
( )
V t
d 2
r
whereVris the translational velocity of the bar,tis the duration of the shearing event (continuous period whereF40) anddis the gap between the bar and the mill.
2.5. Ribbon impact experiments
The ribbons were vertically aligned and manually released from a height pre-determined to provide the corresponding vertical
impact velocity obtained from the clumped sphere mill simula-tions. The ribbons were dropped individually into a cubic Perspex container of length 250 mm, to retain all impacted fragments. The fragments were removed from the box before each subsequent test. The impact velocity was measured using a Redlake MotionPro X4 Highspeed Camera at 1000 frames/s. Ten ribbons were im-pacted for each mill condition simulated, and for each formulation. The fragments from all ribbons, impacted at conditions re-presenting a single mill condition, were collected together and reserved for the shearing experiments. All ribbons rotated slightly as they were dropped, leading to impact angles of approximately 60°with the horizontal in all cases. This ribbon orientation was therefore introduced in the mill simulations. The impact angle would be highly influential on the extent of impact breakage, since at the two extremes the stress could propagate directly through the length or thickness of the ribbon, respectively.
2.6. Ribbon shearing experiments
The total mass of the fragments for a given ribbon formula was measured for those impacted at 2.75 m/s and those at 4 m/s. The product of the impact breakage experiments contained some material too large to be placed in the shear cell, i.e. its longest dimension being greater than 20 mm (the annular width of the shear cell). These large fragments were separated and their col-lective mass was measured. For formula A and B ribbons, 55 and 39% by mass, respectively was available for shear testing. The size distribution of milled products is not expected to be substantially affected by this, since successive milling events would break this material down sufficiently to allow its exit from the mill. However, a greater number of shearing events would be required to enable the material to exit from the mill.
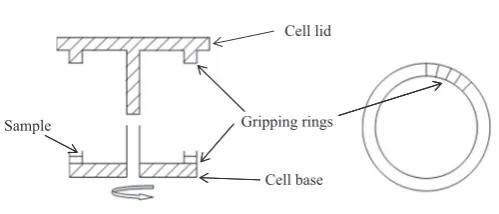
The collected fragments were sheared in an Ajax attrition shear cell (Fig. 8), with inner and outer radii of 60 and 80 mm, respec-tively. Radial groove rings with a 2.5 mm pitch werefixed to the cell lid and base. The fragments resulting from the ribbon impact experiments were randomly selected to provide a single layer in the cell, onto which the cell lid was placed. The applied normal stress,s, was varied by the addition of weights to the lid, to match that estimated by the bonded sphere mill simulation, as described byEq. (3).
σ= +
( )
F F
A 3
l w
s
whereFlandFware the gravitational force of the lid and weights, respectively, and As is the cross-sectional area of the shear cell annulus. The cell base was rotated whilst the lid rotation was prevented by a stopper arm, thus shearing the material in the cell. The angle of rotation,
θ
, was controlled to provide a shear strain equal to that estimated by the bonded sphere mill simulation, usingEq. (4).Γ= θ π⋅
( )
D
h f
360 4
[image:5.595.38.283.75.315.2]c
Table 4
Mill simulation conditions.
Test case Formulation Ribbon length (mm) Mill speed (rpm)
1 A 50 50
2 A 50 65
3 A 100 50
4 A 100 65
5 B 50 50
6 B 50 65
7 B 100 50
8 B 100 65
Mill centre
Direction of box movement
Fig. 7.Bonded sphere mill simulation.
Sample Gripping rings
[image:5.595.303.553.632.739.2]Cell base Cell lid
whereDcis the median diameter of the cell (140 mm),his the bed height (sheet thickness) and fis the grip factor, which was as-sumed to be 1.
After shearing all impacted fragments representing given mill operational conditions, the sheared material was manually sieved using a 3.35 mm mesh sieve – this being the closest available standard sieve to the 3 mm mesh outlet of the mill. Material passing through the sieve was reserved for final size analysis, whilst the material43.35 mm was sheared again under the same conditions, using the same bed preparation method outlined above. Once all the material passed through the 3.35 mm mesh sieve, its size distribution was collectively analysed. This material was placed on a stack of sieves with mesh sizes of 1000, 850, 600, 425 and 250
μ
m, and sieved using a Retsch AS 200 vibratory sieve shaker at an amplitude of 0.5 mm for 3 min. These sieving con-ditions were selected to ensure steady state and no breakage was observed during the sieving process.Since each shearing event represents one pass of a mill bar against the outlet mesh, the residence time distribution is pre-dicted from the fraction of material passing through the 3.35 mm sieve,xshear, after shearing eventNusing(Eqs. (5)and6).
(
)
=∑
( )
x t m
m x 5
mill res shear impact N shear 1
(
)
= + ( )tres N tshear tinterval 6
wherexmill(tres) is the fraction of material having a residence time oftresinside the mill,mshearis the total mass of fragments sheared in the cell,mimpactis the total mass of fragments after the impact tests, andtshearandtintervalare the duration of a shearing event and interval between shearing events, respectively. Here, it is assumed that, ω = ⋅ ( ) t N 60 7 erval R int
where
ω
is the mill rotational speed (rpm) andNRis the number of rollers in the mill (4).3. Results and discussion
3.1. Clumped sphere simulation
The distribution of ribbon impacts at the top and bottom of the mill and the corresponding average impact velocities are shown in
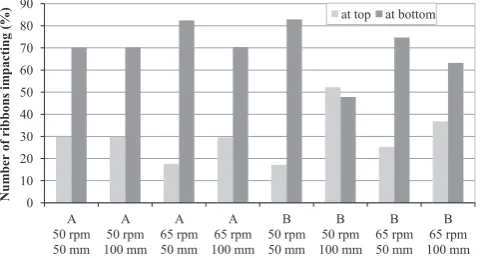
Figs. 9and10, respectively.Fig. 9shows no clear influence of mill rotational speed or formulation on the percentage of impacts at
the top and bottom of the mill, however there is an increased fraction of 100 mm ribbons impacting at the top of the mill, compared to the 50 mm sheets. This is to be expected since when the ribbon falls vertically the time that the ribbon spends in the vicinity of the bar at the top is greater for a longer ribbon, thus increasing the chance of being impacted by the bar. On average across the eight simulations about 30% of the ribbons impact at the top and 70% bypass the top bar and impact at the bottom.
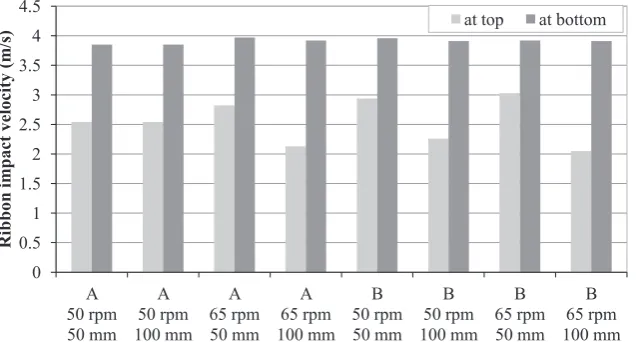
Fig. 10shows that in all eight cases the ribbons impacting the bottom have an average impact velocity of approximately 4 m/s. The ribbons impacting the top bar have a lower impact velocity, since they do not have as far to fall. Of the ribbons impacting at the top, those with a length of 100 mm exhibit a slightly lower impact velocity than those that are 50 mm in length. Overall the average impact velocity for the ribbons impacting at the top is 2.54 m/s.
3.2. Three-point bend test experiments
Representative force displacement curves for ribbons of for-mulas A and B are shown inFig. 11. The formula A ribbons exhibit a sharp rise in force of approximately constant gradient until the breakage force is reached. In contrast the formula B ribbons show a gradually increasing force with displacement, which slows down until it drops quickly after the maximum force is reached. The trends were consistent across the ten samples tested of each for-mulae; differences may be caused by the variation in the me-chanical properties of the ribbons, however the difference in their shape could also contribute towards this (seeFig. 2). The formula B ribbons have a radius of curvature of approximately 150 mm along their length, whereas the formula A ribbons are approximatelyflat. The formula B ribbons were loaded from the convex side in the 3-point bend tests. Visual observation indicates that failure occurs long before the maximum force is reached, however when broken the two fragments fall towards each other and provide further resistance to the driving beam before the two fragments fall downwards, and hence cause the behaviour observed in Fig. 11. Furthermore, loading of an arch delays failure, since the normal force is partially redirected laterally through the sample. Therefore this represents the maximum strength measured by this method, since if they were loaded from the concave side they would fail more easily. Nevertheless they are weaker than formula A ribbons. The averages and distributions of the breakage force of for-mulae A and B ribbons are shown inTable 5. The average breakage force of formula A ribbons is more than double that of the formula B ribbons. For ribbons of each formula the coefficient of variation is comparable and of an acceptable range for the ten ribbons tested.
3.3. Three-point bend test simulation
Since the ribbons are very narrow, they are expected to break by snapping, which is caused by tensile and shear breakage. Therefore the bonds of the ribbons are expected to break in the simulations by exceeding their tensile or shear strength. The bond shear strength is manipulated in separate three-point bend si-mulations, along with the variation of bond strength and bond Young's modulus, whereas the compressive and tensile bond strengths are set to equal the shear strength. In all cases the Poisson ratio and bond radius multiplier werefixed at 0.25 and 1, respectively. The parameters used in separate simulations, along with the corresponding breakage forces, are shown inTable 6and
7for formulas A and B, respectively. A wide range of values were tested for Young's modulus and bond strength as the initial value selected did not yield a breakage force close to that of the ex-perimental material. No direct relationship between the bond strength and Young's modulus to the breakage force was found. 0 10 20 30 40 50 60 70 80 90 A 50 rpm 50 mm A 50 rpm 100 mm A 65 rpm 50 mm A 65 rpm 100 mm B 50 rpm 50 mm B 50 rpm 100 mm B 65 rpm 50 mm B 65 rpm 100 mm Num ber
of ribbons im
pacting
[image:6.595.46.288.595.724.2](%) at top at bottom
For this reason the values were simply manipulated in an attempt to achieve the desired breakage force.
An increase in the bond strength results in an increased ribbon breakage strength (as expected), whereas an increase in bond Young's modulus leads to an increase in ribbon strength in some cases, but a decrease in ribbon strength in others. An infinite
number of combinations of bond strength and Young's modulus able to reproduce the experimental breakage data should exist, however in this case we adopt a bond strength and Young's modulus of 2.9 and 60 MPa, respectively for formula A, and 4.5 and 300 MPa, respectively for formula B as they gave predictions clo-sest to the experimental 3-point bend test results.
3.4. Mill simulation
The evolution of force, total contact area and stress on each bar of the mill for the simulation of formula A sheets, 50 mm in length under a mill speed of 50 rpm are shown inFigs. 12–14, respec-tively.Fig. 12shows that the force on an individual bar rises ra-pidly from zero to a sharp peak, before reducing rara-pidly to zero, which approximately coincides with the force increase on the next bar. As would be expected, there is no obvious discrepancy be-tween the forces acting on different bars. The peak force on the bars is initially steady, at approximately 5 N, but rises in an
0
0.5
1
1.5
2
2.5
3
3.5
4
4.5
A
50 rpm
50 mm
A
50 rpm
100 mm
A
65 rpm
50 mm
A
65 rpm
100 mm
B
50 rpm
50 mm
B
50 rpm
100 mm
B
65 rpm
50 mm
B
65 rpm
100 mm
Ribbon im
pact
velocity
(m
/s)
[image:7.595.132.451.60.231.2]at top
at bottom
Fig. 10.Average ribbon impact velocities of formulae A and B ribbons at the top and bottom of the mill.
0 0.5 1 1.5 2 2.5 3
0 0.5 1 1.5 2 2.5 3
F
o
rc
e (N)
Displacement (mm)
Formula A
[image:7.595.51.269.259.388.2]Formula B
[image:7.595.302.554.283.376.2]Fig. 11.Representative force displacement curves for ribbons of formulae A and B.
Table 5
Averages and distributions of ribbon breakage forces.
Measurement Ribbon breakage force (N)
Formula A B
Average 2.85 1.13
Minimum 1.73 0.62
Maximum 3.99 1.50
Standard deviation 0.69 0.25
Coeff. of variation 24.2% 21.7%
Table 6
Bond parameters for formula A ribbons.
Test case Young's modulus (MPa)
Bond strength (MPa)
Ribbon breakage force (N)
1 0.2 0.032 0.07
2 2.0 0.032 0.04
3 2.0 0.2 0.01
4 2.0 1.25 0.14
5 2.0 2.0 0.26
6 4.0 0.2 0.22
7 8.0 0.2 0.20
8 8.0 0.4 0.43
9 60 2.9 2.98
[image:7.595.32.285.438.515.2]10 60 4.0 3.93
Table 7
Bond parameters for formula B ribbons.
Test case Young's modulus (MPa)
Bond strength (MPa)
Ribbon breakage force (N)
1 100 5 0.21
2 100 25 1.30
3 300 3.5 0.81
4 300 4.5 1.06
5 300 6 1.45
6 300 10 1.96
7 300 25 4.23
0 5 10 15 20 25 30 35 40 45 50
0 1 2 3 4 5 6 7 8 9 10
F
o
rce (N)
Time (s)
Bar 1 Bar 2 Bar 3 Bar 4
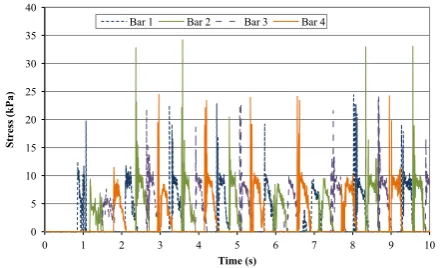
[image:7.595.32.284.553.670.2] [image:7.595.317.536.593.722.2]approximately linear fashion after 2 s of simulation time. The rise in force appears to be due to the ribbons breaking up into smaller fragments and hence creating a greater area contacting the bars, as shown in Fig. 13, since the trend matches the force trend re-markably well. Consequently the average peak stresses, calculated byEq. (1), remain relatively unchanged throughout the simulation, as shown inFig. 14.
The maximum stress of each shearing event (continuous period of greater than zero force on a given bar) is determined, and the average maximum stress of all shearing events is considered to provide a characteristic stress of the mill under a given operation condition. These stresses are shown in Table 8, along with the average duration of each shearing event,t, and the corresponding strain,
Γ
, calculated usingEq. (2), whereVris the radial distance of the centre point of a bar multiplied by the rotational speed. For the formula A ribbons there is minimal effect of sheet length and ro-tational speed on the prevailing stresses; however an increase in rotational speed causes a decrease in the average stress duration, and consequently the shear strain. This may be due to the ribbonfragments being moved away from the shearing zone more rapidly at 65 rpm than 50 rpm. The prevailing stresses and strains are significantly lower for the formula B ribbons. This is due to these ribbons being slightly narrower than the clearance (0.9 mm compared to 1 mm), hence these results are not expected to be representative of the real milling conditions for formula B ribbons. Consequently the prevailing conditions of stress and strain pre-dicted for formula A ribbons are also applied to formula B ribbons in the shear cell.
3.5. Ribbon impact experiments
As shown in Figs. 9 and 10, the impact velocity distribution showed little variation with the milling parameters, hence the same conditions were used for impacts representing each mill condition and formula. Forty ribbons were randomly selected for each formula, ten of these (25%) were subjected to impacts at 2.75 m/s (representing impacts at the top) and thirty (75%) were subjected to impacts at 4 m/s (representing impacts at the bot-tom). Drop heights of 60 and 100 mm were found to provide im-pact velocities of 2.75 and 4 m/s, respectively. Visual observation indicated that the formula B ribbons were more prone to breakage, and the extent of breakage increased significantly when the im-pact velocity was increased from 2.75 to 4 m/s. Fig. 15 shows images immediately after impact of both ribbon formulas at the two velocities.
3.6. Ribbon shearing experiments
The ribbons of formulae A and B were tested independently. In each case the mass of fragments remaining from each impact ve-locity was divided equally into four samples for testing under both mill speeds and for both sheet length conditions. For a given mill condition the sample material comprised of the combined frag-ments from the 2.75 and 4 m/s impacts. The ribbon shearing ex-periments were carried out as described inSection 2.6, using the maximum stress and strain conditions shown inTable 8. Since the stress and strain conditions in the mill for the formula B ribbons were deemed to be unrealistically low, these ribbons were tested using the same conditions as those estimated by the DEM for the formula A ribbons. The fraction of the fragments passing through the 3.35 mm sieve after each shearing event is shown inTable 9
for each mill condition for the two ribbon formulas. All fragments of formula A ribbons pass through the sieve, and are therefore predicted to exit the mill after three to six shearing events. Fewer shearing events are required to reduce all fragments to a sieve size
o 3.35 mm with sheet lengths of 100 mm in comparison to 50 mm. This is expected to be largely caused by the increased strain for these conditions (see Table 8), since the maximum stresses are relatively similar.
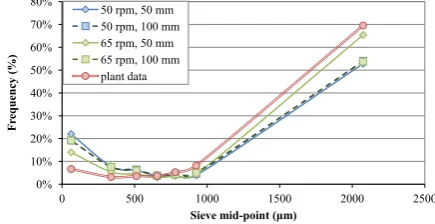
The size distributions of all material which has passed through the 3.35 mm sieve for the different mill conditions are shown in
[image:8.595.61.277.59.189.2]Figs. 16and17, for formulas A and B, respectively. The predictions of milling performance for formula A ribbons are compared to plant milling data of these ribbons in the described mill inFig. 16. The predictions suggest that in all tested milling conditions, more than half of the material is greater than 1 mm (sieve mid-point 2175
μ
m corresponds with 1 – 3.35 mm), with a significant amount offines (o 250μ
m) being generated. These predictions match the plant data reasonably well. The difference amongst the predicted size distributions for different milling conditions is small; the greatest difference being that at 65 rpm with ribbons of 50 mm the fraction of material greater than 1 mm is notably greater and there are fewerfines compared to the other cases. This difference is expected to arise due to the lower strain applied in the shear cell experiments for 65 rpm with ribbons of 50 mm. ThisFig. 13.Evolution of total contact area on the bars at 50 rpm for formula A sheets 50 mm in length.
0 5 10 15 20 25 30 35 40
0 1 2 3 4 5 6 7 8 9 10
Stress (kP
a
)
Time (s)
Bar 1 Bar 2 Bar 3 Bar 4
Fig. 14.Evolution of stress on the bars at 50 rpm for formula A sheets 50 mm in length.
Table 8
Characteristic normal stresses and shear strains in the mill for formulae A & B ribbons.
Formula A A A A B B B B
Mill speed (rpm) 50 50 65 65 50 50 65 65
Sheet length (50 mm) 50 100 50 100 50 100 50 100
Max stress (kPa) 26.8 26.7 27.3 29.6 0.6 1.4 1.2 1.6 Average stress (kPa) 5.2 5.3 6.4 6.1 0.000 0.036 0.036 0.032 Average stress duration,
tshear(s)
0.19 0.22 0.08 0.1 0.05 0.03 0.03 0.02
Strain ( ) 168 250 93 116 43 26 29 22
Angle of shear cell ro-tation (°)
[image:8.595.58.280.224.358.2]milling condition gives the closest prediction to the plant data, although overestimates the amount of fines. A number of as-sumptions are involved in the prediction approach taken here, such as the assumption that all ribbon fragments layflat in the mill before being sheared, and the assumption that the surface of the shear cell is similar to that of the bars and mill mesh. The teeth of the shear cell gripping rings could lead to wear across the rib-bon surface that does not occur in the mill, thus generating a greater quantity offines. Further to this, the shear cell tests used in the prediction approach ensure all material is sheared for the full duration of the shearing event, thus small fragments may be
broken further, whereas in the millfine particles will percolate through the fragments and exit the mill. These factors would contribute to the overestimate offine particle generation.
The milling predictions of the formula B ribbons are shown in
[image:9.595.74.511.56.474.2]Fig. 17. As with the formula A ribbons, the majority of the mill products are either 4 1 mm or o 250
μ
m. However, there is a much greater change in size distribution with the milling condi-tions, with the fraction 4 1 mm varying from 16 to 54%. The greatest extent of breakage (more materialo600μ
m) occurs for 50 rpm and 100 mm, followed by 50 rpm and 50 mm, 65 rpm and [image:9.595.316.534.505.617.2]Fig. 15.Ribbons immediately after imact (a) formula A at 2.75 m/s, (b) formula B at 2.75 m/s, (c) formula A at 4 m/s, (d) formula B at 4 m/s.
Table 9
Mass of fragments passing through 3.35 mm sieve after each shearing event.
Formulation A A A A B B B B
Mill speed (rpm) 50 50 65 65 50 50 65 65
Sheet length (mm) 50 100 50 100 50 100 50 100
Number of events,N Fragment mass fraction,md/ms(%)
1 42 51 37 48 94 94 82 77
2 67 68 54 77 100 100 100 100
3 84 87 68 92 100 100 100 100
4 97 100 85 100 100 100 100 100
5 100 100 96 100 100 100 100 100
[image:9.595.35.282.525.619.2]6 100 100 100 100 100 100 100 100
100 mm, andfinally 65 rpm and 50 mm. When comparing to the conditions applied in the shear cell experiments (Table 8), this corresponds to an increase in strain causing an increase in breakage. The fraction of product in the 600
μ
m to 1 mm size range is predicted to be relatively unchanged by the milling conditions.Fig. 18shows the predicted size distributions of formula A and B ribbons with length 50 mm milled at 65 rpm. The quantity of
fines (o250
μ
m) is predicted to be similar for ribbons of both formulas, however formula B is predicted to have a greater amount of material 250–600μ
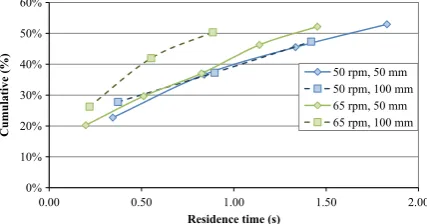
m, and a smaller fraction 41 mm, sug-gesting that formula B ribbons break more extensively in the mill. This is expected based on the 3-point bend test measurements (Table 5andFig. 11).The residence time of formula A material passing through the 3.35 mm sieve afterNshearing events is estimated using(Eqs. (5),
6)and(7), and is shown inFig. 19. The residence time distribution is strikingly similar for all conditions except for ribbons of 100 mm in length and a mill speed of 65 rpm, where the material is pre-dicted to exit the mill quicker. This discrepancy is caused by both the small number of shearing events required to ensure all frag-ments pass through the 3.35 mm sieve, and the shorter tshear predicted by the DEM mill simulations at 65 rpm. It should be
noted that the fragments that are too large to be sheared in the shear cell would be expected to generate some material small enough to exit the mill after each shearing event, as such the re-sidence time distribution shown in Fig. 19represents an under-estimate of the amount of material exiting the mill after a given time.
In this work, limited material was available, thus allowing only a narrow range of milling conditions to be investigated. If suffi -cient material were available, a wider range of stresses and strains could be applied in separate tests to determine their individual influences on the resulting breakage. Such testing would allow an empirical breakage relationship to be developed using theNeil and Bridgwater (1994)method, which when coupled directly with the evolution of stress during shearing events (e.g.Fig. 14), in a similar manner to that ofHare et al. (2011), would give a more accurate prediction of the milling performance. This would also allow modelling under different mill conditions to be carried out and the milling performance predicted without further experimental work.
4. Conclusions
A method for predicting the size reduction of dry compacted ribbons in a rotary bar mill has been described and implemented for two ribbon formulas. The method utilises a bonded sphere DEM model to represent the ribbons, with the bond properties determined by three-point bend test simulations compared to experiments. The DEM of the mill is used to predict the impact velocities and peak stresses and strains that the ribbons, and their fragments, experience. Ribbons are then subjected to impact events by dropping them from a controlled height, and then the fragments are sheared in a shear cell under the conditions pre-dicted from the DEM. Fragments that do not pass through a sieve, representing the outlet mesh size of the mill, are sheared again until all material passes through this sieve. A full size analysis then provides a prediction of the product size distribution of the mill. The method is applied here for mill speeds of 50 and 65 rpm, and ribbon feed lengths of 50 and 100 mm. It is predicted that these conditions do not significantly alter the product size distribution. There is a good agreement between the prediction and plant data of ribbon formula A. Formula B ribbons are predicted to break more easily than formula A ribbons in the mill, which correlates with the three-point bend measurements and qualitative analysis of the impact breakage.
If a greater amount of material is available for shear cell testing, the above method could be extended to develop a relationship of particle size to stress and strain. Such a relationship could be ap-plied to the full profile of the evolution of stress and strain in the mill, and thus lead to a more robust prediction method. In addition it would be beneficial to understand the relationship between the mass of material in the mill and the deflection of the mill mesh, and ultimately the influence of roller-mill clearance on stress and strain.
Acknowledgements
The authors would like to thank Prof. Jin Ooi for providing the rigid bonding contact model, and Dr. J-P. Morrissey for his very helpful guidance and assistance in implementing this model. The authors also wish to acknowledge the funding received from the EPSRC, through The University of Leeds, for the Impact Accelera-tion Award that initiated this work.
0% 10% 20% 30% 40% 50% 60%
0 500 1000 1500 2000 2500
F
re
que
nc
y (%)
Sieve mid-point (μm) 50 rpm, 50 mm
50 rpm, 100 mm
65 rpm, 50 mm
65 rpm, 100 mm
Fig. 17.Predicted size distributions of formula B ribbons.
0% 10% 20% 30% 40% 50% 60% 70%
0 500 1000 1500 2000 2500
F
requency (%)
Sieve mid-point (μm)
formula A
[image:10.595.59.280.205.320.2]formula B
Fig. 18.Comparison of predicted size distributions of the two ribbon formulas milled at 65 rpm with ribbon lengths of 50 mm.
0% 10% 20% 30% 40% 50% 60%
0.00 0.50 1.00 1.50 2.00
Cumulative (%)
Residence time (s)
[image:10.595.61.275.619.731.2]50 rpm, 50 mm 50 rpm, 100 mm 65 rpm, 50 mm 65 rpm, 100 mm
Appendix A. Supplementary material
Supplementary data associated with this article can be found in the online version athttp://dx.doi.org/10.1016/j.ces.2016.04.041.
References
Al-Asady, R.B., Osbourne, J.D., Hounslow, M.J., Salman, A.D., 2015. Roller compactor: the effect of mechanical properties of primary particles. Int. J. Pharm. 496, 124–136.
Brown, N.J., Chen, J.-F., Ooi, J.Y., 2014. A bond model for DEM simulation of ce-mentitious materials and deformable structures. Granul. Matter 16 (3), 299–311.
Calvert, G., Hassanpour, A., Ghadiri, M., 2011. Mechanistic analysis and computer simulation of the aerodynamic dispersion of loose aggregates. Chem. Eng. Res. Des. 89 (5), 519–525.
Favier, J.F., Abbaspour-Fard, M.H., Kremmer, M., Raji, A.O., 1999. Shape re-presentation of axi-symmetrical arbitrary particles in discrete element simu-lation using multi-element model particles. Eng. Commun. 16, 467–480. Grof, Z., Schoellhammer, C.M., Rajniak, P.,Štěpánek, F., 2011. Computational and
experimental investigation of needle-shaped crystal breakage. Int. J. Pharm. 407, 12–20.
Guigon, P., Simon, O., Saleh, K., Bindhumadhaven, G., Adams, M.J., Seville, J., 2007. Roll pressing. In: Salman, A.D., Hounslow, M., Seville, J.P.K. (Eds.), Granulation. Elsevier, Amsterdam, pp. 255–288.
Hare, C., Ghadiri, M., Dennehy, R., 2011. Prediction of attrition in agitated particle
beds. Chem. Eng. Sci. 66, 4757–4770.
Khorasani, M., Amigo, J.M., Sonnergaard, J., Olsen, P., Bertelsen, P., Rantanen, J., 2015. Visualization and prediction of porosity in roller compacted ribbons with near-infrared chemical imagin (NIR-CI). J. Pharm. Biomed. Anal. 109, 11–17. Kozhar, S., Dosta, M., Antonyuk, S., Heinrich, S., Bröckel, U., 2015. DEM simulations
of amorphous irregular shaped micrometer-sized titania agglomerates at compression. Adv. Powder Technol. 26, 767–777.
Miguelez-Moran, A.M., Wu, C.-Y., Seville, J.P.K., 2008. The effect of lubrication on density distributions of roller compacted ribbons. Int. J. Pharm. 362, 52–59. Moreno, R., Ghadiri, M., 2003. Effect of impact angle on the breakage of
agglom-erates: a numerical study using DEM. Powder Technol. 130, 132–137. Muliadi, A.R., Litster, J.D., Wassgren, C.R., 2013. Validation of 3-Dfinite element
analysis for predicting the density distribution of roll compacted pharmaceu-tical powder. Powder Technol. 237, 386–399.
Neil, A.U., Bridgwater, J., 1994. Attrition of particulate solids under shear. Powder Technol. 80, 207–219.
Paramanathan, B.K., Bridgwater, J., 1983. Attrition of solids–I: cell development. Chem. Eng. Sci. 38 (2), 197–206.
Salman, A., Hounslow, M., Seville, J.P.K., 2007. Granulation, First ed. Elsevier, Amsterdam.
Samata, A.K., Ng, K.Y., Heng, P.W.S., 2012. Cone milling of compactedflakes: process parameter selection by adopting the minimalfines approach. Int. J. Pharm. 422, 17–23.
Vanarase, A., Aslam, R., Oka, S., Muzzio, F., 2015. Effects of mill design and process parameters in milling dry extrudates. Powder Technol. 278, 84–93.