0022-538X/96/$04.0010
Copyrightq1996, American Society for Microbiology
Lack of Effect of Mouse Adenovirus Type 1 Infection on Cell Surface
Expression of Major Histocompatibility Complex Class I Antigens
SUSAN C. KRING†
ANDKATHERINE R. SPINDLER*
Department of Genetics, University of Georgia, Athens, Georgia 30602-7223
Received 11 March 1996/Accepted 7 May 1996
It has been proposed that adenoviruses establish and maintain persistent infections by reducing the class I
major histocompatibility complex-associated presentation of viral antigens to cytotoxic T lymphocytes, leading
to ineffective cell-mediated immunity and impaired clearance of infected cells (W. S. M. Wold and L. R.
Gooding, Virology 184:1–8, 1991). Early region 3 of human adenovirus types 2 and 5 encodes a 19-kDa
glycoprotein that associates with the class I major histocompatibility complex (MHC) antigens in the
endo-plasmic reticulum and prevents their maturation and transport to the cell surface. Early region 1A of human
adenovirus type 12 encodes a protein that inhibits class I MHC mRNA production at the transcriptional or
posttranscriptional processing level. Unlike human adenovirus infections, however, mouse adenovirus type 1
(MAV-1) infection of a variety of cell types did not affect the surface expression of 10 different mouse class I
MHC allotypes. MAV-1-infected cells also regenerated cell surface class I MHC antigens following proteolytic
removal as efficiently as mock-infected cells. The ability of cells to present antigen to class I MHC (
K
b)-ovalbumin-specific T-cell hybridoma cells was likewise unaltered by MAV-1 infection. Thus, the ability of
MAV-1 to persist cannot be explained by the model of reduced class I MHC-associated antigen presentation
proposed for human adenoviruses.
The importance of cytotoxic-T-lymphocyte (CTL)-mediated
immune responses in limiting and clearing viral infections has
been well documented in a number of viral systems (13, 51).
Class I major histocompatibility complex (MHC) antigens of
infected cells present viral antigens to CTLs, resulting in
CTL-mediated lysis and clearance of those cells. Interference with
T-cell-mediated immune surveillance is thought to allow viral
escape from immune clearance as well as persistence in the
host (6, 12, 48, 50).
Human adenoviruses have at least two mechanisms for
re-ducing the surface expression of the class I MHC antigens.
Early region 3 (E3) of human adenovirus types 2 and 5 (Ad2/5)
encodes a 19-kDa glycoprotein (E3 gp19K) that associates with
the class I MHC antigen within the endoplasmic reticulum
(ER) (1, 7, 28, 32, 42). The E3 gp19K-class I MHC antigen
complex is anchored in the ER by the E3 gp19K ER retention
signal, which prevents the maturation and cell surface
expres-sion of the anchored class I antigens (10). E1 of Ad12 encodes
a protein (E1A) that inhibits class I MHC mRNA production
at transcriptional or posttranscriptional processing steps (40).
In addition, Ad12-transformed cells have decreased expression of
the peptide transporter genes TAP1 and TAP2 (33), whose
en-coded proteins transport processed peptides to the ER for
bind-ing to class I MHC molecules (25, 30, 46). It has been proposed
that adenoviral persistence is due to down-regulation of class I
MHC antigen expression on the surfaces of host cells (23, 48).
While it is clear that human adenovirus infection results in a
reduction in cell surface levels of class I MHC antigens in at
least some cell types, Routes and Cook (35) have shown that a
majority of Ad2/5-infected human cells do not show major
decreases in cell surface levels of class I MHC antigen until
very late times postinfection, when cell death is imminent. The
one notable exception to this is the Ad5 E1-transformed cell
line 293. In 293 cells the level of decreased surface expression
of class I MHC antigens caused by Ad5 infection correlates
with the level of endogenous E1A expression (35, 36).
E3 gp19K has different binding affinities for, and
differen-tially affects the surface expression of, various mouse class I
MHC antigens (9, 39, 43). The effects of class I MHC cell
surface level reduction on cell-mediated immune responses to
infection and on adenoviral persistence have not been directly
demonstrated. In Ad2/5 infection of cotton rats, E3 gp19K is
involved in limiting the lymphocyte and monocyte/macrophage
response and the extent of pneumonia but the effect of E3
gp19K expression on viral persistence has not been analyzed
(16). Recombinant vaccinia viruses that express the Ad2 or
Ad5 E3 gp19K protein do not show any significant differences
in viral replication, lethality, or effect on CTL and natural killer
cell responses in mice (11, 17).
The study of mouse adenovirus type 1 (MAV-1) provides a
useful model of host-virus interactions in which both virus and
host can be manipulated. MAV-1 infection of
immunocompe-tent mice is most often associated with a subclinical, persisimmunocompe-tent
infection (31). Persistence is manifested by high serum
anti-body titers (19, 47) and prolonged viruria (up to 24 months
postinfection) in the absence of overt clinical signs (18, 47).
Thus, mouse adenovirus can be used to assess the biological
importance of the interactions between adenoviral and
host-cellular proteins in the natural host.
We analyzed the surface expression of class I MHC antigens
and the class I MHC-associated antigen presentation of
MAV-1-infected cultured mouse cells. The results of these
experiments indicated that MAV-1 infection did not alter
mouse class I MHC cell surface expression or antigen
presen-tation. The implications of these results for the molecular basis
of persistence in MAV-1-infected animals and for human
ad-enovirus infections are discussed.
MATERIALS AND METHODS
Cells.L929 cells were obtained from the American Type Culture Collection and cultured in Dulbecco’s modified Eagle’s medium (DMEM) supplemented * Corresponding author. Phone: (706) 8395. Fax: (706)
542-3910. Electronic mail address: [email protected].
† Present address: Department of Microbiology and Immunology, Emory University School of Medicine, Atlanta, GA 30322.
5495
on November 9, 2019 by guest
http://jvi.asm.org/
with 5% heat-inactivated bovine calf serum (Gibco/BRL). HeLa and 293 cells (American Type Culture Collection) were cultured in DMEM supplemented with 7 and 10% newborn bovine serum, respectively (Hazleton Biologics, Inc.). SVB6KH, SSSV, and CQ15 cell lines were obtained from Linda Gooding (Emory University) and were maintained in DMEM with 8% fetal bovine serum (FBS) (Gibco/BRL). RAG-1 cells (American Type Culture Collection) were cultured in Eagle’s modified media supplemented with Hanks balanced salt solution, twice the concentration of amino acids and vitamins, and 10% FBS. 37.1 cells, which are 3T6-derived cells that express the MAV-1 E1A gene region under control of the mouse mammary tumor virus promoter (41), were cultured in DMEM with 5% heat-inactivated bovine calf serum and 200mg of G418 (Gibco/BRL) per ml. E1A expression was induced in 37.1 cells by addition of 1025
M dexamethasone (Sigma Chemical Co.) to the culture media. C57SV cells (29) were obtained from Barbara Knowles (Jackson Laboratory) and cultured in DMEM plus 10% FBS. Rick Tarleton (University of Georgia) supplied the
interleukin-2 (IL-2)-producing ovalbumin-specific T-cell hybridoma cell line (B3.6.4.5) (26), which was cultured in DMEM with 10% FBS and 400mg of G418 per ml, and cultured T-cell growth factor-dependent CTLL-2 cells (44). All cells were cultivated in a 5% CO2atmosphere.
Viruses and antibodies.MAV-1 was obtained and passaged as previously described (3), and titers were determined on L929 cells. Ad5 was obtained from Arnold Berk (University of California, Los Angeles) and passaged in HeLa cells; titers were determined on 293 cells. Virus was adsorbed onto monolayers of cells at a multiplicity of 5 or 100 PFU per cell for 1 h at 378C. Virus was removed, and cells were rinsed in phosphate-buffered saline (PBS) and cultured for an addi-tional 22, 36, or 44 h in DMEM supplemented with 2% of the appropriate serum. For each experiment additional plates of mock- and MAV-1-infected cells were prepared and the success of the infection was monitored by the appearance of cytopathic effect.
Mouse anti-mouse monoclonal antibodies made against the following H-2 FIG. 1. Flow cytometry analysis of class I MHC antigen expression on the surface of adenovirus-infected cells. (A and B) L929 cells either mock infected or infected with MAV-1 at a multiplicity of 5 PFU per cell for 36 h were labeled with FITC-conjugated anti-H-2Kk(A) or anti-H-2Dk(B) antibodies. Negative control cells were treated with anti-H-2Ldantibody and then labeled with FITC-conjugated anti-mouse IgG antibody. (C) HeLa cells either mock infected or infected with Ad5 at a multiplicity of 5 PFU per cell for 18 h were labeled with FITC-conjugated anti-human HLA-A,B,C antibody. Negative control cells were labeled with FITC-conjugated anti-mouse IgG antibody. The mean fluorescence intensity for each curve is given in parentheses beside the key to each curve.
on November 9, 2019 by guest
http://jvi.asm.org/
antigens were purchased from Pharmingen: Dk, Kk, Db, Kb, Dd, Ld(which cross-reacts with Dband Dq), Kq, Ks, and Ds(which cross-reacts with Kd). The anti-Kkand -Dkantibodies were purchased as fluorescein isothiocyanate (FITC) conjugates. FITC-conjugated goat F(ab9)2anti-mouse immunoglobulin G (IgG) (Fisher Scientific) was used as a secondary antibody for visualization of the non-FITC-conjugated antibodies for flow cytometry and used alone as a negative
control for staining. FITC-conjugated mouse anti-human HLA-A,B,C antibody (Pharmingen) was used for HeLa cell analysis.
Immunofluorescent labeling and analysis. Cells were rinsed with PBS, trypsinized, and washed in PAB (PBS supplemented with 0.02% sodium azide and 1% bovine serum albumin). A total of 106
cells were incubated 30 min on ice in 50ml of PAB with 1mg of primary antibody perml. Cells were subsequently washed twice in PAB. When necessary, labeling with a secondary antibody was performed identically to the primary labeling. After washing, cells were resus-pended to a final concentration of 106/ml of PAB. Intensity of surface staining was detected by flow cytometry (Epics Elite; Coulter). Dead cells were detected by staining with 50mg of propidium iodide (Sigma Chemical Co.) per ml and were gated out of the analysis. Relative differences in fluorescence intensities were calculated by subtracting the mean fluorescence intensity of unstained cells from that of the labeled cells and then comparing the relative intensities of the labeled cells.
BFA and papain treatment.MAV-1-infected or mock-infected cell monolay-ers were exposed to 5mg of brefeldin A (BFA) (Sigma Chemical Co.) per ml for 1 to 3 h and then subjected to immunofluorescent labeling and analysis.
Papain treatment was performed essentially as previously described (38). Briefly, MAV-1-infected or mock-infected cell monolayers were trypsinized, washed in 0.15 M NaCl–0.01 M cysteine–0.01 M Tris-Cl (pH 7.5), resuspended at 1.53107
[image:3.612.57.299.82.154.2]cells per ml in the same buffer in the presence or absence of 10 mg
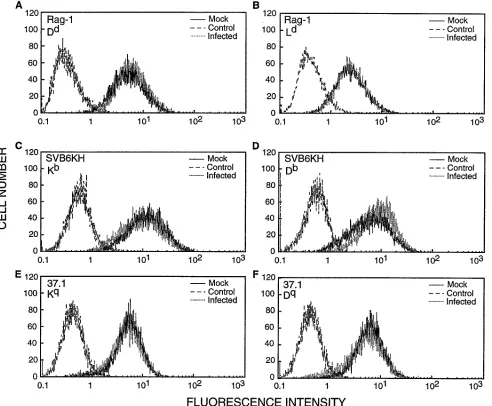
FIG. 2. Flow cytometry analysis of cell surface expression of class I MHC antigens on MAV-1-infected cells. MAV-1 was used at a multiplicity of 5 PFU per cell for 36 h. Mock-infected and infected RAG-1 cells (A and B), SVB6KH cells (C and D), and 37.1 cells (E and F) were treated with primary antibodies against the following H-2 antigens: Dd
(A), Ld (B), Kb
(C), Db (D), Kq
(E), and Dq
(F). They were then labeled with FITC-conjugated anti-mouse IgG antibody. Negative control cells were treated with primary antibodies against H-2 antigens not expressed on their surfaces, as follows: Kb
(A, E, and F), Ks
(B and D), and Dd
[image:3.612.65.557.276.682.2](C). They were then labeled with FITC-conjugated anti-mouse IgG antibody.
TABLE 1. Class I MHC antigens examined
Cell linea
Antigen(s)
L929 ...Kk, Dk SVB6KH...Kb, Db CQ15...Kq, Dq RAG-1 ...Kd, Dd, Ld SSSV ...Ds 37.1...Kq, Dq
aCell lines were able to support the replication of MAV-1, defined as a
minimum of a sixfold amplification of virus (assayed on L929 cells) following 4 days of incubation.
on November 9, 2019 by guest
http://jvi.asm.org/
of crude papain (Sigma Chemical Co.) per ml, and incubated in suspension for 1 h at 378C. Cells were subsequently resuspended in PAB and held on ice or incubated in growth media for 0.5 to 3 h to allow regeneration of surface antigen. Class I MHC surface antigen levels on control or papain-treated mock-infected or infected cells were analyzed by immunofluorescent labeling and analysis.
IL-2 assay.Antigen-presenting cells (C57SV and SVB6KH, both Kb) were
plated at a density of 5 3106/ml and MAV-1 or mock infected. At 12 h postinfection, 1mg of ovalbumin peptide (gift from Rick Tarleton) (34) per ml was added. At 24 h postinfection 105cells of the IL-2-producing, T-cell hybrid-oma cell line B3.6.4.5 (specific for the Kb-presented ovalbumin peptide) (22) per ml was added to the antigen-presenting cells and incubated for an additional 16 h. At 40 h postinfection, culture supernatants were collected and stored at
2208C. IL-2 activity was analyzed by quantitation of the 6-h [3H]thymidine incorporation of IL-2-dependent CTLL-2 cells cultured for 18 h in the presence of serial twofold dilutions of the culture supernatants (15, 45).
RESULTS
The surface expression of H-2K
kor H-2D
kantigens on L
cells is not altered by MAV-1 infection.
To determine whether
MAV-1 infection alters the surface expression of class I MHC
antigens, cultured cells were infected with MAV-1 and the
level of class I MHC antigens presented at the cell surface was
detected by immunofluorescent staining. L929 cells were
in-fected with 5 PFU of MAV-1 per cell or mock inin-fected for 22,
36, or 40 h. The cells were labeled with FITC-conjugated
antibodies to either the K
kor the D
kclass I MHC antigens, and
fluorescence intensity was quantitated by flow cytometry. No
alteration of surface expression of either the H-2K
kor the
H-2D
kantigens was detected on MAV-1-infected cells
com-pared with expression on mock-infected cells (Fig. 1A and B).
Previous reports demonstrating the ability of Ad2/5 to
di-minish class I MHC surface expression have used a multiplicity
of at least 100 PFU per cell (1, 20, 35, 36). The titers of our
MAV-1 stocks permitted a multiplicity of only 5 PFU per cell.
To demonstrate that the lack of an observable effect of MAV-1
infection on class I MHC surface expression was not a result of
the lower multiplicity of infection used, we measured the class
I MHC surface expression on HeLa cells infected with Ad5 for
12 and 18 h at a multiplicity of 5 PFU per cell. This
low-multiplicity Ad5 infection was capable of effecting a reduction
in the surface expression of class I MHC antigens compared
with expression on mock-infected cells (Fig. 1C), indicating
that Ad5 down-regulation of class I MHC surface expression
does not require a high-multiplicity infection. The reduction in
cell surface expression at 18 h postinfection shown in Fig. 1C
was 44%. Comparable values were seen in duplicate
experi-ments.
Cell surface expression of many different class I MHC
an-tigens is not altered by MAV-1 infection.
The ability of the
Ad2/5 E3 gp19K protein to bind and inhibit the surface
ex-pression of class I MHC antigens varies with the class I MHC
alleles expressed. The Ad2 gp19K associates with the mouse
H-2K
dand D
bbut not K
bor K
kantigens (8, 9, 43). To
deter-mine whether MAV-1 is able to alter surface expression of
class I MHC antigens other than those shown in Fig. 1, we
obtained additional cultured cell lines expressing different H-2
alleles. Table 1 lists cell lines that supported productive
MAV-1 infections and the class I MHC antigens analyzed with
each cell line. Each class I MHC haplotype antigen was
ana-lyzed individually to determine if MAV-1 infection altered its
surface expression. None of the class I MHC antigens
ex-pressed by the 10 different H-2 alleles tested (H-2K
b, H-2K
d,
H-2K
k, H-2K
q, H-2D
b, H-2D
d, H-2D
k, H-2D
q, H-2D
s, and
H-2L
d) displayed reduced surface expression following
infec-tion of the cells with MAV-1 (Fig. 2A through D and data not
shown). Duplicate experiments gave identical results.
Endogenous expression of MAV-1 E1A does not enable
MAV-1 infection to alter class I MHC surface expression.
Routes et al. (35, 36) demonstrated a correlation between the
level of endogenous E1A expression and the degree to which
Ad5 infection decreases the levels of class I MHC cell surface
antigens. We therefore analyzed whether increased levels of
MAV-1 E1A provided by endogenous expression would affect
class I MHC surface expression in MAV-1-infected cells. We
have generated a cell line (37.1) in which MAV-1 E1A
expres-sion can be induced to levels similar to those detected at early
times during a viral infection (41, 49). MAV-1-infected 37.1
cells have enhanced levels of E1A expression compared with
infected cells of the parent cell line, 3T6 (49). E1A expression
was induced in 37.1 cells for 24 h prior to and throughout the
22- or 36-h infection period. No difference in the surface levels
of H-2K
qor H-2D
qantigens between mock- and
MAV-1-infected 37.1 cells was detected (Fig. 2E and F).
MHC class I surface antigen levels are decreased by
inhi-bition of cellular transport.
To demonstrate that inhibition of
cellular transport would result in a detectable decrease in
sur-face class I MHC antigen levels on the mouse cell lines used in
the experiments described above, we used an inhibitor of
pro-tein secretion and membrane transport, BFA. Treatment with
BFA blocks membrane transport out of the ER by
redistrib-uting cis and medial Golgi components back to the ER (24).
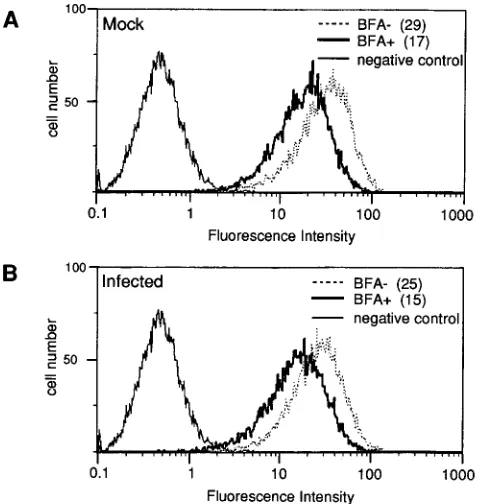
SVB6KH cells (H-2K
b) were MAV-1 or mock infected for 20
or 36 h prior to treatment with BFA for 3 h. MAV-1-infected
and mock-infected cells not treated with BFA served as
con-trols. Treatment with BFA caused a decrease in H-2K
bsurface
[image:4.612.58.298.72.324.2]expression of both mock- and MAV-1-infected cells to exactly
the same degree: 56% of that of untreated cells (Fig. 3). This
demonstrated that inhibition of cellular transport of the class I
FIG. 3. Flow cytometry analysis of class I MHC surface expression on cells treated with BFA. SVB6KH cells were mock infected (A) or infected with 5 PFU of MAV-1 per cell (B) for 36 h. Cells were treated with BFA for an additional 3 h (BFA1). Control cells were not treated (BFA2). Cells were incubated with anti-H-2Kb
antibody and then labeled with FITC-conjugated anti-mouse IgG. Negative control cells were labeled with FITC-conjugated anti-H-2Kk
antibody. The mean fluorescence intensity minus the fluorescence intensity of the negative control cells is indicated in parentheses beside the key for each curve.
on November 9, 2019 by guest
http://jvi.asm.org/
MHC antigens resulted in a clearly detectable decrease in cell
surface antigen levels.
Cell surface expression of newly synthesized class I MHC
antigens is not prevented by MAV-1 infection.
To examine the
[image:5.612.74.543.70.606.2]effect of MAV-1 infection on newly synthesized class I MHC
antigens, cell surface antigens were removed by proteolytic
treatment with papain, and regeneration of surface antigen
expression was observed following various times of recovery.
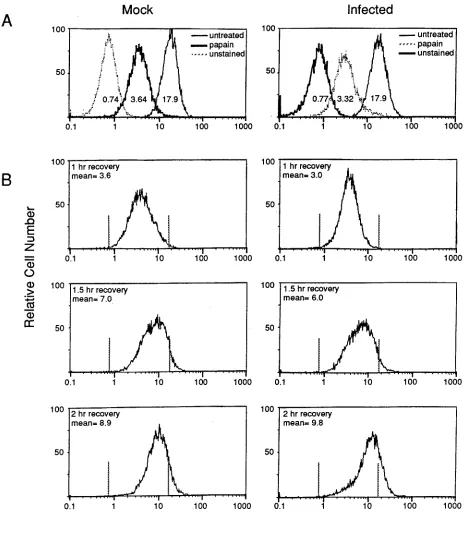
FIG. 4. Removal and regeneration of surface class I MHC antigens on mock- and MAV-1-infected cells treated with papain. (A) L929 cells were mock infected or infected with 5 PFU of MAV-1 per cell for 22 h and treated with 10 mg of papain per ml or left untreated. Treated and untreated cells were labeled with FITC-conjugated anti-H2-Kk
antibody. A sample of untreated cells was labeled with FITC-conjugated anti-mouse IgG as a negative control. The intensity of staining was analyzed by flow cytometry. The mean fluorescence intensity for each treatment is indicated beneath each curve. (B) Regeneration of surface antigens was analyzed on cells that were treated with papain as for panel A and allowed to recover in culture media for the indicated times. Vertical bars indicate the peak positions of the unstained or untreated controls in panel A. The mean equals the mean fluorescence intensity minus the mean intensity of the unstained cells.
on November 9, 2019 by guest
http://jvi.asm.org/
L929 cells were infected or mock infected for 22 h prior to
papain treatment to permit the analysis of class I MHC
ex-pression during a period when MAV-1 early proteins are
abun-dant and any inhibitory effects due to infection would be likely
to be operating. Twenty-two hours postinfection is near the
end of the early phase of MAV-1 infection (2). E1A and E3
mRNAs are first detectable at 14 h postinfection (2, 4). The E3
gp11K protein is detected as early as 16 h postinfection,
peak-ing between 24 and 28 h postinfection (5). Papain treatment
affected mock- and MAV-1-infected cells equivalently,
result-ing in 83 and 85% reductions in surface antigen compared with
the untreated cells, respectively (Fig. 4A). Following papain
treatment, cells were returned to growth media and cultured
for 0.5, 1, 1.5, or 2 h to permit regeneration of surface antigen.
The levels of regenerated surface antigen on mock-infected
and infected cells were equivalent at every recovery period
tested, and the data from one experiment are shown (Fig. 4B).
At 0.5 h of recovery, the amount of antigen was similar to that
at 1 h recovery (data not shown). The surface antigen levels
after 1, 1.5, or 2 h of recovery were 21, 41, and 52% of
un-treated controls for mock-infected cells and 18, 35, and 57% of
untreated controls for infected cells, respectively.
Class I MHC-associated antigen presentation to T cells is
not altered by MAV-1 infection.
To provide a functional assay
of the effect of MAV-1 infection on the class I MHC
presen-tation of antigen to T cells, we analyzed the ability of a CTL
hybridoma to recognize MHC-associated peptide on the
sur-faces of infected cells. Mock- and MAV-1-infected 5AK
a
3,
C57SV, and SVB6KH cells (all H-2K
b) were incubated with
ovalbumin peptide and used to stimulate IL-2 production by
H-2K
b-ovalbumin-specific T-cell hybridomas. The growth of
the CTLL-2 cells, quantitated by [
3H]thymidine incorporation,
is a measure of the IL-2 activity present in the T-cell
superna-tant and provides a functional assay of the H-2K
bexpression of
and peptide presentation by 5AK
a
3, C57SV, and SVB6KH.
Mock- and MAV-1-infected 5AK
a
3, C57SV, and SVB6KH
cells stimulated IL-2 production from the ovalbumin-specific
hybridoma cells to the same degree (Fig. 5 and data not
shown).
DISCUSSION
Representatives of human adenovirus subgenera A through
E decrease class I MHC cell surface antigen expression levels
(14, 27, 37). It has been proposed that this decrease allows
adenovirus-infected cells to escape CTL-mediated immune
surveillance, thus permitting viral persistence (48). Because of
the host-specific nature of adenoviruses, it has been difficult to
assess how important a reduction in levels of class I MHC cell
surface antigen is to viral persistence. We expected that
MAV-1, like human adenovirus, would reduce the surface
ex-pression of the class I MHC antigens, allowing us to analyze
the role of this interaction in MAV-1 pathogenesis and
persis-tence. Surprisingly, rigorous testing of the surface antigen
ex-pression levels of 10 different class I MHC alleles showed no
difference between mock- and MAV-1-infected cells (Fig. 1
and 2 and Table 1). The Ad2/5 E3 gp19K protein has different
binding affinities for class I MHC allotypes, and cells of distinct
class I MHC haplotypes vary in the extent to which the E3
gp19K protein reduces class I MHC surface expression (9, 39,
43). It seems likely that if MAV-1 infection induces the
down-regulation of class I MHC surface expression, at least one of
the class I MHC types tested would have been susceptible to
this effect. Routes and Cook have proposed that the cell type
or duration of infection is more relevant to the ability of the E3
gp19K protein to decrease class I MHC surface antigen levels
than is the MHC haplotype (35). In this study, seven different
cell lines (representing cells of renal, renal adenosarcoma,
connective tissue, and embryonic origin) were examined. The
time points of infection extended well into the late stages of
infection, when cell death was imminent. Our results imply that
cell types in which MAV-1 infection decreases class I MHC
surface expression are rare or nonexistent.
It is possible that MAV-1 infection resulted in only a slight
change in the overall levels of class I MHC surface expression,
which would be undetectable in a background of stable
anti-gens on the cell surface. However, the experiments in which
cells were treated with BFA demonstrated that inhibition of
cellular membrane transport and thus protein processing
(analogous to the block in class I MHC glycosylation effected
by the Ad2/5 E3 gp19K protein) brought about a clearly
de-tectable decrease in class I MHC antigen levels on the cell
surfaces even following a relatively short period (2 h) of
treat-ment. These results argue against the possibility that the class
I antigens present on the surface prior to infection remained at
high levels and thus obscured detection of the effects of
infec-tion on the synthesis, transport, and surface expression of
newly synthesized class I antigens.
Mock- and MAV-1-infected cells regenerated newly
synthe-sized class I antigens on the cell surface with equal kinetics
following proteolytic removal with papain, thus demonstrating
that infection did not block the expression of class I antigens.
There was no significant difference between cell viabilities of
the mock- and MAV-1-infected cell populations treated with
papain (data not shown). Thus, the regeneration of surface
class I antigens seen in the infected cells was not due to
pref-erential recovery of a subpopulation of uninfected cells in the
culture.
We also investigated the possibility that while there was no
apparent decrease in the amount of class I MHC surface antigen
on infected cells, antigen presentation by class I MHC might still
be functionally impaired. MAV-1-infected and uninfected cells
FIG. 5. Mock- and MAV-1-infected cells present exogenously added antigen to T-cell hybridomas equally. Mock- and MAV-1-infected SVB6KH (Kb
) cells were analyzed for their ability to present exogenously added ovalbumin (ova) peptide to IL-2-secreting T-cell hybridoma cells specific for peptide presented in the context of the Kbantigen. Mock-infected cells in the absence of peptide were used as negative controls. The ability of serial dilutions of the culture medium (dilution) to stimulate the [3H]thymidine incorporation of IL-2-dependent CTLL-2 cells (3H cpm) was measured. Each measurement was made in triplicate.
on November 9, 2019 by guest
http://jvi.asm.org/
stimulated class I MHC-restricted T-cell hybridomas equally,
in-dicating that infection did not effect a functional difference in the
class I MHC antigen-mediated presentation. This result is
fur-ther supported by studies in which immune spleen cells from
mice immunized with MAV-1 elicited the specific cytolysis of
MAV-1-infected mouse embryonic or lymphoid cells (21).
The ability of MAV-1 to persist cannot be explained by a
general mechanism in which adenoviral infection inhibits the
class I MHC presentation of antigen to CTL. The results
pre-sented here suggest two possible models for MAV-1-induced
viral persistence. One model is that a unique cell type exists in
which MAV-1 infection down regulates class I MHC surface
expression. For human adenoviral infections, the E3
gp19K-mediated decrease in class I MHC surface expression may not
be a general mechanism but may operate only in a small
pop-ulation of (293-like) cells within an individual, forming a focus
of viral persistence (35). While endogenous expression of
MAV-1 E1A activity did not induce a decrease of class I MHC
antigen levels in MAV-1-infected cells in our studies, it
re-mains possible that we did not analyze the unique cell type in
which this mechanism could operate.
An alternative model is that decreased class I MHC surface
expression is not important to the ability of MAV-1 to persist
and that another mechanism is active. Support for this model
comes from studies with recombinant vaccinia viruses that
express the Ad2 E3 gp19K protein. Mice infected with these
recombinant viruses exhibit no differences in viral replication
or lethality and no alteration of CTL or natural killer cell
responses compared with mice infected with recombinant
vac-cinia viruses containing either inverted or mutated copies of
the E3 gp19K coding sequence (11, 17). These results indicate
that the demonstrated ability of the E3 gp19K protein to
de-crease the surface expression of class I MHC antigens in vitro
may not be indicative of an ability to significantly alter the
cell-mediated immune response to an infection in vivo. More
insight might be gained when the types of cells that support
MAV-1 persistence are identified and their class I MHC
ex-pression characteristics are analyzed. Studies that define the
site of MAV-1 persistence in vivo are necessary for the
reso-lution of these questions.
ACKNOWLEDGMENTS
We thank Linda Gooding and Barbara Knowles for cell lines. We are grateful to Rick Tarleton for his generous gifts of cell lines, ovalbu-min peptide, and IL-2, as well as his expertise, suggestions, and criti-cisms throughout this work. The suggestions of Mary Case, Bob Ivarie, Lois Miller, and Kelley Moremen are also very much appreciated. We thank Clayton Beard, Angela Cauthen, and Kimberley Smith for help-ful discussions and critical review of the manuscript. The assistance of Steve Hilliard and Julie Nelson with flow cytometry and David Brown with figure preparation is gratefully acknowledged.
This work was supported by NIH grant R01 AI23762 to K.R.S. and by NIH predoctoral traineeship GM07103 to S.C.K. K.R.S. is the recipient of an NIH Research Career Development Award.
REFERENCES
1. Andersson, M., S. Pa¨a¨bo, T. Nilsson, and P. A. Peterson.1985. Impaired intracellular transport of class I MHC antigens as a possible means for adenoviruses to evade immune surveillance. Cell 43:215–222.
2. Ball, A. O., C. W. Beard, S. D. Redick, and K. R. Spindler. 1989. Genome organization of mouse adenovirus type 1 early region 1: a novel transcription map. Virology 170:523–536.
3. Ball, A. O., M. E. Williams, and K. R. Spindler. 1988. Identification of mouse adenovirus type 1 early region 1: DNA sequence and a conserved transac-tivating function. J. Virol. 62:3947–3957.
4. Beard, C. W., A. O. Ball, E. H. Wooley, and K. R. Spindler. 1990. Transcrip-tion mapping of mouse adenovirus type 1 early region 3. Virology 175:81–90.
5. Beard, C. W., and K. R. Spindler. 1995. Characterization of an 11K protein produced by early region 3 of mouse adenovirus type 1. Virology 208:457– 466.
6. Beersman, M. F. C., M. J. E. Bijlmakers, and H. L. Ploegh. 1993. Human cytomegalovirus down-regulates HLA class I expression by reducing the stability of class I H chains. J. Immunol. 151:4455–4464.
7. Burgert, H.-G., and S. Kvist. 1985. An adenovirus type 2 glycoprotein blocks cell surface expression of human histocompatibility class I antigens. Cell 41:987–997.
8. Burgert, H.-G., and S. Kvist. 1987. The E3/19K protein of adenovirus type 2 binds to the domains of histocompatibility antigens required for CTL rec-ognition. EMBO J. 6:2019–2026.
9. Burgert, H.-G., J. L. Maryanski, and S. Kvist. 1987. “E3/19K” protein of adenovirus type 2 inhibits lysis of cytolytic T lymphocytes by blocking cell surface expression of histocompatibility class I antigens. Proc. Natl. Acad. Sci. USA 84:1356–1360.
10. Cox, J. H., J. R. Bennink, and J. W. Yewdell. 1991. Retention of adenovirus E19 glycoprotein in the endoplasmic reticulum is essential to its ability to block antigen presentation. J. Exp. Med. 174:1629–1637.
11. Cox, J. H., M. L. Buller, J. R. Bennink, J. W. Yewdell, and G. Karupiah. 1994. Expression of adenovirus E3/19K protein does not alter mouse MHC class I-restricted responses to vaccinia virus. Virology 204:558–562. 12. Del Val, M., H. Hengel, H. Hacker, U. Hartlaub, T. Ruppert, P. Lucin, and
U. H. Koszinowski.1992. Cytomegalovirus prevents antigen presentation by blocking the transport of peptide-loaded major histocompatibility complex class I molecules into the medial-Golgi compartment. J. Exp. Med. 176:729– 738.
13. Doherty, P. C., W. Allan, M. Eichelberger, and S. R. Carding. 1992. Roles of alpha beta and gamma delta T cell subsets in viral immunity. Annu. Rev. Immunol. 10:123–151.
14. Eager, K. B., J. Williams, D. Breiding, S. Pan, B. Knowles, E. Appella, and R. P. Ricciardi.1985. Expression of histocompatibility antigens H-2K, -D, and -L is reduced in adenovirus-12-transformed mouse cells and is restored by interferong. Proc. Natl. Acad. Sci. USA 82:5525–5529.
15. Gillis, S., M. M. Ferm, W. Ou, and K. A. Smith. 1978. Cell growth factor: parameters of production and a quantitative microassay for activity. J. Im-munol. 120:2027–2032.
16. Ginsberg, H. S., U. Lundholm-Beauchamp, R. L. Horswood, B. Pernis, W. S. M. Wold, R. M. Chanock, and G. A. Prince.1989. Role of early region 3 (E3) in pathogenesis of adenovirus disease. Proc. Natl. Acad. Sci. USA 86:3823–3827.
17. Grunhaus, A., S. Cho, and M. S. Horwitz. 1994. Association of vaccinia virus-expressed adenovirus E3-19K glycoprotein with class I MHC and its effects on virulence in a murine pneumonia model. Virology 200:535–546. 18. Hartley, J. W., and W. P. Rowe. 1960. A new mouse virus apparently related
to the adenovirus group. Virology 11:645–647.
19. Heck, F. C., Jr., W. G. Sheldon, and C. A. Gleiser. 1972. Pathogenesis of experimentally produced mouse adenovirus infection in mice. Am. J. Vet. Res. 33:841–846.
20. Hermiston, T. W., R. Hellwig, J. C. Hierholzer, and W. S. M. Wold. 1993. Sequence and functional analysis of the human adenovirus type 7 E3-gp19K protein from 17 clinical isolates. Virology 197:593–600.
21. Inada, T., and H. Uetake. 1978. Cell-mediated immunity assayed by51Cr release test in mice infected with mouse adenovirus. Infect. Immun. 20:1–5. 22. Jameson, S. C., and M. J. Bevan. 1992. Dissection of major histocompati-bility complex (MHC) and T cell receptor contact residues in a Kb-restricted ovalbumin peptide and an assessment of the predictive power of MHC-binding motifs. Eur. J. Immunol. 22:2663–2667.
23. Levine, A. J. 1984. The adenovirus early proteins. Curr. Top. Microbiol. Immunol. 110:143–167.
24. Lippencott-Schwartz, J., L. C. Yuan, J. S. Bonifacino, and R. D. Klausner. 1989. Rapid redistribution of golgi proteins into the ER in cells treated with brefeldin A: evidence for membrane cycling from golgi to ER. Cell 56:801– 813.
25. Livingstone, A., S. J. Powis, A. G. Diamond, G. W. Butcher, and J. C. Howard.1989. A trans-acting major histocompatibility complex-linked gene whose alleles determine gain and loss changes in the antigenic structure of a classical class I molecule. J. Exp. Med. 170:777–795.
26. Nikolic-Zugic, J., and F. R. Carbone. 1990. The effect of mutations in the MHC class I peptide binding groove on the cytotoxic T lymphocyte recog-nition of the Kb-restricted ovalbumin determinant. Eur. J. Immunol. 20: 2431–2437.
27. Pa¨a¨bo, S., T. Nilsson, and P. A. Peterson.1986. Adenoviruses of subgenera B, C, D, and E modulate cell-surface expression of major histocompatibility complex class I antigens. Proc. Natl. Acad. Sci. USA 83:9665–9669. 28. Persson, H., M. Jansson, and L. Philipson. 1980. Synthesis and genomic site
for an adenovirus type 2 early glycoprotein. J. Mol. Biol. 136:375–394. 29. Pfizenmaier, K., S. H. Pan, and B. B. Knowles. 1980. Preferential H-2
association in cytotoxic T-cell responses to SV40 TASA. J. Immunol. 124: 1888–1891.
30. Powis, S. J., E. V. Deverson, W. J. Coadwell, A. Cireula, N. S. Huskisson, H. Smith, G. W. Butcher, and J. C. Howard.1992. Effect of polymorphism of an
on November 9, 2019 by guest
http://jvi.asm.org/
MHC-linked transporter on the peptides assembled in a class I molecule. Nature (London) 357:211–215.
31. Richter, C. B. 1986. Mouse adenovirus, K virus, pneumonia virus of mice, p. 137–161. In P. N. Bhatt, R. O. Jacoby, H. C. I. Morse, and A. E. New (ed.), Viral and mycoplasmic infections of laboratory rodents: effects on biomed-ical research. Academic Press, New York.
32. Ross, S., and A. J. Levine. 1979. The genomic map position of the adenovirus type 2 glycoprotein. Virology 99:427–430.
33. Rotem-Yehudar, R., S. Winograd, S. Sela, J. E. Coligan, and R. Ehrlich. 1994. Downregulation of peptide transporter genes in cell lines transformed with the highly oncogenic adenovirus 12. J. Exp. Med. 180:477–488. 34. Rotzschke, O., K. Falk, S. Stevanovic, G. Jung, P. Walden, and H.-G.
Ram-mensee.1991. Exact prediction of a natural T cell epitope. Eur. J. Immunol. 21:2891–2894.
35. Routes, J. M., and J. L. Cook. 1990. Resistance of human cells to the adenovirus E3 effect on class I MHC antigen expression: implications for antiviral immunity. J. Immunol. 144:2763–2770.
36. Routes, J. M., B. A. Metz, and J. L. Cook. 1993. Endogenous expression of E1A in human cells enhances the effect of adenovirus E3 on class I major histocompatibility complex antigen expression. J. Virol. 67:3176–3181. 37. Schrier, P. I., R. Bernards, R. T. M. J. Vaessen, A. Houweling, and A. J. van
der Eb. 1983. Expression of class I major histocompatibility antigens switched off by highly oncogenic adenovirus 12 in transformed rat cells. Nature (London) 305:771–775.
38. Schwartz, B. D., and S. G. Nathenson. 1971. Regeneration of transplantation antigens on mouse cells. Transplant. Proc. 3:180–182.
39. Severinsson, L., I. Martens, and P. A. Peterson. 1986. Differential associa-tion between two human MHC class I antigens and an adenoviral glycopro-tein. J. Immunol. 137:1003–1009.
40. Shemesh, J., R. Rotem-Yehudar, and R. Ehrlich. 1991. Transcriptional and posttranscriptional regulation of class I major histocompatibility complex genes following transformation with human adenoviruses. J. Virol. 65:5544–5548.
41. Smith, K., B. Ying, A. O. Ball, C. W. Beard, and K. R. Spindler. Interaction of mouse adenovirus type 1 early region 1A protein with cellular proteins pRb and p107. Submitted for publication.
42. Storch, T. G., and J. V. Maizel, Jr. 1980. The early proteins of the nonde-fective Ad2-SV40 hybrid viruses: the 19K glycoprotein is coded by Ad2 early region 3. Virology 103:54–67.
43. Tanaka, Y., and S. S. Tevethia. 1988. Differential effect of adenovirus 2 E3/19K glycoprotein on the expression of H-2Kband H-2Dbclass I antigens and H-2Kb
- and H-2Db
-restricted SV40-specific CTL-mediated lysis. Virol-ogy 165:357–366.
44. Tarleton, R. L. 1988. Trypanosoma cruzi-induced suppression of IL-2 pro-duction. I. Evidence for the presence of IL-2 producing cells. J. Immunol. 140:2763–2768.
45. Tarleton, R. L., and R. E. Kuhn. 1984. Restoration of in vitro immune responses of spleen cells from mice infected with Trypanosoma cruzi by supernatants containing interleukin 2. J. Immunol. 133:1570–1575. 46. Townsend, A., C. Ohlen, J. Bastin, H. G. Ljunggren, L. Foster, and K. Karre.
1989. Association of class I major histocompatibility heavy and light chains induced by viral peptides. Nature (London) 340:443–448.
47. van der Veen, J., and A. Mes. 1973. Experimental infection with mouse adenovirus in adult mice. Arch. Gesamte Virusforsch. 42:235–241. 48. Wold, W. S. M., and L. R. Gooding. 1991. Region E3 of adenovirus: a
cassette of genes involved in host immunosurveillance and virus-cell inter-actions. Virology 184:1–8.
49. Ying, B., and K. R. Spindler. Unpublished data.
50. York, I. A., C. Roop, D. W. Andrews, S. R. Riddell, F. L. Graham, and D. C. Johnson.1994. A cytosolic herpes simplex virus protein inhibits antigen presentation to CD81T lymphocytes. Cell 77:525–535.
51. Zinkernagel, R. M. 1993. Immunity to viruses, p. 1211–1250. In W. Paul (ed.), Fundamental immunology, 3rd ed. Raven Press, New York.