DEVELOPMENT AND VALIDATION OF NEW ANALYTICAL METHODS FOR THE ESTIMATION OF LACOSAMIDE BY UV SPECTROSCOPY, RP-HPLC AND
HPTLC METHOD
Dissertation Submitted to
The Tamil Nadu Dr. M.G.R. Medical University Chennai - 600032.
In partial fulfillment for the award of Degree of MASTER OF PHARMACY
(Pharmaceutical Analysis) Submitted by R.E.SEENUVASAN
Reg.No: 26106130
Under the Guidance of
Prof. (Dr.) T. VETRICHELVAN, M. Pharm., Ph. D., Principal & Head
Department of Pharmaceutical Analysis
ADHIPARASAKTHI COLLEGE OF PHARMACY
(Accredited by “NAAC” with a CGPA of 2.74 on a four point scale at “B” grade) MELMARUVATHUR – 603319
CERTIFICATE
This is to certify that the research work entitled “DEVELOPMENT AND VALIDATION OF NEW ANALYTICAL METHODS FOR THE ESTIMATION OF LACOSAMIDE BY UV SPECTROSCOPY, RP-HPLC AND HPTLC METHOD” submitted to The Tamil Nadu Dr. M.G.R Medical University in partial
fulfillment for the award of the Degree of Master of Pharmacy (Pharmaceutical Analysis) was carried out by R.E.SEENUVASAN (Reg No. 26106130) in the Department of Pharmaceutical Analysis under my direct guidance and supervision during the academic year 2011-2012.
Prof. (Dr.) T. VETRICHELVAN, M. Pharm., Ph.D.,
Principal & Head,
Place:Melmaruvathur Department of Pharmaceutical Analysis,
Date: Adhiparasakthi College of Pharmacy,
Melmaruvathur - 603 319.
CERTIFICATE
This is to certify that the dissertation entitled “DEVELOPMENT AND VALIDATION OF NEW ANALYTICAL METHODS FOR THE ESTIMATION OF LACOSAMIDE BY UV SPECTROSCOPY, RP-HPLC AND HPTLC METHOD” the bonafide research work carried out by R.E.SEENUVASAN (Reg. No. 26106130) in the Department of Pharmaceutical Analysis, Adhiparasakthi College of Pharmacy, Melmaruvathur which is affiliated to The Tamil Nadu Dr. M.G.R
Medical University under the guidance of Prof. (Dr.) T.VETRICHELVAN, M. Pharm., Ph.D.
Place: Melmaruvathur Prof. (Dr.) T. VETRICHELVAN, M.Pharm., Ph.D.
Date: Principal & Head,
ACKNOWLEDGEMENT
First and foremost, I wish to express my deep sense of gratitude to his HolinessARULTHIRU AMMA for his ever growing Blessings in each step of the study. I am grateful to THIRUMATHI LAKSHMI BANGARU ADIGALAR, Vice President, ACMEC Trust, Melmaruvathur for given me an opportunity and encouragement for the way in completing the study.
With great respect and honor, I extend my thanks to our Managing Director
MR. G. B. ANBALAGAN, Managing Trustee, Adhiparasakthi Hospital and Research Institute, Melmaruvathur for his excellence in providing skillful and compassionate spirit of
unstinted support to our department for carrying out research work entitled
“DEVELOPMENT AND VALIDATION OF NEW ANALYTICAL METHODS FOR THE ESTIMATION OF LACOSAMIDE BY DERIVATIVE SPECTROSCOPY, RP-HPLC AND HPTLC METHOD".
On a personal note I wish to avail my deep sense of thanks to
Prof. (Dr.) T.VETRICHELVAN, M. Pharm., Ph.D. Principal, Adhiparasakthi College of Pharmacy, for all the support offered by him during the period of my entire dissertation work, I wish to sincerely record my deepest gratitude and thanks for his kind cooperation and initiative guidance, constructive criticism with enthusiastic encouragement which enabling me to complete this project work successfully.
I have great pleasure in express my sincere heartfelt thanks to
Mrs. (Dr.) D. NAGAVALLI, M. Pharm., Ph.D., Professor, Mr. K. ANANDA KUMAR, M. Pharm., Associate Professor, and Mrs. G. ABIRAMI, M. Pharm., Assistant Professor,
Pharmaceutical Analysis for encouragement and support for the successful completion of this work.
My sincere thanks to our lab technicians Mr. M. GOMATHI SHANKAR,
D. Pharm., and Mrs.S. KARPAGAVALLI, D. Pharm., for their kind help throughout this work.
I am indeed very much thankful to the librarian Mr. M. SURESH, M.L.I.S., for providing all reference and literature for the completion of this project.
My sincere thanks to Mrs. PRATHIMA MATHUR, Managing Director, Pharma Information Centre, Chennai for helping in the literature collection.
My indepted thanks and appreciation goes to dear friend. Mr. R. SABARINATHAN,
Mr. R. LOGESH, Mr. G. VAMSI KRISHNA, Mr. D. MANI SAI, Mr. P. KISHORE Mr. C. KUMAR and my classmate for their non forgettable help, moral support, inspiration and kind co-operation constant encouragement and constructive criticism during the course of my work.
A special word of thanks to my ever loving College Staffs, Friends, Seniors and Juniors
fortheir kind moral support duringmy work
Finally yet importantly, I gratefully forward my affectionate thanks to my Mother
Mrs. E.SELVI, and my father Mr. R. ELUMALAI, and my brother Mr. E. SIVA and my sisters Mrs. E. SANKARI, Mrs. E. JEEVA for their frequent prayers, which has sustained me a lot in the successful completion of my project work.
Dedicated To
My Parents &
CONTENTS
SECTION TITLE Page No.
1. INTRODUCTION 1-67
1.1 Introduction to Analytical Chemistry 1-5
1.2.1 Introduction to UV – Spectroscopy 5-18
1.2.2 Introduction to Derivative Spectroscopy 19-21
1.3 Introduction to High Performance Liquid Chromatography 22-31 1.4 Introduction to High Pressure Thin Layer Chromatography 32-41
1.5 Validation 42-64
1.6 Basic Statistical parameter 65-67
2. LITERATURE REVIEW 68-73
2.1 Drug profile 68-71
2.2 Reported methods 72-73
3. AIM AND PLAN OF WORK 7475
3.1 Aim of work 74
3.2 Plan of work 75
4. MATERIALS AND METHODS 76-93
4.1 Materials 76-78
4.2 Methods 79-93
4.2.1 Derivative Spectrophotometric Method 80-83
4.2.3 High Performance Liquid Chromatography 84-89
4.2.4 High Performance Thin Layer Chromatography 90-93
RESULTS AND DISCUSSION 94-99
5. 5.1 Derivative Spectrophotometric Method 94-95
5.2 High Performance Liquid Chromatography 96-97
5.3 High Performance Thin Layer Chromatography 98-99
SUMMARY AND CONCLUSION 100-102
6.1 Derivative Spectrophotometric Method 100
6. 6.2 High Performance Liquid Chromatography 100
6.3 High Performance Thin Layer Chromatography 101-102
LIST OF FIGURES FIGURE
No. CONTENTS
1. IR SPECTRUM OF LACOSAMIDE
2. FIRST ORDER DERIVATIVE SPECTRUM OF LACOSAMIDE IN
DISTILLED WATER
3.
CALIBRATION CURVE OF LACOSAMIDE BY FIRST ORDER DERIVATIVE SPECTROPHOTOMETRIC METHOD USING DISTILLED WATER
4.
CHROMATOGRAM FOR THE EFFECT OF RATIO OF MOBILE PHASE OF LACOSAMIDE 50Mm POTASSIUM DIHYDROGEN ORTHO PHOSPHATE:ACETONITRILE: METHANOL (50:40:10)
5.
CHROMATOGRAM FOR THE EFFECT OF RATIO OF MOBILE PHASE OF LACOSAMIDE 50Mm POTASSIUM DIHYDROGEN ORTHO PHOSPHATE:ACETONITRILE: METHANOL (30:10:50)
6.
CHROMATOGRAM FOR THE EFFECT OF RATIO OF MOBILE PHASE OF LACOSAMIDE 50Mm POTASSIUM DIHYDROGEN ORTHO PHOSPHATE: ACETONITRILE: METHANOL (50:20:30)
7. OPTIMIZED CHROMATOGRAM OF LACOSAMIDE
8. LINEARITY CHROMATOGRAM OF LACOSAMIDE BY RP-HPLC
[ 70 µg/ mL ]
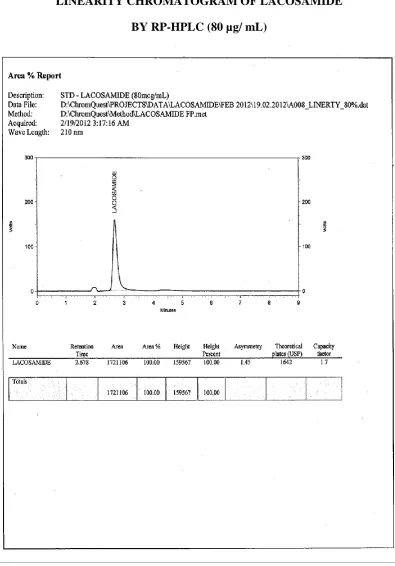
9. LINEARITY CHROMATOGRAM OF LACOSAMIDE BY RP-HPLC
[ 80 µg/ mL ]
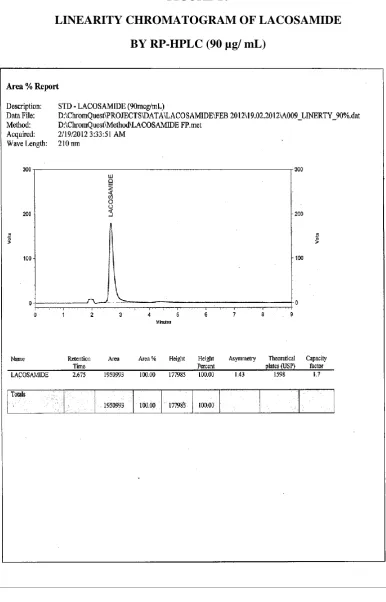
10. LINEARITY CHROMATOGRAM OF LACOSAMIDE BY RP-HPLC
[ 90 µg/ mL ]
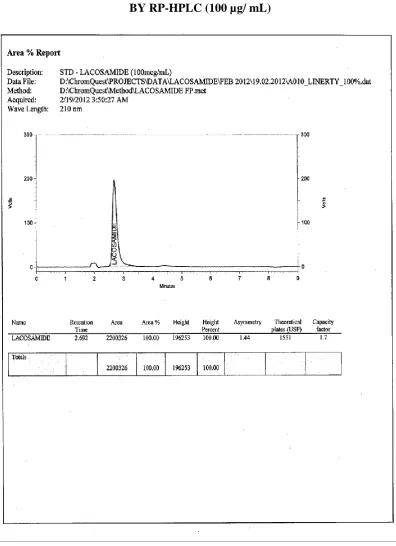
11. LINEARITY CHROMATOGRAM OF LACOSAMIDE BY RP-HPLC
[ 100 µg/ mL ]
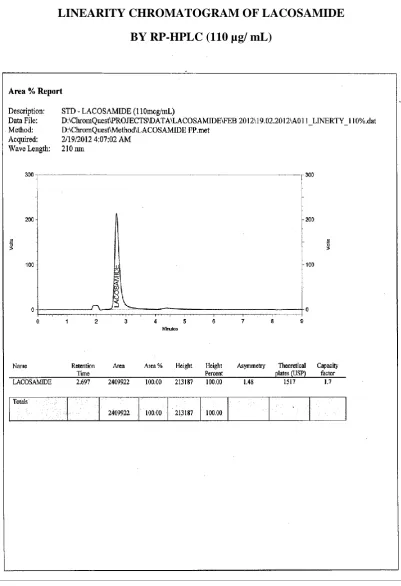
12. LINEARITY CHROMATOGRAM OF LACOSAMIDE BY RP-HPLC
[ 110 µg/ mL ]
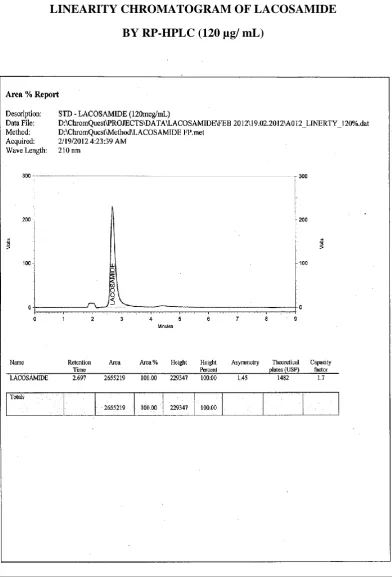
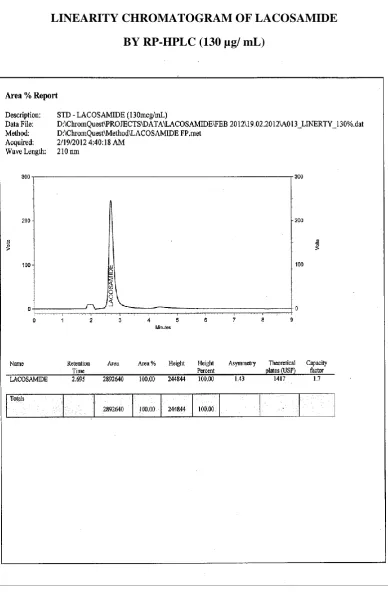
13. LINEARITY CHROMATOGRAM OF LACOSAMIDE BY RP-HPLC
[ 120 µg/mL ]
14. LINEARITY OF CHROMATOGRAM OF LACOSAMIDE BY RP-HPLC
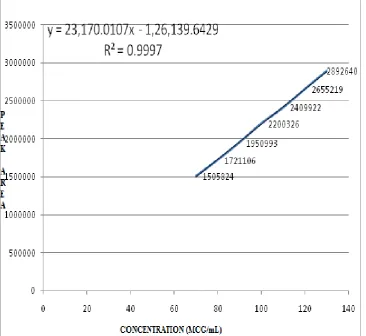
15. CALIBRATION CURVE OF LACOSAMIDE BY RP-HPLC
16. CHROMATOGRAM FOR ANALYSIS OF FORMULATION –
(LACOSAM) REPEATABILITY – 1
17. CHROMATOGRAM FOR ANALYSIS OF FORMULATION –
(LACOSAM) REPEATABILITY – 2
18. CHROMATOGRAM FOR ANALYSIS OF FORMULATION –
(LACOSAM) REPEATABILITY – 3
19. CHROMATOGRAM FOR ANALYSIS OF FORMULATION –
(LACOSAM) REPEATABILITY – 4
20. CHROMATOGRAM FOR ANALYSIS OF FORMULATION –
(LACOSAM) REPEATABILITY – 5
21. CHROMATOGRAM FOR ANALYSIS OF FORMULATION –
(LACOSAM) REPEATABILITY – 6
22. CHROMATOGRAM FOR ANALYSIS OF FORMULATION –
(LACOSAM) REPEATABILITY – 7
23. CHROMATOGRAM FOR ANALYSIS OF FORMULATION –
(LACOSAM) REPEATABILITY – 8
24. CHROMATOGRAM FOR ANALYSIS OF FORMULATION –
(LACOSAM) REPEATABILITY – 9
25. CHROMATOGRAM FOR FIRST RECOVERY ANALYSIS OF
FORMULATION (LACOSAM)
26. CHROMATOGRAM FOR SECOND RECOVERY ANALYSIS OF
FORMULATION (LACOSAM)
27. CHROMATOGRAM OF THIRD RECOVERY ANALYSIS OF
FORMULATION (LACOSAM)
28. SELECTION OF DETECTION WAVELENGTH FOR HPTLC METHOD
29. LINEARITY CHROMATOGRAM OF LACOSAMIDE BY HPTLC
[ 1 µg/ mL ]
30. LINEARITY OF CHROMATOGRAM OF LACOSAMIDE BY HPTLC
[ 2 µg/ mL ]
31. LINEARITY OF CHROMATOGRAM OF LACOSAMIDE BY HPTLC
32. LINEARITY OF CHROMATOGRAM OF LACOSAMIDE BY HPTLC [ 4 µg/ mL ]
33. LINEARITY OF CHROMATOGRAM OF LACOSAMIDE BY HPTLC
[ 5 µg/ mL ]
34. LINEARITY OF CHROMATOGRAM OF LACOSAMIDE BY HPTLC
[ 6µg/ mL ]
35. CALIBRATION CURVE OF LACOSAMIDE BY HPTLC
36. CHROMATOGRAM FOR THE ANALYSIS OF FORMULATION –
(LACOSAM) REPEATABILITY – 1
37. CHROMATOGRAM FOR THE ANALYSIS OF FORMULATION –
(LACOSAM) REPEATABILITY – 2
38. CHROMATOGRAM FOR THE ANALYSIS OF FORMULATION –
(LACOSAM) REPEATABILITY – 3
39. CHROMATOGRAM FOR THE ANALYSIS OF FORMULATION –
(LACOSAM) REPEATABILITY – 4
40. CHROMATOGRAM FOR THE ANALYSIS OF FORMULATION –
(LACOSAM) REPEATABILITY – 5
41. CHROMATOGRAM FOR THE ANALYSIS OF FORMULATION –
(LACOSAM) REPEATABILITY – 6
42. CHROMATOGRAM FOR FIRST RECOVERY ANALYSIS OF
FORMULATION (LACOSAM) BY HPTLC
43. CHROMATOGRAM FOR SECOND RECOVERY ANALYSIS OF
FORMULATION (LACOSAM) BY HPTLC
44. CHROMATOGRAM FOR THIRD RECOVERY ANALYSIS OF
FORMULATION (LACOSAM) BY HPTLC
LIST OF TABLES TABLE
NO. CONTENTS
1. SOLUBILITY PROFILE FOR LACOSAMIDE IN POLAR AND NON POLAR
SOLVENTS
2. OPTICAL CHARACTERISTICS OF LACOSAMIDE BY FIRST ORDER
DERIVATIVE SPECTROPHOTOMETRIC METHOD
3. QUANTIFICATION OF FORMULATION (LACOSAM) BY FIRST ORDER
DERIVATIVE SPECTROPHOTOMETRIC METHOD
4. INTRADAY ANALYSIS OF FORMULATION (LACOSAM) BY FIRST ORDER
DERIVATIVE SPECTROPHOTOMETRIC METHOD
5. INTERDAY ANALYSIS OF FORMULATION (LACOSAM) BY FIRST ORDER
DERIVATIVE SPECTROPHOTOMETRIC METHOD
6. RUGGEDNESS ANALYSIS FOR FORMULATION (LACOSAM) BY FIRST
ORDER DERIVATIVE SPECTROPHOTOMETRIC METHOD
7. RUGGEDNESS ANALYSIS FOR FORMULATION (LACOSAM) BY FIRST
ORDER DERIVATIVE SPECTROPHOTOMETRIC METHOD (DIFFERENT ANALYST)
8. RECOVERY ANALYSIS OF FORMULATION (LACOSAM) BY FIRST ORDER
DERIVATIVE SPECTROPHOTOMETRIC METHOD (DIFFERENT INSTRUMENT)
9. SYSTEM SUITABILITY PARAMETERS FOR THE OPTIMIZED
CHROMATOGRAM BY RP-HPLC
10. OPTICAL CHARACTERISTICS OF LACOSAMIDE BY RP-HPLC
11. QUANTIFICATION OF FORMULATION(LACOSAM) BY RP-HPLC
12. RECOVERY ANALYSIS OF FORMULATION (LACOSAM) BY RP-HPLC
13. OPTICAL CHARACTERISTICS OF LACOSAMIDE BY HPTLC
14. QUANTIFICATION OF FORMULATION(LACOSAM) BY HPTLC
15. INTRADAY ANALYSIS OF FORMULATION (LACOSAM) BY HPTLC
16. INTERDAY ANALYSIS OF FORMULATION (LACOSAM) BY HPTLC
LIST OF ABBREVIATIONS USED
IR - Infra red
ICH - International Conference on Harmonization λ - Lambda
LOD - Limit of Detection LOQ - Limit of Quantification μg/ mL - Microgram per Milliliter mg/ tab - Milligram Per tablet MW - Molecular weight mL - Millilitre
mM - Milli Mole nm - Nanometer
pH - Negative Logarithm of Hydrogen Ion % - Percentage
% RSD - Percentage Relative Standard Deviation Rt or t R - Retention Time
S.D. - Standard Deviation S.E. - Standard Error UV - Ultraviolet
USP - United States Pharmacopoeia
HPLC - High Performance Liquid Chromatography HPTLC - High Performance Thin Layer Chromatography
°
C - Degree Celsius Gms - Grams
l - Microlitre
rpm - Rotations Per Minute
- Micron
1
1. INTRODUCTION
1.1 Introduction to Analytical chemistry
(P C Kamboj, 2003. Annees A. Siddiqui, 2006)
The pharmaceutical analysis defined as “the branch of practical chemistry which deals with the resolution, separation, identification, determination and
purification of a given sample of a medicine, the detection and estimation of impurities, which may be present in drug substance (or) given sample of medicine”. The substance
may be a single compound or a mixture of compounds and may be in the form a tablet, pill, capsule, ampoule, liquid, mixture or an ointment.
The quality control tests involve methods which embrace chemicals, physio
-chemical/ instrumental, microbiological (or) biological procedures.
The pharmaceutical analysis deals with the subject of determining the
composition of material in terms of the elements or compound (drug) present in the system.
Any type of analysis involves two steps
Identification (qualitative) Estimation (quantitative)
In qualitative analysis, a reaction is performed in such a way as to indicate the formation of a precipitate, a change of a colour , the dissolution of a precipitate/ complex formation and the evaluation of a gas.
Quantitative analysis is performed ordinarily through five steps. They are sampling, dissolution, precipitation, measurement and calculation.
Method of assay
2 Qualitative analysis
This is practiced in order to establish the composition of a naturally occurring or
artificially synthesized/ manufactured substance.
Qualitative analysis 1. Chemical Methods
a) Titrimetric analysis b) Gravimetric analysis
c) Gasometric analysis
2. Physio - Chemical Methods (Instrumental Methods) 3. Microbiological Procedures
4. Biological Procedures I. Chemical Methods
a. Titrimetric Analysis
The analysis based on the fact that in all balanced chemical reactions utilized for the purpose. Equivalent weight of one substance reacts quantitatively with the
equivalent weight of the other substance. The difference types of titration are as follows Acid base titrations (neutralization titrations)
Non- aqueous titrations
Redox titrations (redox = oxidation - reduction) Precipitation titrations
Complexometric titrations
b. Gravimetric Analysis
This method involves the conversion of the element or a radical to be
3 c. Gasometric Analysis
This type of analysis involves the measurement of the volume of gases. The
volume of a gas set free in a given chemical reaction under the conditions similar to those described in the process. It may be noted that the volume of gas is taken at
normal conditions and pressure or standard temperature and pressure (NTP/ STP) which is a temperature of 00C (273.09o K) and the pressure of a column of 760mm/ Hg at 00C. If the reaction is taken place under different temperature and pressure the
volume is adjusted to standard conditions. A decrease in the volume of gas when a suitable reagent is placed to absorb one of the gases present. This decrease in volume is
also reduced to STP.
The gases cyclopropane, CO2, NO2, oxygen, octyl nitrite, Nitrogen, amyl
nitrite, ethylene and helium are determined by gasometric analysis. The measurement
of volume of gases is usually done by means of gas burettes or nitrometers.
II. Physio - Chemical Methods (Instrumental Methods)
Initially analytical methods were depending on extraction procedure, volumetric and gravimetric methods. All these methods are nearly replaced by advanced instrumental methods. These methods are more sensitive, specific and accurate but cost
factors of the instruments and their maintenance are the main draw backs. Various instrumental methods are classified depending on the property analyzed.
4
Sr. N0. MEHTOD BASIC PRINCIPLE
A ELECTROANALYTICAL METHODS
1 Potentiometry
Concerned with change in electrical properties of the system measures the change in electrode potential during a chemical reaction of the system
2 Conductometry Measures the change in electrical conductivity
during a chemical reaction
3 Polarography
Measure the current at various applied potential indicating the polarization at indicator electrode
4 Amperometry Measure the change (or decrease) in current at
a fixed potential during addition of titrant
B SPECTROSCOPIC METHODS
1
Absorption Spectroscopy (Ultraviolet-Visible and Infrared)
Measure the absorbance or percent transmittance during the interaction of monochromatic radiation (or particular wavelength) by the same
2 Fluorimetry
Measure the intensity of fluorescence caused by emission of electromagnetic radiation due to absorption of UV radiation
3 Flame Photometry
Measure the intensity of emitted light of particular wave length emitted by particular element
4 Turbidimetry Measure the turbidity of a system by passing light beam in a turbid media
5 Nephlometry Measure the opalescence of the medium by
reflection of light by a colloidal solution
5
Spectrometry atoms absorbs the monochromatic radiation
7 X-Ray Spectroscopy
Measure the position and intensity of spectral lines during emission of X ray spectrum by atoms under influence of X rays
8 Refractometry Measure the refractive index by causing
refraction of light by matter
9 Polarimetry Measure optical reaction by causing the
rotation of plane polarized light
C Mass Spectroscopy
Observe the position and intensity of signals in mass spectrum by causing the ionization of molecules
D NMR Spectroscopy
Observe the position and intensity lines in NMR spectrum when proton interact with electromagnetic radiation in radio frequency region
E Thermal Methods
Measure the physical parameters of the system as a function of temperature. It includes thermo gravimetry, derivative gravimetry, differential thermal analysis
F Radiometric Methods Measure the radioactivity either present naturally or induced artificially
III. Microbiological Methods
`In a microbiological assay, a comparison of inhibition of the growth of bacteria
6 IV. Biological Methods
When the potency of a drug or its derivative cannot be properly determined by
physical or chemical methods and where it is possible to observe the biological effects of the drug on some type of living matter. The biological assays are carried out. The
basis of such assay is to determine how much of the sample gives the same biological effect as a given quantity of the standard preparation. The sample and standard preparation are tested under identical conditions in all respect. In a typical bio – assay,
a stimulus is applied to a subject is referred to as the dose and is indicated by a weight or in terms of the concentration of the preparation. The application of stimulus on a
subject produces some observable effect and this is called the response. The response may be measured by the total weight or weight of some organ of the subject, blood sugar concentration, diameter of inhibition zone or by some other physiological
symptoms.
1.2.1 ULTRAVIOLET SPECTROSCOPY (
Beckett and Stenlake, 2002)
This technique of ultra violet spectroscopy is one of most frequently employed
method in pharmaceutical analysis. It involves the measurement of the amount of UV radiation (190 - 380 nm) or visible (380 - 800 nm) radiation absorbed by a substance in
solution. Ultraviolet spectroscopy involves the promotion of electrons (σ, π, n electrons) from the ground state to higher energy state. It is useful to measure the number of conjugated double bonds and also aromatic conjugation with the various
molecules.
The ultraviolet region of the electromagnetic spectrum is frequently subdivided
into as follows:
Far vacuum Ultraviolet region (10 - 200 nm)
7
Visible region (380 - 780 nm)
Origin and theory of ultraviolet spectra (Gurdeep R. Chatwal, et al., 2000)
Ultraviolet absorption spectra arise from transition of electron (or) electrons with in a molecule or an ion from a lower to a higher electron energy level and the
ultraviolet emission spectra arise from the reverse type of transmission. For radiation to cause electronic excitation it must be in the UV region of the electromagnetic spectrum. Energy absorbed in the ultraviolet region produces change in the electronic
energy of the molecule resulting from transition of valence electrons in the molecule. Three distinct types of electrons are involved in organic molecule. These are as follows
σ – Electrons
Theses electrons are involved in saturated bonds, such as those between carbons and hydrogen in paraffins. These bonds are known as σ bonds. As the amount of energy required to excite electron in σ bonds is much more than that produced by UV light, compounds containing σ bonds do not absorb UV radiation. These electrons do not
absorb near UV radiation but absorb at vacuum UV radiation.
π – Electrons
These electrons are involved in unsaturated hydrocarbons. Typical compounds with π bonds are trienes and aromatic compounds.
n– Electrons
These electrons are non bonded electrons which are not involved in any bonding between atoms in molecules. (eg.) S, O, N and halogens.
Types ofElectronic Transitions (Y.R. Sharma, 2009)
8
i. The anti bonding orbital which is associated with the excitation of σ – electrons is called σ* anti bonding orbital. So σ to σ* transition take place when σ (sigma) electron is promoted to antibody (σ) orbital. It is represented as σ σ*
transition.
ii. When a non - bonding electron gets promoted to an antibody sigma orbital (σ*) then it represents n - σ* transition.
iii. Similarly π π* transition represents the promotion of π electrons to an anti bonding π orbital π* orbital.
iv. When an n- electron (non- bonding) is promoted to anti bonding π orbital. It represents n π* transition.
Electronic excitation energies a) σ σ* transition
The organic compounds in which all the valence shell electrons are involved in
the formation of sigma bonds do not show absorption in the normal ultraviolet region, but occur in vacuum UV region (125 - 135).
9 b) n σ* transition
This type of transition takes place in saturated compounds containing one hetero
atom with unshared pair of electrons (n electrons). e.g. alcohol, ethers, aldehydes, ketones, amines etc.,
Such transition require comparatively less energy than that required for σ σ* transitions.
c) π π* transition
This type of transition occurs in the unsaturated centers of the molecule in compounds containing double or triple bonds and also in aromatics. The excitation of π
electrons smaller energy and hence transition of this type occurs at longer wavelength. e.g. alkenes, alkynes, carbonyl compounds, cyanides.
d) n π* transition
In this type of transition an electron of unshared electron pair on hetero atom gets excited to π* anti body orbital. This type of transition requires least amount of
energy out of all the transitions..
The absorption laws (Y.R. Sharma, 2009)
There are two laws which govern the absorption of light by the molecules.
These are,
(1) Lambert‟s Law
(2) Beer‟s Law
Lambert’s Law
When a beam of monochromatic radiation passes through a homogenous
absorbing medium, the rate of decrease of intensity of radiation with thickness of absorbing medium is proportional to the intensity of incident radiation.
I = I0e-kt
10
I = Intensity of emerged light t = Thickness of the medium
Beer’s Law
When a beam of monochromatic radiation is passed through a solution of an absorbing
substance, the rate of decrease of intensity of radiation with concentration of the absorbing solution is directly proportional to the intensity of incident radiation.
I = I0e-kc
Where, I0 = intensity of incident light
I = Intensity of emerged light
c = concentration of the absorbing species
From these laws, the following empirical expression of Beer - Lambert‟s Law was
constructed
Log (I0/IT) = Єct =A
Where, A= Absorbance or optical density or extinction co-efficient Є = Molecular extinction co-efficient
c = Concentration of drug
t = Path length
Limitations of Beer Lambert’s Law
1. When different forms of the absorbing molecules are in equilibrium as in keto-enol tautomers.
2. When fluorescence compounds are present.
3. When solute and solvent forms complex through some sorts of association.
Deviations from Beer’s Law (Gurdeep R. Chatwal, et al., 2000)
According to Beer‟s law, a straight line passing through the origin should be
11
intact the shape of an absorption curve usually changes with changes in concentration of solution and unless precautions are observed. Deviations from the law may be
positive or negative according to whether the resulting curve is concave upward or concave downward.
The latter two are generally known as instrumental deviation and chemical deviation.
Instrumental deviations
Stray radiation, improper slit width, fluctuation in single beam.
Chemical deviations
Hydrolysis, Association, Polymerization, Ionization, Hydrogen bonding.
Deviations from Beer’s Law can arise due to the following factors
1. Beer‟s law will hold over a wide range of concentration provided the
structure of coloured ion or of the coloured non electrolyte in the dissolved state does not change with concentration. If a coloured solution is having a
foreign substance whose ions do not react chemically with the coloured components, its small concentration does not affect the light absorption and
may also alter the value of extinction co - efficient.
2. Deviations may also occur if the coloured solute ions dissociates or associates.
12
4. Deviations may occur if monochromatic light is not used.
5. Deviations may occur if the width of slit is not proper and therefore it
allows undesirable radiations to fall on the detector.
6. Deviations may occur if the solution undergoes polymerization.
7. Beer‟s law cannot applied to suspensions but the latter can estimated calorimetrically after preparing a reference curve with known concentrations.
Choice of solvent (Gurdeep R. Chatwal, et al., 2000)
A suitable solvent for ultraviolet spectroscopy should meet the following
requirements.
(i) It should not itself absorb radiations in the region under investigation.
(ii) It should be less polar so that it has minimum interaction with the solute molecule.
The most commonly employed solvent is 95% ethanol. It is cheap, has good dissolving power and does not absorb radiation above 210 nm. In other words it is transparent
above 210 nm. Commercial ethanol should not be used as it contains some benzene which undergoes absorption in the UV range at about 280.Some other solvents which are transparent above 210 nm are n-hexane, cyclohexane, methanol, water and ether,
Benzene, chloroform, and carbon tetrachloride cannot be used because they absorb in the range of about 240 - 280 nm.Hexane and other hydrocarbon are sometimes
preferred to polar solvents because they have minimum interaction with the solute molecules.
Solvent Effects
The position and the intensity of absorption maximum is shifted for a particular chromophore by changing the polarity of the solvent. By increasing the polarity of
13
appreciable shift. The absorption maximum for the polar compounds is usually shifted with the change in polarity of the solvents. α and β unsaturated carbonyl compounds
show two different shifts.
a) n π* transition
The absorption band moves to short wavelength by increasing the polarity of the solvent. In n π* transition the ground state is more polar as compared to the
excited state. The hydrogen bonding with solvent molecules take place to lesser extent with the carbonyl group in the excited state.
b) π π* transition
The absorption band moves to longer wavelength by increasing the polarity of the solvent. The dipole interactions with the solvent molecules lower the energy of the
excited state more than that of the ground state.
CHROMOPHORES AND AUXOCHROMES (Jagmohan, 2005)
A. Chromophores
“The presence of one or more unsaturated groups responsible for electronic
absorption is called as chromophores”. e.g. C = C, C ≡ C, C = N, C ≡ N, C = O
B. Auxochromes
An Auxochrome is an auxiliary group which interacts with the chromophore causing a bathochromic shift. The presence of Auxochrome causes a shift in the UV or Visible absorption maximum to the longer wavelength.
14
INSTRUMENTATION (Gurdeep R. Chatwal, et al., 2000)
All photometers, colorimeters and spectrophotometers have the following basic
components
1) Radiation Source
i)It must be stable.
ii) It must be of sufficient intensity for the transmitted energy to be detected at
the end of the optical path.
iii) It must supply continuous radiation over the entire wavelength region in
which it is used.
UV region
Tungstan lamp, Hydrogen discharge lamp, Deuterium discharge lamp, Xenon arc Lamp.
2) Filters and monochromatoros
The filters and monochromators are used to disperse the radiation according to
the wavelength. The essential of a monochromator are an entrance slit, a dispersing element and an exit slit. The entrance slit sharply defines the incoming beam of
heterochromatic radiation. The dispersing element disperses the heterochromatic radiation into its component wavelengths where as exit slit allows the nominal wavelength together with a band of wavelength on either side of it. The position of the
dispersing element is always adjusted by rotating it to vary the nominal wavelength passing through the exit slit.
UV region
The dispersing element may be a prism or grating. The prisms are generally
15
transparent to radiation having the wavelength between 2000 and 3000 Abecause glass absorbs strongly in this region. Quartz and fused silica prism which are transparent
throughout the entire UV range are widely used in UV spectrophotometers.
Types of monochromators
1) Prisms
2) Gratings
1) Prisms are of two types
i) Refractive prism
ii) Reflective prism
2) Gratings are of two types
i) Diffraction grating
ii) Transmission grating
Visible region
Filters or monochromators or both are used
Filters
A light filter is a device that allows light of the required wavelength to pass but absorbs light of other wavelengths wholly or partially. Thus, a suitable filter can be
select a desired wavelength band. It means that a particular filter may be used for a specific analysis. If analysis is carried out for several species, a large number of filters
have to be used and interchanged. This method is very useful for routine analysis. Types of filters
16 3) Sample cell
These are containers for the sample and reference solutions and must be
transparent to the radiation passing through.
UV region
The cells made up of quartz.
Visible region
The cells made of glass.
4) Detectors
Detectors used in UV/Visible spectrophotometers can be called as photometric
detectors. In these detectors the light energy is converted to electrical signal which can be recorded. The types of detectors used are
Barrier Layer cell (or) Photo Voltaic cell.
Photo tubes (or) Photo emissive tubes Photomultiplier tubes
Photo diode
QUANTITATIVE SPECTROPHOTOMETRIC METHODS (Beckett and Stenlake, 2002)
The assay of an absorbing substance may be quickly carried out by preparing a solution in a transparent solvent and measuring its absorbance at a suitable wavelength.
The wavelength normally selected is a wavelength of maximum absorption (max),
17
a. Assay of substances in single component samples
Absorption spectroscopy is one of the most useful tools available to the chemist
for quantitative analysis. The most important characteristics of photometer and spectrophotometric method are high selectivity and ease of convenience. Quantitative
analysis (assay of an absorbing substance) can be done using following methods.
- Use of A1%1 cm values
- Use of calibration graph (multiple standard method)
- By single or double point standardization method.
i) Use of 𝐀𝟏%𝟏 𝐜𝐦 values
This method can be used for estimation of drug from formulations or raw
material, when reference standard not available. The use of standard value A1%1 cm avoids
the need to prepare a standard solution of the reference substance in order to determine its absorptivity, and is of advantage in situations where it is difficult or expensive to obtain a sample of the reference substance.
ii. Use of calibration graph
In this procedure the absorbances of a number (typically 4-6) of standard
solutions of the reference substance at concentrations encompassing the sample concentrations are measured and a calibration graph is constructed. The concentration of the analyte in the sample solution is read from the graph as the concentration
corresponding to the absorbance of the solution. Calibration data are essential if the absorbance has a non-linear relationship with concentration, or if the absorbance or
18
e.g. PH, temperature and time of heating, may rise to a significant variation of absorbance, and experimentally derived calibration data are required for each set of
samples.
iii. Single point standardization
The single point procedure involves the measurement of the absorbance of a sample solution and of a standard solution of the reference substance. The standard and the sample solution are prepared in similar manner; ideally the concentration of the
standard solution should be close to that of the sample solution. The concentration of the substance in the sample is calculated using following formula.
Ctest = A test × Cstd / Astd
Where,
Ctest and Cstd are the concentration in the sample and standard solutions
respectively.
Atest and Astd are the absorbance of the sample and standard solutions
respectively
b. Assay of substances in multi component samples
The spectrophotometric assay of drugs rarely involves the measurement of
absorbance of samples containing only one absorbing component. The pharmaceutical analyst frequently encounters the situation where the concentration of one or more
substances is required in samples known to contain other absorbing substances which potentially interfere in the assay. Unwanted absorption from these sources is termed irrelevant absorption and if not removed, imparts systematic errors to the assay of the
19
eliminate certain sources of interferences and permit the accurate determination of one or all of the absorbing components.
The basis of all the spectrophotometric technique for multicomponent samples is the property that at all wavelengths:
a) The absorbance of a solution is the sum of absorbances of the individual components.
b) The measured absorbance is the difference between the total absorbance
of the solution in the sample cell and that of the solution in the reference (blank) cell.
The determination of the multi-component samples can be done by using the following methods,
Simultaneous equation method
Absorbance ratio method
Geometric correction method
Orthogonal polynomial method
Difference spectrophotometry
Derivative spectrophotometry
Chemical derivatization
1.2.2 Derivative Spectrophotometry
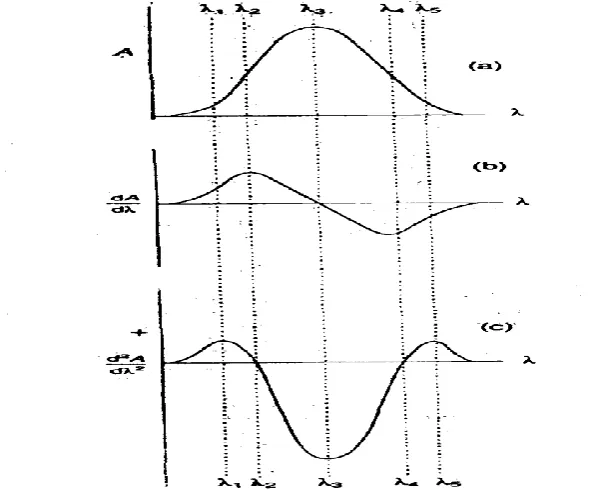
Derivative spectrophotometry involves the conversion of a normal spectrum to its first, second or higher derivative spectrum. The transformations that occur in the derivative spectra are understood by reference to a Gaussian band which represents an
20
The first derivative (D1) spectrum is a plot of the ratio of change of absorbance with wavelength against wavelength, i.e. a plot of the slope of the fundamental spectrum against wavelength or a plot of dA/dλ Vs λ. At λ2 and λ4, the maximum
positive and maximum negative slope respectively in the D°. Spectrums correspond
with maximum and a minimum respectively in the D1 spectrum. The λmax at λ3 is a
wavelength of zero slopes and gives dA/d λ 0, i.e. a cross-over point, in the D1
spectrum.
The second derivative (D2) spectrum is a plot of the curvature of the D° spectrum against wavelength or a plot of d2A/dλ2Vs λ. The maximum negative curvature at λ3 in the D° spectrum gives a minimum in the D2 spectrum, and at λ1 and
λ5 the maximum positive curvature in the D° spectrum gives two small maxima called
„satellite‟ bands in the D2
spectrum. At λ2 and λ4 the
Figure. The zeroth (a), first (b) and second (c) derivative spectra of a Gaussian band.Wavelengths of maximum slope and zero curvature in the D° spectrum
[image:33.595.143.440.416.661.2]21
In summary, the first derivative spectrum of an absorption band is characterized by a maximum, a minimum, and a cross-over point at the λmax of the absorption band.
The-second derivative spectrum is characterized by two satellite maxima and an inverted band of which the minimum corresponds to the λmax of the fundamental band.
These spectral transformations confer two principal advantages on derivative spectrophotometry. Firstly, an even order spectrum is of narrower spectral bandwidth than its fundamental spectrum. Secondly, derivative spectrophotometry discriminates in
favour of substances of narrow spectral bandwidth against broad bandwidth substances. This is because „the derivative amplitude (D), i.e. the distance from a maximum to a
minimum, is inversely proportional to the fundamental spectral bandwidth (14‟) raised to the power (n) of the derivative order
. Thus, D α (1/W)n
Consequently, substances of narrow spectral bandwidth display larger derivative amplitudes than those of broad bandwidth substance
22
The enhanced resolution and bandwidth discrimination increases with increasing derivative order. However, it is also found that the concomitant increase in
electronic noise. Inherent in the generation of the higher order spectra, the consequent reduction of the signal-to-noise ratio, place serious practical limitations on the higher
order spectra.
1.3 HIGH PERFORMANCE LIQUID CHROMATOGRAPHY
1.3.1 Introduction to chromatography (Gurdeep R. Chatwal, et al., 2000)
Chromatography may be defined as a method of separating a mixture of components
into individual components through equilibrium distribution between two phases. Chromatographic technique is based on the difference in the rate at which the components of a mixture move through a porous medium (stationary phase) under the
influence of some solvent or gas (mobile phase).
The chromatographic method of a separation, in general, involves the following
steps
1. Adsorption or retention of a substance or substance on the stationary phase.
2. Separation of the adsorbed substance by the mobile phase.
3. Recovery of the separated substance by a continuous flow of the mobile phase; the method being called elution.
4. Quantitative and qualitative analysis of the eluted substance
1.3.2. Introduction to HPLC (B.K. Sharma, 2006)
HPLC is a form of liquid chromatography to separate compounds that are dissolved in
23
rates due to difference in their partitioning behavior between the mobile liquid phase and the stationary phases.
Advantages:
Separation is fast and efficient
Continuous monitoring of the column effluent
Can be applied to the separation and analysis of very complex mixture
Accurate quantitative measurements
Repetitive and reproducible analysis using the same column
Adsorption, partition, ion exchange and exclusion column separations are
excellently made
Automation of the analytical procedure and data handling
Both aqueous and non aqueous samples can be analysed
Providing a high degree of selectivity for specific analysis
Determination of multiple components in a single analysis
1.3.2.1. Principle of separation in HPLC (Willard, 1986)
The principle of separation in normal phase and reverse phase mode is the adsorption. When a mixture of components is introduced in to a HPLC column, they
travel according to their relative affinities towards the stationary phase. The component which has more affinity towards the adsorbent travels slower. The components
which have less affinity towards the stationary phase travel faster. Since no two components have the same affinity towards the stationary phase the components
are separated.
Types of HPLC techniques
a) Based on modes of chromatography
24 Reverse phase mode
b) Based on principle of separation
Adsorption chromatography
Ion exchange chromatography
Ion pair chromatography
Size exclusion or gel permeation chromatography
Affinity chromatography
Chiral phase chromatography
c) Based on elution technique
Isocratic separation
Gradient separation
d) Based on scale of operation
Analytical HPLC
Preparative HPLC
Normal phase chromatography
In normal phase mode, the stationary phase (silica gel) is polar in nature and
the mobile phase is non-polar. In this technique, non-polar compounds travel faster and eluted first. This is because of less affinity between solute and stationary phase. Polar compounds are retained for longer time in the column because of more affinity
towards stationary phase and take more time to be eluted from column.
Reverse phase chromatography
25
compounds are retained for a longer time. Since most of the drugs and pharmaceuticals are polar in nature, they are not retained for a longer time and eluted faster, which is
advantageous. Different columns used are ODS (octadecyl silane) or C18, C8 and C4 etc.
Adsorption chromatography
The principle of separation is adsorption. The separation of components takes place because of the difference in affinity of compounds towards stationary phase.
Ion exchange chromatography
The principle of separation is ion exchange which is reversible exchange of functional groups. In ion exchange chromatography, an ion exchange resin is used to
separate a mixture of similar charged ions.
Ion pair chromatography
In ion pair chromatography a reverse phase column is converted temporarily in
to ion exchange column by using ion pairing agents like pentane, hexane, heptanes, octane, sulphonic acid sodium salt, tetramethyl or tetraethyl ammonium hydroxide.
Size exclusion or gel permeation chromatography
In this type of chromatography, a mixture of components with different molecular sizes are separated by using gels. The gel used acts as molecular sieve and
hence a mixture of substance with different molecular sizes is separated. Soft gels like dextran, agarose or polyacrylamide are used. Semi rigid gels like polystyrene, alkyl
26 Affinity chromatography
Affinity chromatography uses the affinity of the sample with specific stationary
phase. This technique is mostly used in the field of biotechnology, microbiology, biochemistry.
Chiral phase chromatography
Separation of optical isomer can be done by using chiral stationary phases. Different principles operate for different types of stationary phases and for different
samples. The stationary phases used for this type of chromatography are mostly chemically bonded silica gel.
Isocratic separation
In this technique, the same mobile phase combination is used throughout the
process of separation. The same polarity or elution strength is maintained throughout the process.
Gradient separation
In this technique, a mobile phase combination of lower polarity or elution
strength is used followed by gradually increasing the polarity or elution strength.
Analytical HPLC
Where only analysis of the samples are done. Recovery of the samples for
re using is normally not done, since the sample used is very low. e.g. µg quantities.
Preparative HPLC
Where the individual fractions of pure compounds can be collected using fraction collector. The collected samples are reused. eg. Separation of few grams of
27 HPLC instrumentation
Mobile phase (Mendham, et al., 2002)
A successful chromatographic separation depends upon difference in the
interaction of the solutes with the mobile phase and stationary phase, and in liquid chromatography the choice and variation of the mobile phase is of critical importance
in achieving optimum efficiency. However, before considering the theoretical aspects of solvent choice, here are a few general comments; HPLC grade solvents tend to be costly. To ensure consistent performance, the solvent needs to contain no more than
trace amounts of other materials, including water for organic solvents. And if the system uses a UV detector then even small traces of absorbing species will be unacceptable; they must be exhaustively removed. Particulates in the solvent are also
highly undesirable, with prolonged use they will lead to wear in the pump and injector and cause blockage of the column.
Although normal laboratory grade solvents could be suitably purified, this is a time consuming step and many laboratories prefer to purchase HPLC grade reagents,
including water. HPLC grade reagents can be used directly without further purification, although they may need to degassed immediately before use.
The choice of a suitable mobile phase is vital in HPLC and it is appropriate to
refer to the factor influencing this choice. Thus, the eluting power of the mobile phase is determined by its overall polarity, the polarity of the stationary phase and the nature
of the sample components. For normal phase separations, eluting power increases with increasing polarity of the solvent, for reverse phase separations, eluting power decrease
28 Solvent Reservoir (Ashutoshkar, 2005)
Solvent reservoir comprises of a 1dm3 glass bottle having lid and a 1/8 inch diameter
ptfc tube to convey the mobile phase from the reservoir to the degassers and then to the pump. As described above, any liquid entering the pump should be free from dust and particulate matter, otherwise these foreign substance may invariably give rise to
irregular pumping action, damage seals and valves, irregular behavior of column owing to its contamination, and ultimate blockade of column. Sometimes a stainless steel filter element (of filter size 2 μm) that could be conveniently positioned either in the ptfe -
tube in the reservoir or an in - line filter may be employed.
Degassing System
Many liquids dissolve appreciable amounts of atmospheric gases e.g. air or suspended air bubbles that may be a major cause of practical problems in HPLC,
specifically affecting the operation of the pump and the detector. However, all such problems may be avoided by degassing the mobile phase by subjecting the mobile
phase under vacuum, distillation, spurging with a fine spray of an inert gas of low solubility such as Argon or Helium or by heating and ultra sonic stirring.
Pumping Systems (Douglas A. Skoog, 2005)
The requirements for liquid chromatographic pumps include a) Ability to generate pressure of up to 6000 psi (Lb/in2)
b) Pulse free out put
c) Flow rates ranging from 0.1 to 10 mL/min d) Flow reproducibilities of 0.5% relative or better
e) Resistance to corrosion by a variety of solvents
Types of pumps
29
2. Syringe – type pump 3. Constant pressure pump
Sample injection system (Mendham, et al., 2002)
Introduction of the sample is generally achieved is one of two ways, either by
using syringe injection or through a sampling valve. Septum injectors allow sample introduction by a high pressure syringe through a self sealing elastomer septum. One of the problem associated with septum injectors is the leaching effect of the mobile phase
in contact with the septum, which may give rise to ghost peaks. In general, syringe injection for HPLC is more trouble same than in gas chromatography.
Although the problems associated with septum injectors can be eliminated by using stop flow septum less injection. Currently the most widely used devices in commercial chromatographs are the micro volume sampling valves. Which enable
sample to be introduced reproducibly in to pressurised columns without significantly interrupting the flow of the mobile phase. The sample is loaded at atmospheric pressure
in to an external loop in the valve and introduced into the mobile phase by an appropriate rotation of the valve. The volume of sample introduced, ranging from 2 µl to over 100 µl, may be varied by changing the volume of the sample loop or by using
special variable volumes sample valves. Automatic sample injectors are also available which allow unattended operation of the instrument. Valve injection is preferred for
quantitative work because of its higher precision compared to syringe injection.
Columns for HPLC (Willard, 1986)
Columns are constructed of heavy wall, glass lined metal tubing or stainless
steel tubing to withstand high pressures (up to 680 atm) and the chemical action of the mobile phase. The interior of the tubing must be smooth with a very uniform bore
30
Columns end fitting and connectors must be designed with zero void volume to avoid unswept corners or stagnant pockets of mobile phase that can contribute significantly to
extra column band broadening. Packaging is usually retained by inserting stainless steel frits into the end of the column.
Most column lengths range from 10 to 30 cm; short, fast columns are 3 to 8 cm long. For exclusion chromatography, columns are 50 to 100 cm long. The types of columns use in HPLC are,
1. Standard columns
2. Radial compression columns
3. Narrow-Bore columns 4. Short, fast columns
5. Guard columns and In - line filters
Guard column (Douglas A. Skoog, 2005)
Often, a short guard column is positioned ahead of the analytical column to
increase the life of the analytical column by removing particulate matter and contaminants from the solvents. In addition, in liquid-liquid chromatography, the guard column serves to saturate the mobile phase with the stationary phase so that
losses of the stationary phase from the analytical column are minimized. The composition of the guard column should be similar to that of the analytical columns,
the particle size is usually larger, however, to minimize pressure drop.
Detectors (Ashutoshkar, 2005)
The main function of the detector in HPLC is to monitor the mobile phase
coming out of the column, which in turns emits electrical signals that are directly proportional to the characteristics either of the solute or the mobile phase. The various
31 Bulk property detectors
They specifically measure the difference in some physical property of the solute
present in the mobile phase in comparison to the individual mobile phase, for instance a) Refractive-index detectors
b) Conductivity detectors.
Solute property detectors
They critically respond to a particular physical or chemical characteristic of the
solute (in question), which should be ideally and absolutely independent of the mobile phase being used. But complete independence of the mobile phase is hardly to be seen,
however signal discrimination is good enough to enable distinctly measurable experimental procedures with solvent changes, such as gradient elution. The solute property detectors include
a) UV- detectors
b) Fluorescence detectors.
Multipurpose detectors
Besides, providing a high degree of sensitivity together with a broad linear response attainable range invariably a particular situation critically demands detectors of more selective nature in the domain at „analytical chemistry‟ vis-a-vis „pharmaceutical analysis‟ that could be accomplished by using multipurpose detectors,
such as “Perkin-Elmer 3D system” that combines UV absorption, fluorescence and
conductometric detection.
Electro chemical detectors
Electro chemical detector in HPLC usually refers to either amperometric or coulometric detectors, that specifically measure the current associated with the
32
electrochemical oxidation, such detectors are quite selective, and this selectively may be further enhanced by monitoring the potential applied to the detector so as to
differentiate between various electroactive species. Naturally, electrochemical detection essentially makes use of conducting mobile phase, for instance, inorganic salts or
mixtures of water with water miscible organic solvents.
1.4 HIGH PERFORMANCE THIN LAYER CHROMATOGRAPHY
(Sethi, P.D., 1996, Sethi, P.D., Dilip Chareganokar.1999)
HPTLC is the most simple separation technique today available to the analyst. It
can be considered a time machine that can speed your work and allows you to do many
things at a time usually not possible with other analytical techniques.
1.4.1 Steps involved in HPTLC
1. Selection of HPTLC plates and sorbent
2. Sample preparation including any clean up and pre – chromatographic
derivatization
3. Application of sample
4. Development (separation)
5. Detection including post – chromatographic derivatization
6. Quantitation
7. Documentation
1. Plates
Precoated plates
The pre – coated plates with different support material (Glass, Aluminum and
plastic) and with different sorbent layers are available in the different format and
thickness by various manufacturers. Usually plates with sorbent thickness of 100 – 250
33
chemically modified layers Aluminum Sheet (0.1 mm thick): Aluminum sheet as a
support offer the same advantage as polyester support but with increased temperature
resistance. However with eluents containing high concentration of mineral acids or
concentrated ammonia, one may find problem as they will chemically attack aluminum.
Aluminum sheets are otherwise compatible with organic solvents and organic acids
such as formic acid and acetic acid. Aluminum Precoated plates in size of 20 x 20 cm
are usually procured for economic reasons. These plates can be cut to size and shape
(format) to suit particular analysis by using general purpose scissors.
2. Pre – washing of pre – coated plates
Sorbents with large surface area absorb not only water vapours and other
impurities from atmosphere but other volatile substances often condense particularly
after the packing has been opened and exposed to laboratory atmosphere for a long
time. Such impurities including elutable components of the binder usually give dirty
zones and fail to give reproducible results. It is only for these reasons that pre-coated
plates are always packed with the glass or foil side upward (coated layer downward).
To avoid any possible interference due to impurities with the chromatographic
separations particularly in case of quantitative work, it is always recommended to clear
the plates before actual chromatography. This process is called pre – washing of plates.
Excellent results are obtained if the plates are subjected to pre – washing (in cleaning
solvent) by continuous mode for some time in a chamber closed by a lid having a slit.
After washing, the plates must be dried for a sufficient time to ensure complete removal
of the washing liquids (usually for methanol 30 – 60 min at 105° c is required). The
washed plates should always be stored in a dust – free atmosphere under ambient
conditions. As a result of pre – washing, signal to noise ratio is substantially low and
34
densitometry. Plates exposed to high humidity or kept on a hand for long time may
have to be activated by placing in oven at 110 – 120° c for 30 minutes prior to sample
spotting. This step removes water that has been physically absorbed on the surface of
the sorbent.
3. Sample preparation and Application
The sample preparation procedure is to dissolve the dosage form with complete
recovery of intact compounds(s) of interest and minimum of matrix with a suitable
concentration of analyte(s) for direct application on the HPTLC plate. Sample
application is the most critical step for obtaining good resolution for quantification by
HPTLC. The sample should be completely transferred to the layer, however, under no
circumstances, the application process should damage the layer, as damaged layer
results in unevenly shaped spots. Wherever possible, use of automatic application
devices is recommended for quantitative analysis. Usually 0.5 – 5 l for HPTLC is recommended keeping the size of starting zone(s) down to minimum of 0.5 – 1 mm in
concentration range of 0.1 – 1 g/mL. substance zones which are too large from the beginning because poor separation as during development spots does tend to become
large and more diffused. It is therefore recommended that solution should be applied in
small increments with intermediate drying (use cold or hot air or nitrogen in case of
labile compounds, asymmetric accelerated evaporation of the solvent from the point of
application can lead to local changes in the concentration in spotted substances)
particularly when the sample solution is predominantly aqueous.
4. Development (separation)
Mobile phase
Poor grade of solvent used in preparing mobile phases have been found to
35
called solvent system is traditionally selected by controlled process of trial and error
and also based on one‟s own experience in the field. Use of mobile phase containing
more than three or four components should normally be avoided as it is often difficult to get reproducible ratios of different components. The chamber saturation has
pronounced influence on the separation profile. When the plate is introduced in to an unsaturated chamber, during the course of development, the solvent evaporates from the plate mainly at the solvent front. Therefore larger quantity of the solvents shall be
required for a given distance; hence resulting is increase in Rf values. If the tank is saturated ( by lining with filter paper) prior to development, solvent vapors soon get
uniformly distributed throughout the chamber as soon as the plate is placed in such a saturated chamber, it soon gets pre loaded with solvent vapors, hence less solvent shall be required to travel a particular distance, resulting in lower Rf values. Time required
for saturation will depend on the nature and composition of mobile phase and layer thickness.
Development in a non- saturated or partially saturated atmosphere is recommended with solvents used in a composition leading to phase separation such as mixture of n- butanol, water, glacial acetic acid. However in case of RPTLC, it is
always preferable to saturate the chamber with methanol as normally in RPTLC, mobile phase with high water contents are employed. If chromatographic procedure is
to be carried out at a controlled relative humidity of the chamber then suitable liquid is placed in one of the troughs of twin-trough chamber. Usually relative humidity of the room is controlled by dehumidifier. However, if experiments are required to be carried
at specific relative humidity, then solution of sulphuric acid or salt solutions may be employed. After development the plate is removed from the chamber and mobile phase
36
performed in fume cup board to avoid contamination of laboratory atmosphere. The plates should always be laid horizontally so that while mobile phase evaporates the
separated substances will migrate evenly to the surface where they can be easily detected.
Factors influencing separation of components and resolution of spots
Type of stationary phase – sorbent, particle size, activity
Type of plates
Layer thickness
pH of layer
Binder for layer
Melting point
Solvent purity
Size of chamber
Saturation of chamber
Solvent for sample phase
Melting point level in chamber Size of spot
Relative humidity
Temperature
Flow rate of solvent Separation distant
Mode of development
5. Detection and visualization
One of the most characteristic features of HPTLC is the possibility to utilize post chromatographic off-line derivatization. With the availability of many visualization reagents, findings can be confirmed. These visualization reactions are
37
development process is complete, the plate is removed from the chamber and dried to remove the mobile phase completely. The zones can be located by various physical,
chemical, biological- physiological methods. There is apparently no difficulty in detecting color substances or colorless substances absorbing in short wave UV-region
(254 nm) or with intrinsic fluorescence such as riboflavin. The substance which do not have above properties has to be transferred in to detectable substances by means of chromogenic or fluorogenic reagents which are more expensive, time - consuming and
complicated. Detection sensitivity depends on the specificity for the reagent employed. Iodine is the universal detection reagent, that detection is usually non-destructive and
reversible but certain substances may be altered through non-reversible derivatization such as ethambutol, a totally non UV absorbing compound forms a UV absorbing complex with iodine through charge transfer. Detection under UV light is the first
choice and is non-destructive in most of the cases and is commonly employed for densitometric scanning. Derivatization reactions are essentially required for detection
when individual compound does not respond to UV or does not have intrinsic fluorescence. It is not significant whether derivatization is pre or post chromatographic however, pre-chromatographic derivatization not only helps in detection but enhances
the selectivity of the mobile phase. For post chromatographic derivatization, smaller the chromatographic zone, greater the concentration of the substance leading to increase in
detection sensitivity. Other simple detection method is based on wetting and solubility phenomenon. Aluminium oxide, kieselguhr, silica gel or hydrophilic adsorbents. On dipping or spraying the chromatogram with water, lipophillic substances such as
steroids, fatty acids, hydrocarbons appear as white (opaque) spot against semi-transparent back ground as such a substances being invisible with water or not wetted.