ANALYTICAL METHOD DEVELOPMENT AND VALIDATION OF ASSAY AND DISSOLUTION FOR NISOLDIPINE ER TABLETS BY RP-HPLC
Dissertation work submitted to
The TamilNadu Dr. M.G.R. Medical University, Chennai in partial fulfillment for the award of degree of
MASTER OF PHARMACY IN
PHARMACEUTICAL ANALYSIS Submitted by
SURESHKUMAR.R Reg No. 26106428
Under the Guidance of
Institutional Guide Industrial Guide
MR.P.KUMARNALLASIVAN, M.Pharm, (Ph.D) MR.A.RAJASEKHARA REDDY, Assistant Professor, Chief Research scientist, Department of Pharmaceutical Analysis, Analytical R&D,
RVS College of Pharmaceutical Sciences, Orchid Healthcare, Sulur, Coimbatore. Irungattukottai, Chennai.
DEPARTMENT OF PHARMACEUTICAL ANALYSIS R V S COLLEGE OF PHARMACEUTICAL SCIENCES
SULUR, COIMBATORE – 641402 TAMILNADU.
CERTIFICATE
This is to certify that the dissertation work entitled “ANALYTICAL METHOD DEVELOPMENT AND VALIDATION OF ASSAY AND DISSOLUTION FOR
NISOLDIPINE ER TABLETS BY RP-HPLC” is a bonafide work of
Mr.SURESHKUMAR.R carried out in ORCHID HEALTHCARE,CHENNAI under my guidance and under the supervision of Dr.A.RAJASEKHARA REDDY and has completed to my fullest satisfaction for partial fulfillment of the award of degree of Master of Pharmacyin Pharmaceutical Analysis, R V S college of Pharmaceutical Sciences, Sulur, Coimbatore, which is affiliated to The Tamilnadu Dr.M.G.R Medical University, Chennai. It is to certify that the part or whole of the work has not been submitted either to this university or any other university. This work is original and confidential.
INSTITUTIONAL GUIDE
Mr.P.KUMAR NALLASIVAN, M.Pharm.,(Ph.D.) Assistant Professor,
Department of Pharmaceutical Analysis, R.V.S College of Pharmaceutical Sciences, Sulur, Coimbatore-641402.
CERTIFICATE
This is to certify that the dissertation work entitled “ANALYTICAL METHOD DEVELOPMENT AND VALIDATION OF ASSAY AND DISSOLUTION FOR NISOLDIPINE ER TABLETS BY RP-HPLC” is a bonafide research work done by Mr.SURESHKUMAR.R carried out in ORCHID HEALTHCARE, CHENNAI under the guidance of Mr.P.KUMAR NALLASIVAN. M.Pharm.,(Ph.D.),Assistant Professor, RVS College of pharmaceutical science, Sulur and Mr. A.RAJASEKHARA REDDY, chief Research Scientist, Analytical R&D, Orchid healthcare, for partial fulfillment of the requirement for the award of Master of Pharmacyin Pharmaceutical Analysis, R V S college of Pharmaceutical Sciences, Sulur, Coimbatore, which is affiliated to The Tamilnadu Dr.M.G.R Medical University, Chennai.
Dr.W.D.SAMSOLOMON, M.Pharm., Ph.D Professor and Head,
Department of Pharmaceutical Analysis, R.V.S College of Pharmaceutical Sciences, Sulur, Coimbatore-641402.
CERTIFICATE
This is to certify that the dissertation work entitled “ANALYTICAL METHOD DEVELOPMENT AND VALIDATION OF ASSAY AND DISSOLUTION FOR NISOLDIPINE ER TABLETS BY RP-HPLC” is a bonafide research work done by Mr.SURESHKUMAR.R carried out in ORCHID HEALTHCARE, CHENNAI under the guidance of Mr.P.KUMAR NALLASIVAN, M.Pharm.,(Ph.D.),Assistant Professor,RVS College of pharmaceutical science, Sulur and Mr. A.RAJASEKHARA REDDY, chief Research Scientist, Analytical R&D, Orchid healthcare, for partial fulfillment of the requirement for the award of Master of Pharmacyin Pharmaceutical Analysis, R V S college of Pharmaceutical Sciences, Sulur, Coimbatore, which is affiliated to The Tamilnadu Dr.M.G.R Medical University, Chennai.
Dr.R.VENKATA NARAYANAN, M.Pharm., Ph.D PRINCIPAL,
R.V.S College of Pharmaceutical Sciences, Sulur, Coimbatore-641402.
CERTIFICATE
This is to certify that the dissertation work entitled “ANALYTICAL METHOD DEVELOPMENT AND VALIDATION OF ASSAY AND DISSOLUTION FOR NISOLDIPINE ER TABLETS BY RP-HPLC” is a bonafide research work done in ORCHID HEALTHCARE, CHENNAI by Mr.SURESHKUMAR.R in partial fulfillment of the requirement for the award of Master of Pharmacy in Pharmaceutical Analysis, R V S college of Pharmaceutical Sciences, Sulur, Coimbatore,. under the supervision and guidance of Mr.P.KUMARNALLASIVAN. M.Pharm, (Ph.D.), Assistant Professor, Department of Pharmaceutical Analysis, RVS College of pharmaceutical science, Sulur and Mr. A.RAJASEKHARA REDDY, chief Research Scientist, Analytical R&D, Orchid healthcare.
INTERNAL EXAMINER EXTERNAL EXAMINER
Place: Place: Date: Date:
ACKNOWLEDGEMENT
It is a pleasure to thank those who made this dissertation work possible. Good number
of well wishers has helped me to complete this project successfully with profound appreciation.
I take this opportunity to proudly place on record my profound sense of gratitude to my
academic guide Mr. P.KUMAR NALLASIVAN, Asst. Professor, Department of Pharmaceutical Analysis, RVS College of Pharmaceutical Sciences, Sulur, and Coimbatore For his valuable
guidance, encouragement and continued support throughout the course of this work.
I am also fortunate enough to thank my industrial guide Mr. A.RAJASEKHARA REDDY,
chief Research Scientist, and Analytical R&D, Orchid healthcare, for his constant support and
valuable suggestions and stimulating criticism to complete this work.
I take pride in acknowledging the solicitous help and concern of our Principal Dr. R.
VENKATANARAYANAN M.Pharm., Ph.D, Principal RVS College of Pharmaceutical Sciences,
Sulur, Coimbatore, for allowing me to carry out my project work in Orchid Health Care, Chennai
(A DIVISION OF ORCHID CHEMICALS AND PHARMACEUTICALS LTD) for providing
encouragement and continued support through the course of work.
I express my special Thanks to Dr.W.D.Samsolomon. Professor and Head, Department
of Pharmaceutical analysis, Mr.R.Sivakumar Asst.Professor, Mr. P.R. Vijaianand Asst.Professor, who have been supportive of my career goals and who actively encouraged me with their
valuable insights from time to time.
Let me extend my gratefulness to Mr.V.Haribabu Asst.Manager, Mr.S.Varatharajan
Team Leader, Analytical R&D, Orchid healthcare for their valuable guidance and support.
It is my proud privilege to express my sincere thanks to Mr.R.Sivakumar who had helped me to get into industry for accomplishing my project work.
I am thankful to my fellow mates Mr.T.Manikandan, Mr.B.SambathKumar, Mr. Krishna
Teja, Mr.Venkateshwara Rao, Mr.P.Manoj Kumar, Mr.Sathya Narayana, Mr.Srinivasa Rajagopala
.
I am thankful to my friends Muthu, Dibin, Pullareddy, Rajeswari, Deepika, Parimaleshwari, Nisha for their criticism and support.
I thank all numerous acquaintances who have extended support and contribution to my
work. Last but not least I place my Thanks to My Dad, My Mom, and my Brother who have been
ever supportive, ever loving. Because of whom I am today.
.
Sureshkumar. R
ABBREVIATIONS ACN : Acetonitrile
g : gram
HPLC : High performance liquid chromatography pH : Hydrogen ion concentration
ICH : International conference on harmonization
mg : Milligram
ml : Milliliter
µg : Microgram
µg/ml : Microgram per milliliter µg : Microgram
nm : Nanometer
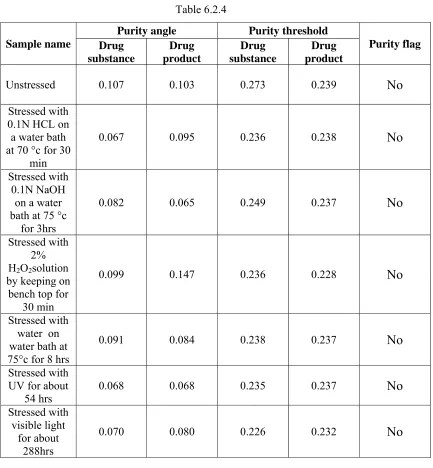
PA : Purity Angle
PDA : Photo diode array TH : Purity threshold
RSD : Relative standard deviation
k : Retention time
SD : Standard deviation UV : Ultra violet
V/v : Volume by Volume
CONTENTS
1 INTRODUCTION 1
2 LITERATURE REVIEW 29
3 DRUG PROFILE 33
4 OBJECTIVES AND PLAN OF WORK 37
5
EXPERIMENTAL PART
I) ANALYTICAL METHOD DEVELOPMENT AND VALIDATION OF ASSAY
II) ANALYTICAL METHOD VALIDATION OF ASSAY III) ANALYTICAL METHOD DEVELOPMENT OF
DISSOLUTION
IV) ANALYTICAL METHOD VALIDATION OF DISSOLUTION
42 48 55 59
6
RESULTS AND DISCUSSION
I) ANALYTICAL METHOD DEVELOPMENT OF ASSAY
II) ANALYTICAL METHOD VALIDATION OF ASSAY III) ANALYTICAL METHOD DEVELOPMENT OF
DISSOLUTION
IV) ANALYTICAL METHOD VALIDATION OF DISSOLUTION
64 70 85
94
7 CHROMATOGRAMS 108
8 SUMMARY AND CONCLUSION 135
INTRODUCTION
Page 1
1. GENERAL INTRODUCTION
Pharmaceutical Analysis plays a major role today, and it can be considered as an interdisciplinary subject. Pharmaceutical Analysis derives its principles from various branches like chemistry, physics, and microbiology etc., Pharmaceutical Analytical techniques are applied mainly in two areas, viz quantitative analysis and qualitative analysis, although there are several other applications.
Drugs and pharmaceuticals are chemicals or like substances, which are of organic, inorganic or other origin. Whatever may be the origin, we use some property of the medicinal agent to measure them quantitatively or qualitatively. Pharmaceutical Analytical techniques, which are being used, can be categorized as follows.
Spectral Methods1, 2
We use light absorption (or) emission characteristics of drugs.
E.g. UV spectroscopy, IR spectroscopy, NMR spectroscopy, ESR spectroscopy, mass spectrometry, flourimetry.
Chromatographic Methods
We use affinity or partition coefficient differences between drugs.
E.g. Thin Layer Chromatography, High Performance Liquid Chromatography, Gas chromatography, Paper Chromatography.
Electro Analytical Techniques
Based on the electrochemical property of drugs.
e.g., Potentiometer, Conductometry, Polarography, Amperometry, Paper Electrophoresis.
Radio Active Methods
It involves measurement of the intensity of the radiation from a naturally radioactive substance or an induced radioactive substance arising from exposure of the sample to a neutron source.
e.g., Radio Immuno Assay Physical Methods
We measure some physical characteristics of drugs
INTRODUCTION
Page 2
Titrimetric Methods
e.g. Non- aqueous titrations, redox titrations, diazotization titrations and complexometric titrations.
X-Ray Methods
When high speed electrons collide with a solid target, X-rays are produced. From the remittent x-ray emission, it is possible to identify certain emission peaks, which are characteristic of elements contained in the target. The wavelength of the peaks can be related to the atomic numbers of the elements producing them
In recent years, several analytical techniques have been evolved that combine two or more methods into one called “hyphenated” technique eg: GC/MS, LC/MS etc. The complete analysis of a substance consists of four main steps.
1. Sample preparation / Sampling
2. Dissolution of the sample, conversion of the analyte into a form suitable for measurement.
3. Measurement
4. Calculation and interpretation of the measurement Factors affecting the choice of analytical methods
Possible interference from components of the material other than those of interest.
¾ The concentration range, which needs to be investigated
¾ The accuracy required.
¾ The facilities available.
¾ The time required for complete analysis.
¾ Problem arising from the nature of the material
HIGH PERFORMANCE LIQUID CHROMATOGRAPHY
INTRODUCTION
Page 3
by the advent of High Performance liquid Chromatography (HPLC). In this system the pressure is applied to the column forcing the mobile phase through at much higher rate. The pressure is applied using pumping system. The action of the pump is critical, since it must not pulsate and mix up the sample being separated in the solvent, causing it to lose resolution. Development of pumps have proceeded quite quickly over the last several years, and now it is possible to achieve good separation under the condition required for HPLC. All of the factors affecting separation in liquid chromatography apply to HPLC. The factors affecting plate height, the sample distribution between the stationary and mobile phase and the selection of stationary and mobile phase still pertain even under the conditions of HPLC. The principal advantage of the system is the speed at which separations take place.
Principle of separation in HPLC 3, 4, 5
The principle of separation can be either adsorption or partition. Types of HPLC techniques
Based on modes of separation
1. Reversed phase chromatography 2. Normal phase chromatography Based on principle of separation
1. Adsorption chromatography 2. Partition chromatography 3. Ion exchange chromatography 4. Ion pair chromatography
5. Size exclusion or Gel permeation chromatography 6. Affinity chromatography
7. Chiral phase chromatography Based on elution technique
1. Isocratic Separation 2. Gradient Separation Based on the scale of operation
INTRODUCTION
Page 4
2. Preparative HPLC Based on the type of analysis
1. Qualitative Analysis 2. Quantitative Analysis Advantages of HPLC
¾ Efficient, highly selective and widely applicable
¾ Only small sample is required.
¾ Ordinarily nondestructive to sample.
¾ Readily adaptable to Quantitative analysis
¾ Simple and inexpensive equipment compared to GC.
¾ Can accommodate nonvolatile and thermally unstable samples.
¾ Generally applicable to inorganic ions. THEORY
Chromatography is an analytical method that finds wide application for the separation, identification and determination of chemical components in complex mixtures. This technique is based on the separation of components in a mixture (the solute) due to the difference in migration rates of the components through a stationary phase by a liquid mobile phase.
Following parameters are used in the chromatogram optimization – 1. Resolution
Reso Reso Anoth betwe The f found equat obtain quant A res peak Reso This N: To k’: C α: Th lution lution betw her goal is een two peak first equation d by drawin tion utilizes ned from tification rep solution valu height is con lution Equa equation exp
otal number apacity facto he relative se
een Chroma to accompli ks can be m n uses the wi ng tangents t the width of most chrom port.
ue of 1.5 be nsidered bas ation
plains what f
of theoretica or (retention eparation of t
atographic P ish this task
athematicall idth of the c through each
f the chroma matographic
etween two seline resolu
factors affec
al plates ava n factor), the the peaks; th
Peaks is the k in a minim ly quantified hromatograp h side of the atographic p
data syste
chromatogr ution.
ct the resolut
ailable; used peak retenti he selectivity
e primary c mum amount d with the eq phic peaks a e chromatog peak at half-h
ems as par
raphic peaks tion for column ion function y function INT
concern in a t of time. T quations app at their base. graphic peak height. This rt of an in
s of approxi
efficiency TRODUCTION Page any analysi The resolutio earing above This width i k. The secon value can b ntegration o
Reso Effici betwe comp Capa Also samp comp long V0.M phase colum k’ va k’ = k’ = k’ = statio Effic
lution Facto
iency, capac een two chro ponents play acity Factor known as ‘S ple molecule
ponent to the it takes the Molecules trav
e. A molecu mn volume w alue ranges fr
0 implies th 1 implies th 20 implies t onary phase. ciency Facto
ors
city, and sele omatographi y in determin
r
Separation fa on the colu e void time e centre of vel with the le with abso with the mob
rom 1-20. hat the comp hat compoun that compou
or
ectivity are t ic peaks. Th ning the reso
actor’.The c umn. It repre
of the colum peak A to mobile pha olutely no aff
bile phase so
ound is not r d is slightly und is highly
the three fac e equation a lution betwe
apacity facto esents the ra
mn. K’ = (V come off t ase unless th ffinity for the olvent front a
retained and retained by y retained an
ctors control above expres een the band
or is a measu atio of the el VA-V0)/V0Th the column hey are intera
e stationary and have a k
d elutes with the column. nd spends m
INT
that degree sses the role ds.
ure of the re lution time o his equation
relative to acting with t phase would k’ of 0
the solvent
much time int
TRODUCTION
Page of resolutio each of thes
tention of th of the sampl n tells us how
void volum the stationar d elute in on
It me retent Sharp system small Varia Calcu All th plates Colu Colum as the α =
easures the tion value of
per the peak m. In HPLC ler the peaks ables affectin ¾ Pu ¾ Ex ¾ M ulating Effi he following s: mn Selectiv mn selectivi e ratio of the (tm2 - tm) /
degree of f peak by pe
k, better the C column, th s overlap bet
ng efficiency ump flow rat xtra column Method of cal
iciency
g methods u
vity
ity, α, is a m e net retentio / (tm1 - tm)
sharpness o eak width.
N = e separation he larger the tween them. y are – te
volumes in lculations
use this form
measure of th on times of th
of a peak.
16 ( Vx/Wx n and highe e plate coun
the instrume
mula that m
he relative se he two peak
Efficiency
x)2
r the efficie nt, the sharp
ent used
measures N,
eparation of s.
INT
factor is de
ency of the per the peak
or number o
two peaks a
TRODUCTION
Page etermined b
column an s are and th
of theoretica
INTRODUCTION
Page 8
tm = retention time of void volume tm1 = retention time of peak1 tm2 = retention time of peak 2
Separation factor α can be calculated by dividing the two k1’s of two peaks. α value ranges from 1.0-2.0.
Components with α = 1.0 overlap completely and those with α > 2.0, can be separated by a separatory funnel. Larger α’s are needed in HPLC only in preparative runs.
Ranges of chromatography parameters
S.No PARAMETER RANGE
1
2
3
Capacity factor (k’ ) Analytical
Preparative
Efficiency factor (N)
Selectivity (or) Separation factor (α)
1-8 4-12
Hundreds (poor resolution) to 10’s of 1000’s (good resolution)
1-2. At α = 1, peaks overlap completely
INTRODUCTION
Page 9
SYSTEM COMPONENTS Solvent delivery system
The mobile phase is pumped under pressure from one or several reservoirs and flows through the column at a constant rate. With micro particulate packing, there is a high-pressure drop across a chromatography column. Eluting power of the mobile phase is determined by its overall polarity, the polarity of the stationary phase and the nature of the sample components. For normal phase separations eluting power increases with increasing polarity of the solvent but for reversed phase separations, eluting power decreases with increasing solvent polarity. Optimum separating conditions can be achieved by making use of mixture of two solvents.
The solvent delivery system has three basic functions:
¾ Provide accurate and constant flow through the flow channel.
¾ Provide accurate mobile phase compositions.
¾ Provide the force [pressure] necessary to push the mobile phase through the tightly packed column.
INTRODUCTION
Page 10
Damping units
The purpose of the damping unit is to reduce pressure pulsations caused by the action of the pump. A damping unit consists of a diaphragm separating the mobile phase from a compressible liquid.
Pump
The most important component of HPLC in solvent delivery system is the pump, because its performance directly effects the retention time, reproducibility and detector sensitivity.
SAMPLE INTRODUCTION SYSTEM
A sample introduction system is required to deliver the sample to the head of the HPLC column. The sample must be delivered without stopping or disturbing the mobile phase flow to the column. Sample injector must be very accurate and precise in its delivery. The sampler must also display low memory effects (carry-over).
INTRODUCTION
Page 11
Column
Many separations depend not only on the column material and mobile phases but also on the column Temperature. In such cases, column temperature stability is the dominating factor for the elution order. The heart of the system is the column. In order to achieve high efficiency of separation, the column material (micro-particles, 5-10 μm size) packed in such a way that highest numbers of theoretical plates are possible.
Durin (e.g. the su Detec The d samp imme elute using may used HPLC detec A sum Spect Mole ¾ ¾ ¾ ¾ Varia ng manufact trimethyl ch urface (end-c ctors detector for ple compoun ediately post
from the co g the coarse also be con
with HPLC C. The syste ction limits, e
mmary of va troscopic de ecular spect
¾ UV Detec
¾ Refractive
¾ Fluorome
¾ Atomic S
able Wavele
ture, such m hloro silane)
capping).
r an HPLC nd and subse terior to the olumn. The and fine tu ntrolled (in m C. There is n
em used is th expense etc arious detect etection me roscopic tec ctors
e Index Dete etric Detectio pectroscopic
ength UV D
materials may to reduce fu
is the comp quently sign e stationary
bandwidth a uning contro
most cases). no one high hus based on
tion methods thods chniques ectors on c Technique Detector
y be reacted urther the nu
ponent that nals a peak o
phase in ord and height o ols, and the There are hly sensitive n the require
s are as follo
s
Photodio
with a smal umber of sila
emits a resp on the chrom der to detec of the peaks
detection an many types , universal d ements whic
ows
ode Array D
INT
ll mono fun anol groups
ponse due t matogram. It
t the compo may usually nd sensitivit
of detector detector sys ch need to be
Detector
TRODUCTION
Page 1 ctional silan remaining o
to the elutin is positione ounds as the y be adjuste ty parameter rs that can b stem used fo e met such a
INTRODUCTION
Page 13
DISSOLUTION 6, 7, 8
Dissolution is a process in which a solid substance solubilizes in a given solvent that is mass transfer from the solid phase to the liquid phase. Pharmaceutical solid dosage forms and solid-liquid dispersed forms, on administration, under dissolution in biological media, followed by absorption of drug entity into systematic circulation. In determining the dissolution rate of drug from solid dosage forms, under standardized conditions, one has to consider several physicochemical processes in addition to the process involved in the dissolution of pure chemical substances.
The following factors that influence the dissolution characteristic of the drug.
¾ Physical characteristics of dosage form
¾ Wet ability of the dosage unit
¾ Penetration ability of the dissolution medium
¾ Swelling process
¾ Disintegration and disaggregation of the dosage form
Wagner proposed the scheme regarding the process involved in the dissolution of solid dosage forms is given as follows:
Tablet or capsule Granules or Aggregates Fine particles
Dissolution Dissolution
Drug in solution (In vitro or In vivo)
The Wagner scheme was later modified to incorporate other that precedes the dissolution process of the solid dosage forms. Cartesian proposed a scheme incorporating the following sequence.
1. Initial Mechanical Lag 2. Wetting of the dosage form
INTRODUCTION
Page 14
4. Disintegration
5. Disaggregation ion of the dosage form 6. Dissolution
7. Occlusion of some particles of the drug.
It is apparent from the Wager’s schematic representation that the rate of dissolution of the drug can become the rate-limiting step before the drug appears in blood. When the dosage form is placed into gastrointestinal tract in solid form, for the drug enters to the blood stream, there are two possible rate-limiting steps.
1. Freely purified water-soluble drugs will tend to dissolve rapidly, making the passive diffusion of the drug and or the active transport of the drug as the rate-limiting step for the drug to enter the blood stream.
2. Conversely, the rate of absorption of poorly soluble drug will be limited by the rate of dissolution of the drug or disintegration of dosage form.
Discriminative dissolution method
A method that is sensitive to change in formulation, raw material characteristics and critical manufacturing variable is said to be discriminative dissolution method.
In official or QC release method, the two products may shows same dissolution profile but when discriminative dissolution method is used, we can differentiate the formulation profile by release profile Once a discriminative dissolution method is developed, an in vitro-in vivo correlation can be established which could forecast the bioavailability of all the formulation developed during the product development. Factors like type of apparatus used, rpm, volume of dissolution media should be considered for the development of discriminative dissolution method. For study, we have selected rpm as one of the important factor for discriminative dissolution method.
The important parameters for the development of dissolution methods are 1. The pH dependent solubility
2. Stability Applications
INTRODUCTION
Page 15
It cans differentiate the change in formulation, which is due to variation in manufacturing process like granulation time, mixing time etc.
It predicts in-vivo behavior.
Once in vitro – in vivo correlation (IVIVC) is established, bioavailability study can be avoided, which can save the time and money in research work.
Theories of dissolution
Several theories to explain drug dissolution have been proposed. Some of the important ones are:
1. Diffusion layer model / Film theory
2. Danckwert’s model / Penetration or Surface renewal theory, and 3. Interfacial barrier model / Double barrier or Limited solvation theory. Classification of dissolution testing devices
1. USP Apparatus I (Basket Type) 2. USP Apparatus II (Paddle Type)
3. USP Apparatus III (Reciprocating Cylinder) 4. USP Apparatus IV (Flow-Through Cell)
5. USP Apparatus V (Paddle over disk) 6. USP Apparatus VI (Cylinder)
7. USP Apparatus VII (Reciprocating Holder) Dissolution medium
INTRODUCTION
Page 16
on the source of water and may change during the dissolution test itself, due to the influence of the active and inactive ingredients. For water insoluble or sparingly water soluble drug products, use of a surfactant such as sodium lauryl sulfate is recommended (Shah, 1995). The need for and the amount of surfactant should be justified. Use of a hydro alcoholic medium is discouraged.
Agitation
In general, mild agitation conditions should be maintained during dissolution testing to allow maximum discriminating power and to detect product with poor in vivo performance. Using the basket method, the common agitation (or stirring speed) is 50-100 rpm; with the paddle method, it is 50-75 rpm.
FACTORS AFFECTING DISSOLUTION EXTENT
Equation [1] describes factors controlling extent of dissolution. Maximum Dissolvable Dose = V × Cs / sink [1]
Where,
V = Dissolution medium volume
Cs = Saturated solubility of the compound in the medium Sink = Sink condition factor
To increase the maximum dissolvable dose, one needs to increase the dissolution media volume, change the media to increase the saturation solubility of the compound, or reduce the dissolution sink requirements.
Media volume
There are several ways to increase the dissolution media volume. Using 4- liter vessel is relatively uncommon, but they are available from vendors. This offers a potential 4-fold enhancement in maximum dissolvable dose over the standard 1-liter vessels.
Saturation solubility
The standard way to affect the saturation solubility of the drug in the dissolution media is to change the media, typically by adjusting the pH, adding a surfactant, or in rare cases, using non-aqueous solvents.
pH
INTRODUCTION
Page 17
Surfactants
Two factors to consider when evaluating surfactants are cost and concentration needed. If the dissolution assay is to be run in a Quality Control setting, choosing an inexpensive surfactant will be important to keep overall assay costs down. Examples of inexpensive surfactants are sodium dodecyl sulfate or SDS (also referred to as sodium lauryl sulfate or SLS) for an anionic surfactant, cetyltrimethylammonium bromide or CTAB for a cationic surfactant, and the polysorbates or Tweens for a non-ionic surfactant. To get any substantial solubility enhancement, the surfactant concentration must be at least above the critical micelle concentration or CMC. The CMC will depend upon, among other things, the surfactant itself and the ionic strength of the media. The amount of surfactant needed depends on the CMC and the degree to which the compound partitions into the surfactant micelles.
If the compound is ionizable, surfactants concentration and pH may be varied simultaneously, and the combined effect can substantially change the solubilization ability of the dissolution media
Non-aqueous solvents
The use of non-aqueous solvent for dissolution media is unconventional. However, if aqueous-based methods for achieving solubility have been exhausted, use of hydro-alcoholic media may be the best alternative. For example, the USP24-NF19 monograph for cortisone acetate tablets lists 30% isopropanol, 70% 0.01 N HCl as the dissolution media, and water/alcohol mixtures have been used as media for drug release testing of topical formulations using the Franz-diffusion cell apparatus.
Sink conditions
INTRODUCTION
Page 18
METHOD DEVELOPMENT 9, 10, 11
Every day many chromatographers face the need to develop a high –performance liquid chromatographic separation. Whereas individual approaches may exhibit considerable diversity, the method development often follows the series of steps summarized.
There exists today a good practical understanding of chromatographic separation and how it varies with the sample and with experimental conditions .Any systematic approach to HPLC method development should be based on the knowledge of the chromatographic process. In most cases a desired separation can be achieved easily with only a few experiments .In other cases, a considerable experimentation is needed. A good method development strategy should require as many experimental runs as are necessary to achieve the desired final result.
STEPS IN HPLC METHOD DEVELOPMENT 1. Information on sample, and separation goals 2. Need for special HPLC procedure
3. Choose detector and detector settings
4. Choose LC method; preliminary run; estimate the best separation conditions. 5. Optimize separation conditions.
6. Check for problems 7. Recover purified material
a. Quantitative calibration b. Qualitative method
INTRODUCTION
Page 19
WHATS IS KNOWN BEFORE STARTING NATURE OF THE SAMPLE
¾ Number of compounds present
¾ Chemical structure of compound
¾ Molecular weight of compound
¾ pKa values of compound
¾ UV spectra of compound
¾ Concentration range
¾ And sample solubility. Separation goals
Is the primary goal quantitative analysis, the detection of an substance, the characterization of unknown sample components (or) isolation of purified material.
Is it necessary to resolve all sample components SAMPLE PRETREATMENT AND DETECTION Sample comes in various forms
¾ Solutions ready for injection
¾ Solids that must first be dissolved or extracted
¾ Samples that require sample pretreatment to remove interferences and/or protect the column or equipment from damage.
¾ Solutions that require dilution, buffering, addition of internal standard or other volumetric manipulation.
Most samples for HPLC analysis require weighing and/ or volumetric dilution before injection.
INTRODUCTION
Page 20
recovery of analyte, involves a minimum number of steps, and be easily automated. Quantitative (99+ %) recovery of each analyte enhances sensitivity and assay precision. PRELIMINARY PROCESSING OF SOLID SAMPLES
Reducing sample particle size
It is desirable that solid samples be reduced in particle size since finely divided samples are
1. More homogenous , allowing more representative sampling with greater precision and accuracy and
2. Dissolve faster and are easier to extract because of their greater surface area. Methods for reducing sample particle size are blending, chopping, crushing, grinding, homogenizing, macerating, milling, mincing, pressing, pulverizing, sieving.
EXTRACTION
Extraction methods for solid samples
¾ Solid –liquid extraction
¾ Soxhlet extraction
¾ Forced-flow leaching
¾ Homogenization
¾ Sonication
¾ Dissolution
¾ Accelerated solvent extraction
¾ Automated soxhlet extraction
¾ Supercritical fluid extraction
¾ Microwave-assisted extraction
¾ Thermal extraction DRYING THE SAMPLE
Solid samples are often received for analysis in a damp or wet mass. Removal of water or drying the sample to constant weight is usually necessary for reliable assay.
INTRODUCTION
Page 21
FILTRATION
Particulates should be removed prior to injection because of their adverse effect on column life. The most common methods for removing of particulates from the sample are filtration, centrifugation, and sedimentation. A variety of membrane materials and different nominal porosities and dimensions are available for filtration. For most samples encountered in HPLC, filters in the range 0.25-2.0µm nominal porosities are recommended .Membranes with 0.25µm pores remove the smallest of particulates.
DETECTION
Before the first sample is injected during HPLC method development we must be reasonably sure that the detector selected will sence all sample components of interest. Variable wavelength ultraviolet detectors normally are the first choice, because of their convenience and applicability for most samples. For this reason, information on the UV spectra can be an important aid for method development.UV spectra can be found in the literature, estimated from the chemical structures of sample components of interest, measured directly or obtained during HPLC separation by means of a photo diode array (PDA) detector. When the UV response of the sample is inadequate, other detectors are available (fluorescence, electrochemical, etc,)
GETTING STARTED ON METHOD DEVELOPMENT
The only remaining decision before the first sample injection is the percent organic in the mobile phase (%B). One approach is to use an isocratic mobile phase of some average solvent strength ( eg.,50%B).A better alternative is to use a very strong mobile phase first (eg., 80 to 100% B) ,then reduce the % B as necessary. An alternative to initial isocratic separation is the use of gradient elution.
IMPROVING THE SEPARATION
INTRODUCTION
Page 22
SEPARATION GOALS IN HPLC METHOD DEVELOPMENT
Resolution – precise and rugged method quantitative analysis requires that Rs be greater than 1.5
Separation time- < 5 -10 min is desirable for routine procedures
Quantitation - ≤ 2% (1 SD) for assay, ≤ 5%for less-demanding analyses, ≤ 15% for trace analysis.
Pressure- < 150 bar is desirable, < 200 is usually essential (new column assumed) Peak height-narrow peaks are desirable for larger signal/noise ratios.
Solvent consumption- minimum mobile phase use per run is desirable
REPEATABLE SEPARATION
It is important to confirm that each chromatogram can be repeated, as the experimental runs described being carried out. When changing conditions (mobile phase, column, temperature) between method development experiments, enough time must elapse for the column to come in to equilibrium with the new mobile phase and temperature .Usually column equilibrium is achieved after passage of 10 to 20 column volumes of the mobile phase through the column. However, this should be confirmed by carrying out a repeat experiment under the same conditions. When constant retention times are observed in two such back-to–back experiments (±0.5% or better)Column equilibration can be extremely slow for certain reversed-phase HPLC conditions ; addition of basic modifiers or ion pair reagents to the mobile phase, the use of Tetrahydrofuran as solvent or the use of mobile phase without organic solvent.
COMPLETING THE HPLC METHOD
The final procedure should meet all the goals that were defined at the beginning of method development. The method should also be robust in routine operation and usable by all laboratories and personnel for which it is intended.
Completing the method
1. Preliminary data to show required method performance.
INTRODUCTION
Page 23
3. Systematic validation of method performance for more than one system or operator , using samples that cover the expected range in composition and analyte concentration; data obtained for day –to – day and interlaboratory operation. 4. Data obtained on expected life of column and column-to-column reproducibility. 5. Deviate results studied for possible correction of hidden problems.
6. All variables (temperature, mobile phase, composition, etc) studied for effect on separation; limits defined for these variables; remedies suggested for possible problems (poor resolution of key band pair, increased retention for last band with longer run times).
CHECKING FOR PROBLEMS
Low plate number – poor choice of column, secondary retentions, poor peak shape. Column variability- poor choice of column, secondary retentions effects.
Short column life- poor choice of column, need for sample pretreatment ,3> pH > 7. Retention drift –insufficient column equilibration, need for sample pretreatment, loss of bonded phase.
Poor quantitative precision- need for better calibration, identification of sources of error.
New interference peaks discovered- initial separation inadequate or initial samples not representative.
METHOD RUGGEDNESS
A rugged method is one that tolerates minor variations in experimental conditions, can be run easily by an average chromatographer, and does not require an identical HPLC system for its use. Rugged methods are essentially trouble free and transferable. Ruggedness can also be designed into a method by studying the effects of different variables on the separation.
METHOD VALIDATION13, 14
Then word validation simply means, “Assessment of validity” or action of proving effectiveness. “The objective of validation of an analytical procedure is to demonstrate that it is suitable for its intended purpose.”
INTRODUCTION
Page 24
Method Validation = Error assessment Significance of method validation
The quality of analytical data is a key factor in the success of a drug development programme. The process of method development and validation has a direct impact on the quality of these data.
¾ To trust the method.
¾ Regulatory requirement.
Method validation is required for the following reasons
¾ Assuring quality
¾ Achieving the acceptance of the product by International Agencies
¾ Mandatory requirement purpose for accreditation as per ISO 19025 guidelines.
¾ Mandatory requirement for registration of any pharmaceutical product or pesticide formulation
¾ Validated methods are only applicable for proficiency testing.
Analytical methods should be validated unless the method employed is included in the relevant pharmacopoeia or other recognized standard reference.
VALIDATION PARAMETERS SPECIFICITY
Specificity is the ability to asses unequivocally the analyte in the presence of components, which may be expected to be present.
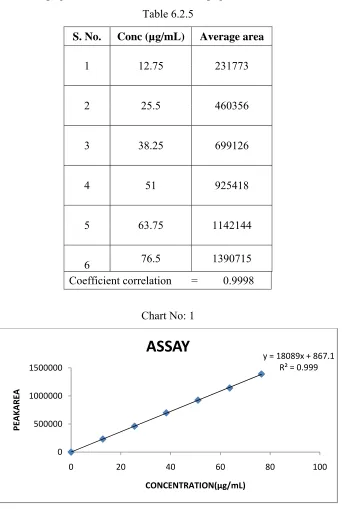
LINEARITY
The linearity of an analytical procedure is its ability (within a given range) to obtain test results, which are directly proportional to the concentration (amount) of analyte in the sample. In order to determine the quantity of any analyte present in unknown sample, some kind of relationship (mathematical/empirical) between concentration and response was essential. Response should be direct proportion to the concentration.
LIMIT OF DETECTION AND LIMIT OF QUANTIFICATION LOD
INTRODUCTION
Page 25
LOQ
Lowest amount of analyte in a sample, which can be quantitatively, determined with suitable precision and accuracy (LOQ). SD of response (σ) & Slope(S): Linearity curve was prepared with a series of working standard solutions at different concentrations (3 concentrations below 50% of specification level and 3 more concentration above 50% specification level were performed)
RSD CRITERIA
Series of working standard solutions of different concentrations below to specification level were prepared (generally about 10%, 20%, 30%, 40% and 50% of the specification concentration) and injected six replicate injections into HPLC. Precision should be established (if predicted from other than RSD criteria) at LOQ and LOD level as per ICH, USP& EP guidelines. The solution was prepared at predicted concentration (for LOQ/LOD) and injected six replicates as per methodology.
ACCURACY
The accuracy of an analytical procedure express closeness of agreement between the value, which is accepted either as a conventional true value or an accepted reference value and the value found.
Accuracy was usually determined in one of four ways:
¾ The procedure was applied to the known concentration of reference sample and the measured value to the true value was compared (defined by the organization, from which the sample received )
¾ The test results obtained were compared by the analytical procedure which was proved to be accurate with the results obtained from an existing alternate method that was known to be accurate
¾ Spiking concept, by spiking either analyte/impurities into sample matrix was the other
INTRODUCTION
Page 26
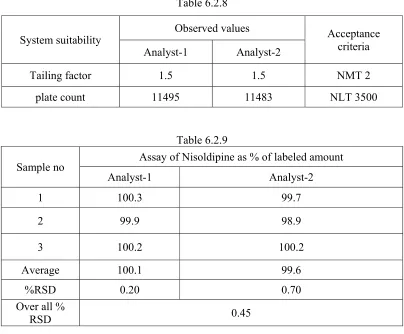
PRECISION
Precision is the measurement of how close the data values to each other for a number of measurements under the same analytical conditions. Precision may be considered at three levels according to ICH
¾ Repeatability
¾ Intermediate precision
¾ Reproducibility REPEATABILITY
Precision under same operative conditions (with- in a laboratory over a short period of time using the same analyst with the same equipment)
Measurement/ Injection repeatability (system precision). Method repeatability (Method precision)
INTERMEDIATE PRECISION (RUGGEDNESS)
Precision under different laboratory conditions (within-laboratory variation, as on different days, or with different analysts, or equipment’s within the same laboratory
REPRODUCIBILITY
Precision between laboratories/intermediate precision can be considered during the standardization of a procedure before it i.e. submitted to the pharmacopoeia.
RANGE
INTRODUCTION
Page 27
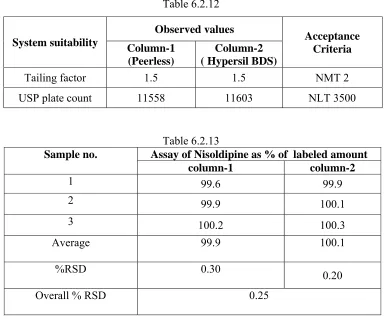
ROBUSTNESS
Measure of its capacity to remain unaffected by small, but deliberate variations in method parameters and provides indication of its reliability during its normal usage. Varying method parameters within a realistic range and the quantitative influence of the variables was determined, and, if the influence of the parameter was within a previously specified tolerance, then, the parameter was said to be within the method’s robustness range.
Typical variations included under Validation programme were
¾ Flow rate (0.1%)
¾ pH of the mobile phase(0.1 unit)
¾ Temperature (2ºC)
¾ % of Organic solvent (2%)
¾ Wavelength (2 nm) RUGGEDNESS
Method Ruggedness is defined as the reproducibility of results when the method is performed under actual use conditions. This includes different analysts, laboratories, columns, instruments, source of reagents, chemicals, solvents etc. Method ruggedness may not be known when a method is first developed, but insight is obtained during subsequent use of that method.
STABILITY
INTRODUCTION
Page 28
VALIDATION PARAMETERS FOR ASSAY AND DISSOLUTION
S. No VALIDATION PARAMETER ASSAY DISSOLUTION
1 System Suitability and
System Precision 9 9
2 Specificity 9 9
3 Precision 9 9
4 Accuracy 9 9
5 Linearity of Method 9 9
6 Ruggedness 9 9
7 Robustness 9 9
8 Filter Validation 9 9
9 Sink condition X 9
SINK CONDITION
LITERATURE REVIEW
29
2. LITERATURE REVIEW
1) Hairong Wang15 et al has been developed a sensitive and specific liquid chromatography– tandem mass spectrometric (LC–MS–MS) method to determine m-nisoldipine in rat plasma. Sample was pretreated by a single-step protein precipitation with acetonitrile, in contrast to the liquid–liquid procedure frequently used for the extraction of 1, 4-dihydropyridines from biologic samples. Separation of analyte and internal standard (I.S.) was performed on Symmetry RP-C18 analytic column (50mm×4.6 mm, 3.5_m) with a mobile phase consisting of acetonitrile–water (80:20, v/v) at a flow rate of 0.5 ml/min.The API 4000 triple quadrupole mass spectrometer was operated in multiple reaction monitoring (MRM) scan mode using TurboIonSpray ionization(ESI) source. This method was sensitive with a lower limit of quantification (LLOQ) of 0.2 ng/mL, with good linearity (r≥0.9982) over the linear range of 0.2–20 ng/mL
2) R Heinig have developed16 et al a method for Determination of the enantiomers of nisoldipine in human plasma using high-performance liquid chromatography on a chiral stationary phase and gas chromatography with mass selective detection .this method has described that combines chiral HPLC and off-line GC with mass-selective detection for the quantitation of the enantiomers of nisoldipine [(+)-I] in human plasma. An isotope-labeled internal standard [nine-fold deuterated (+)-I] is used throughout the assay. The limit of quantification is 0.1 pg/l for each enantiomer. Enantioselective analysis was performed in subjects receiving the racemic drug in tablet form. In healthy volunteers the maximum Concentration and the area under the curve of the pharmacologically more active (+)-enantiomer were greater by 9-fold and 13-fold, respectively, compared to those of the (-)-enantiomer. After intravenous administration of (+)-I there were no relevant differences between the plasma concentrations of the enantiomers.
LITERATURE REVIEW
30
perfusion with H2O2. Contractile function was protected in a concentration-dependent Manner (nisoldipine = 19, 26, 50, 63, and 78%; nifedipine = 23, 37, 55, 61, and 63% of pre-peroxide function, 0, 0.1, 0.5, 1.0, and 5 nM, respectively). There were no significant differences between equal concentrations of nisoldipine and nifedipine. Contractile function was equally protected by both (+) - and (-)-nisoldipine compared with vehicle-treated hearts (56, 67, and 16% of pre-peroxide function, respectively). Biochemical analyses indicated that H2O2, damaged plasma membranes (increased lactate dehydrogenase leak) and caused lipid per oxidation (elevated tissue thiobarbituric acid reactive substances). Biochemical changes were equally reduced by nisoldipine and nifedipine treatments and by (+) - and (-)-nisoldipine. The treatment groups have widely differing ICI, v, a lues as calcium channel antagonists, yet they had equal effects in reducing oxidative injury, suggesting that this beneficial effect is not mediated by calcium antagonism.
4) M Gilar 18 et al has studied Enantiomer separation of dihydropyridine calcium antagonists with Cyclodextrins as chiral selectors: structural correlation in high-performance liquid chromatography and capillary electro migration separations (HPCE and MEKC). Chromatographic data of five dihydropyridine calcium antagonists obtained on three/3-CD chiral stationary phases in reversed-phase mode. This data were compared with those of capillary Electrophoresis using /3-CDs in the presence and absence of sodium dodecyl sulfate (SDS). Competition of separated compounds with SDS molecules for penetration into the CD cavity can limit their necessary interaction with the chiral selector and consequently even preclude enantiomer separation.
LITERATURE REVIEW
31
6) D Zimmer20 et al have developed a sensitive, selective and validated method for the enantioselective determination of (+) - and (-)-nisoldipine in rat, mouse and dog plasma following administration of nisoldipine racemate by chiral microbore high-performance liquid chromatography Combined with gas chromatography-mass spectrometry. The enantiomers of nisoldipine were quantitatively separated by high-performance liquid chromatography on a 250 x 2 mm I.D. column containing tris (4_methylbenzoate) - modified cellulose on silica. The fractions containing either the (+) or (-)-enantiomer of the analyte and [13C4] ISTD were Analyzed by gas chromatography with mass-selective detection in the single-ion monitoring mode. The limits of determination and detection were 0.5 and 0.2 ng/ml, respectively, the total precision was 7% (R.S.D. at 5 and 50 ng/ml, n = 35) and the accuracy was 10% (0.5-100 ng/ml, n = 23). The sum of the concentrations of the enantiomers determined with this assay corresponds to the concentration of the racemate determined independently by capillary gas chromatography with Electron-capture detection (accuracy better than 15%, l-80 ng/ml).
7) A Alvarez-Lueje21 et al The study by dc and d.p.p. reveals the appearance of four signals depending on pH. In contrast, the anodic response corresponds to the oxidation of the 1, 4-dihydropyridine ring to generate the corresponding pyridine derivative. Both, cathodic (d.p.p.) and anodic signals (d.p.v.) were employed to develop analytical methodology for the determination of the drug. The repeatability of the measurements for both methods was adequate with R.S.D. of 1.4% (n_10) and 2.1% (n_10) for d.p.p. and d.p.v., respectively. Also recovery studies, 103.8% (R.S.D. 2.65%) by d.p.p. and 98.7% (R.S.D. 2.1%) by d.p.v. show that the accuracy and precision of the developed methods were adequate. The analytical methods were successfully applied to the determination of nisoldipine in both tablets and capsules. In addition, a preliminary study of the photo stability of nisoldipine (using both UV and artificial day light) was completed. The identity of the main electro active photo degradation products by GC with spectrometry detection is provided.
LITERATURE REVIEW
32
(120 nm:min scan speed; 2 nm slit width; Dl_10 nm and 5 s response time) for analogue derivative spectra were established for amplitudes 1D285 and 2D291(measured to the baseline) of the nitroso analogue assay, as well as for 1D386 of the parent compound–nisoldipine assay. Using the first-order derivative spectrum, the minimum detectable amount of nitroso analogue in the presence of nisoldipine was equivalent to an impurity level of 5% and by the second-order derivative spectrum; the determination limit was equivalent to an impurity level of 2%. The degradation of nisoldipine followed within 30 days and the calculated maximal degradation rate was1.6% per day for nisoldipine raw material, but significantly lower values of 0.19 and 0.15% per day were obtained for Nisoldin®tablets (10 and 5 mg, respectively)
9) Valentina D Marinkovic23 et al has studied photochemical degradation of solid-state nisoldipine, 1, 4-dihydropyridine calcium antagonist, under daylight and UV light conditions. Degradation products were identified by using the retention times of corresponding standards and quantified by high-performance liquid chromatographic method. HPLC experiments were carried out on a Hewlett Packard LC 1100 instrument, equipped with binary solvent pump G 131 2A and variable detector G 1314A. An octadecyl silane column (Lichrosorb RP-18, 5 mm, 250_/4 mm, Merck, Darmstadt, Germany) was used and methanol: water (60:40 v/v), pH 3.0 adjusted with phosphoric acid was used as mobile phase. Flow rate 1 ml/min and loop 20 ml were used. The samples were monitored at 238 nm. The daylight illumination induced appearance of nitrosophenylpyridine, while formation of second degradation product, nitrophenylpyridine, was observed only upon UV light illumination. The photo degradation kinetics of solid-state nisoldipine under daylight and UV light illumination belongs to class of zero-order reaction
D C C M M D N M S C DRUG NAM Chemical Na Chemical Str Molecular fo Molecular w Description Nature Melting poin olubility Category
ME : N ame : 3
Dim ructure: ormula weight nt 3. DR NISOLDIPI , 5-pyridined methyl-4-(2-: : : : : :
: A Vas C RUG PROF INE dicarboxylic -nitrophenyl
C20H24N2O6
388.4 yellow crys 1, 4-dihydro 143.22-152 freely solub Insoluble in Antihyperten sodilator Ag Calcium Cha FILE19,27
c acid, 1, 4-d l)-, methyl 2
6
stalline subst opyridine de
DRUG PROFILE
34
Substructures
• Dihydropyridines
• Carboxylic Acids and Derivatives
• Nitrobenzene’s
• Acetates
• Oxoazaniums
• Ethers
• Benzene and Derivatives
• Nitro compounds
• Enamines
• Heterocyclic compounds
• Aromatic compounds
• Anilines
Protein Binding : 99% T1/2 : 7-12 hours
Dose : 34 mg of Nisoldipine for once-a-day oral Administration
CLINICAL PHARMACOLOGY:
Mechanism of Action
DRUG PROFILE
35
Absorption and Distribution
Relatively well absorbed into the systemic circulation with 87% of the radio labeled drug recovered in urine and feces. The absolute bioavailability of Nisoldipine is about 5%. Metabolism
Pre-systemic metabolism in the gut wall, and this metabolism decreases from the proximal to the distal parts of the intestine. Nisoldipine is highly metabolized; 5 major urinary metabolites have been identified. The major biotransformation pathway appears to be the hydroxylation of the isobutyl ester. A hydroxylated derivative of the side chain, present in plasma at concentrations approximately equal to the parent compound, appears to be the only active metabolite and has about 10% of the activity of the parent compound. Cytochrome P450 enzymes are believed to play a major role in the metabolism of Nisoldipine. The particular isoenzyme system responsible for its metabolism has not been identified, but other Dihydropyridines are metabolized by Cytochrome P450 IIIA4
.Elimination
Although 60-80% of an oral dose undergoes urinary excretion, only traces of unchanged Nisoldipine are found in urine. 87% of the radio labeled drug is recovered in urine and feces. Nisoldipine is eliminated 60% to 80% in urine (traces unchanged), 5 urinary
metabolites and only 1 active
Pharmacodinamic
DRUG PROFILE
36
coronary and systemic arteries, increased oxygen delivery to the myocardial tissue, decreased total peripheral resistance, decreased systemic blood pressure, and decreased after load.
Elderly
Higher Nisoldipine plasma concentrations (C max and AUC) have been found in elderly.
Indications and Usage
Treatment of hypertension, alone or in combination with other antihypertensive agents.
Contraindications
Sensitivity to Dihydropyridines calcium channel blockers.
Dosage and Administration Adults
PO Initiate therapy with 17 mg once daily, then increase by 8.5 mg/wk, or with longer intervals, to attain adequate BP control (max, 34 mg/day).
Patients older than 65 yr of age, or patients with impaired liver function Initiate therapy with 8.5 mg once daily.
General Advice
• Have patient swallow tablets whole. Do not allow patient to crush, chew, or divide.
• Administer once daily 1 h before or 2 h after a meal. Do not administer with a high-fat meal. Avoid grapefruit products.
Storage/Stability
OBJECTIVE AND PLAN OF WORK
37
4. OBJECTIVE AND PLAN OF WORK 4.1 OBJECTIVE
Among the various drugs currently available for the treatment of systematic hypertension, the calcium channel antagonists (CCAs) continue to receive much attention as a result of their benefits in the prevention of cardiovascular events and other complications. Nisoldipine as a new dihydropyridinecalcium ion antagonist.
Nisoldipine is chemically described as 3-isobutyl-5-methyl-1, 4-dihydro-2, 6-dimethyl-(2-nitro phenyl)-pyridine-3, 5-dicarboxylate, is a calcium-channel-blocking 1, 4-dihydropyridine derivative, with no identical ester functions, which has been developed as an antihypertensive and antianginaldrug.
A Stability indicating methods is a quantitative analytical procedure used to detect a decrease in the amount of the active pharmaceutical ingredient (API) present due to degradation. According to FDA guidelines, a Stability indicating methods is defined as a validated analytical procedure that accurately and precisely measures active ingredients (drug substance or drug product) free from potential interferences like degradation products, process impurities, excipients, or other potential impurities, and the FDA recommends that all assay procedures for stability studies be stability indicating .During stability studies, liquid chromatography (LC) is used routinely to separate and quantitate the analyte of interest.
Stability indicating methods are quantitative test methods that can detect changes with time of drug substances and drug products. Information of type and amount of degradation products over time is important for safety of drugs. Therefore, FDA and other agencies but also good business practice requires such methods to be well designed and validated.
OBJECTIVE AND PLAN OF WORK
38
Method validation is an essential step in drug analysis. The process confirms that the analytical procedure employed for the analysis is suitable for its intended use and shows reliability of the results produced by any method.
The principal aspects of drug products that play an important role in shelf life determination of tablet formulation are assay and dissolution of active drug and degradants generated during the stability study. The assay of drug product in stability test sample needs to be determined using stability indicating method, as recommended by the International Conference on Harmonization (ICH) guidelines (ICH, 2000) and USP 29(United State Pharmacopoeia, 2005).
A thorough literature survey has revealed that only few analytical Methods that have been developed for its determination of Nisoldipine in human plasma has been Mainly determined using liquid or gas chromatography with mass spectrometry, following a Liquid–liquid extraction.And it has been analyzed for crystal structure Elucidation, and determination in formulations by voltametry, polarography.But there is no method has been developed for quantification for its formulation by High performance liquid chromatography. At the present time there is no dissolution test has been described in literature for this drug.
The main purpose of this investigation is to develop and validate simple, precise, sensitive and accurate stability indicating reversed phase high-performance liquid chromatographic method for assay and validate a sensitive RP-HPLC method to be applied to the in vitro dissolution studies.
OBJECTIVE AND PLAN OF WORK
39
4.2 PLAN OF WORK
4.2.1 ASSAY METHOD DEVELOPMEMT
An attempt was made in a stepwise manner to develop a simple, rapid, selective and sophisticated Assay method, by High performance liquid chromatography (Reverse phase) for the Nisoldipine.
The following stepwise protocol was followed.
• As a start up, literature survey was done and from the literature survey chemical profile like solubility, chemical structure, pKa value and analytical profile were obtained.
• From the data obtained, UV spectroscopic study was tried in the first place. • Later several trials were done in RP-HPLC using a different combination of
mobile phases and finally optimized.
• After optimization of the HPLC method, validation of the analytical method for the developed RP-HPLC method was done in accordance with the ICH guidelines.
• The plan of work is presented in the following scheme
Review of Literature
Establishment of detection wavelength
HPLC Trials with different combination of mobile phases and columns
Optimization of the HPLC method
Method validation for the above developed HPLC method as per ICH
OBJECTIVE AND PLAN OF WORK
40
4.2.2 DISSOLUTION METHOD DEVELOPMENT
An attempt was made in a stepwise manner to develop a simple, rapid, selective and sophisticated Analytical method &Dissolution method, by High performance liquid chromatography (Reverse phase) for the Nisoldipine
The following stepwise protocol was followed.
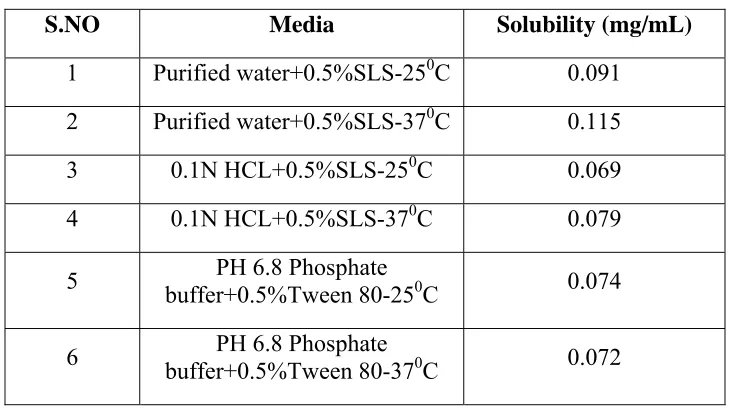
• Various trail was made to find out the solubility of drug in Water,0.1N HCL, PH 6.8 Phosphate Buffer , and finally selected the suitable medium
• Later several trials were done in RP-HPLC using a different combination of mobile phases and finally method was optimized.
• Various trails ware made to find out to fixing dissolution parameters like RPM, Apparatus, Dissolution volume.
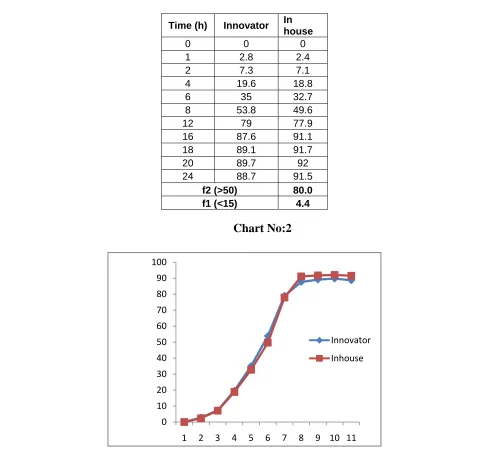
• Dissolution method has been optimized by using similarity factor.
OBJECTIVE AND PLAN OF WORK
41
• The plan of work is presented in the following scheme
Solubility studies with different medium like PH 1.2 HCL+0.5%SLS, PH 4.5+0.5%SLS, PH 6.8 PHOSPHATE
PUFFER+0.5%SLS
HPLC Trials with different combination of mobile phases and columns
Optimization of the HPLC method
Method validation for the above developed HPLC method as per ICH
industrial guidelines
Dissolution trails with different RPM
EXPERIMENTAL PART-ASSAY
42
5. EXPERIMENTAL PART ASSAY METHOD DEVELOPMENT
The need to save method development time and improve accuracy is forcing today’s analytical chemists to look for better, faster ways to develop stability indicating methods.
Starting with HPLC columns that offer excellent reproducibility, column lifetime and sensitivity this step by step protocol can save the method development chemists time and money required to establish new method. This approach is consistent with developing process.
STEPS IN ASSAY METHOD DEVELOPMENT 1. Selection of Detector Wavelength
2. Selection and Optimization of Mobile Phase ¾ pH of the buffer or pH of the Mobile Phase ¾ Optimization of Mobile Phase Composition 3. Selection of Column
4. Selection of Flow Rate
5. Selection of Column Temperature 6. Selection of Diluent
EXPERIMENTAL PART-ASSAY
43
5.1 ASSAY METHOD DEVELOPMENT DETECTION METHOD AND SELECTION OF WAVELENGTH
Known concentrations of Nisoldipine working standard was taken and dissolved in Methanol such that the standard solution contains about 51 ppm. Placebo & blank solutions also prepared. All these solutions were scanned between 200-400 nm using UV visible spectrophotometer.
OPTIMIZATION OF MOBILE PHASE MOBILE PHASE COMPOSITION Trail: 1
Preparation of mobile phase
Accurately measured a volume of 1000ml of Acetonitrile (100%).Filtered and degassed for 2 mins.
Diluent: pH 3 buffer: Methanol (50:50)
Chromatographic conditions
Column : Peerless Basic C18 100 × 4.6 mm, 1.8µ
EXPERIMENTAL PART-ASSAY
44
Trail: 2
Buffer Preparation:
Weighed and dissolved about 2.72 g of Potassium dihydrogen phosphate and 1.74 g of DiPotassium hydrogen phosphate in1000 mL of Milli Q water & mixed and sonicated for 10 minutes.
Preparation of mobile phase
Accurately measured a volume of 400ml of pH 6.8 Phosphate buffer and mixed with600ml of Acetonitrile (40:60) .filtered and degassed for 2 mins.
Diluent: pH 3 buffer: Methanol (50:50)
Chromatographic conditions
Column : Peerless Basic C18 100 × 4.6 mm, 1.8µ
Flow rate : 1.0ml/min Column oven temperature : 300c Injection volume : 20µl Runtime : 10 mins
Trail: 3
Buffer Preparation:
Weighed and dissolved about 2.72 g of Potassium dihydrogen phosphate and 1.74 g of DiPotassium hydrogen phosphate in1000 mL of Milli Q water & mixed and sonicated for 10 minutes.
Preparation of mobile phase
EXPERIMENTAL PART-ASSAY
45
Diluent: PH 3 buffer: Methanol (50:50)
Chromatographic conditions
Column : Peerless Basic C18 100 × 4.6 mm, 1.8µ
Flow rate : 1.0ml/min Column oven temperature : 300c Injection volume : 20µl Runtime : 10 mins
Trail: 4
Buffer Preparation:
Weighed and dissolved about 2.72 g of Potassium dihydrogen phosphate and 1.74 g of DiPotassium hydrogen phosphate in1000 mL of Milli Q water & mixed and sonicated for 10 minutes.
Preparation of mobile phase
Accurately measured a volume of 250ml of pH 6.8 Phosphate buffer, 500ml of Acetonitrile and 250 ml of Methanol (25:50:25).filtered and degassed the solution for 2 mins.
Diluent: PH 3 buffer: Methanol (50:50)
Chromatographic conditions
Column : Peerless Basic C18 100 × 4.6 mm, 1.8µ
EXPERIMENTAL PART-ASSAY
46
Trail: 5
Buffer Preparation:
Weighed and dissolved about 2.72 g of Potassium dihydrogen phosphate and 1.74 g of DiPotassium hydrogen phosphate in1000 mL of Milli Q water & mixed and sonicated for 10 minutes.
Preparation of mobile phase
Accurately measured a volume of 300ml of pH 6.8 Phosphate buffer, 400ml of Acetonitrile and 300 ml of Methanol (30:60:30).filtered and degassed the solution for 2 mins.
Diluent: PH 3 buffer: Methanol (50:50)
Chromatographic conditions
Column : Peerless Basic C18 100 × 4.6 mm, 1.8µ
Flow rate : 1.0ml/min Column oven temperature : 300c Injection volume : 20µl Runtime : 10 mins
EXPERIMENTAL PART-ASSAY
<