SHIM and Its Applications
Xi Yang
A thesis submitted for the degree of
Doctor of Philosophy
The Australian National University
Except where otherwise indicated, this thesis is my own original work.
Xi Yang
Acknowledgments
I am deeply indebted to my supervisors, Professors Steve Blackburn and Kathryn S. McKinley. They not only patiently supported me in addressing fundamental research problems. But more importantly, they showed me how to be a great teacher, a great parent, a great spouse, and a great humane person.
I am also greatly indebted to my hero, Huailin Chen, whose articles taught me the principles of computer systems and attracted me to the wonderful world of research and engineering.
Many people and organizations have provided generous support and assistance. I would like to thank Dan Luu and Martin Maas for promoting my research, and my managers, Michael Agnich, Charles Tripp, and Xin Xiang, for supporting me in finishing my thesis when I was working full time at TerrainData and Confluent. I also would like to thank my friends in our research lab, Yi, Kunshan, Tiejun, Ting, Ivan, Rifat, Vivek, and Luke, for their collaboration, support, and company. I would like to thank ANU and Google for providing scholarships, Microsoft Research for providing internships, and Centrelink for providing family benefits after my daughter was born Lastly, I would like to thank my family for their love and support. For my parents, Yangai and Qiudong, who gave me considerable freedom when I grew up and supported me in pursuing my research. For my daughter, Jayne, whose regular sleep schedule provided precious working hours. And, most of all, for my loving wife, my best friend, and also my life mentor, Liang, whose constant support and invaluable life suggestions encouraged me. Now it is my turn to support her in pursuing her remarkable research.
Abstract
Profiling is the most popular approach to diagnosing performance problems of com-puter systems. Profiling records run-time system behavior by monitoring software and hardware events either exhaustively or—because of high costs and strong ob-server effects—periodically. Sampling rates thus determine visibility: the higher the sample rates, the finer-grain behavior observable, and thus the better profilers can help developers analyze and address performance problems.
Unfortunately, the sample rates of current profilers are extremely low because of the perturbations generated by their sampling mechanisms. Consequently, current profilers cannot observe insightful fine-grain system behavior. Despite the giga-hertz speeds of modern processors, sampling frequencies have been at a standstill— between 1 KHz and 100 KHz—to limit perturbation. This million-cycle gap between two sequential samples blinds profilers to fine-grain behaviors, thus missing root causes of performance problems and potential solutions.
My thesis is that by exploiting existing underutilized multicore hardware the sample rates of profilers can be increased by orders of magnitude, lead-ing to new profillead-ing approaches, new discoveries of insightful behavior, and new optimizations.
The insights and contributions of this thesis are: 1) We view computer systems as high-frequency signal generators. The high-frequency hardware and software signals that reflect fine-grain system behavior are observable in signal channels: performance counters and shared memory locations. We introduce Shim, a new profiling ap-proach that continuously samples signal channels at resolutions as fine as 15 cycles, which is three to five orders of magnitude finer than current sampling approaches. Shim automatically filters out noisy samples to produce high-fidelity signals. 2) Shim’s high-frequency profiling enables a new approach to analyzing and controlling fine-grain system behaviors. We design Tailor, a real-time latency controller for latency-critical web services. Tailoruses a Shim-based high-frequency profiler and an application-level network proxy to continuously monitor and promptly act on the system behaviors that are hazardous to request latency. 3) Shim’s fine-grain control of system components enables a new class of online profile-guided optimizations. We introduce Elfen, a Shim-based job scheduler that borrows cycles in short idle periods of latency-critical workloads for batch workloads. Elfenimproves CPU uti-lization significantly without interfering with latency-critical requests by monitoring status changes of latency-critical requests with Shim, and taking real-time scheduling actions.
The history of science shows that an order of magnitude or more improvement in measurement fidelity leads to fundamental new discoveries. This thesis
x
Contents
Abstract ix
1 Introduction 1
1.1 Motivation . . . 1
1.2 Problem Statement . . . 4
1.3 Insights and Contributions . . . 4
1.4 Thesis Structure . . . 7
2 Background 9 2.1 Profiling . . . 9
2.1.1 Software and Hardware Events . . . 9
2.1.2 Profiling Approaches . . . 12
2.2 Profiling Techniques . . . 15
2.3 Problem Domain . . . 16
2.4 Summary . . . 17
3 SHIM 19 3.1 Introduction . . . 19
3.2 Motivation . . . 22
3.3 Design and Implementation . . . 25
3.4 Observation Fidelity . . . 28
3.4.1 Sampling Correction for Rate Metrics . . . 28
3.4.2 Randomizing Sample Periods . . . 31
3.4.3 Other Observer Effects . . . 31
3.5 Methodology . . . 31
3.6 Evaluation . . . 33
3.6.1 Observing Software Signals . . . 34
3.6.2 Software Signal Breakdown Analysis . . . 36
3.6.3 Observing Hardware Signals . . . 37
3.6.4 Correlating Hardware and Software Signals . . . 40
3.6.5 Negligible Overhead Fine-Grain Profiling . . . 40
3.7 Case Studies . . . 40
3.7.1 DVFS of Garbage Collection Phases . . . 41
3.7.2 Hardware Prefetching of Garbage Collection Phases . . . 42
3.8 Related Work . . . 47
3.9 Summary . . . 50
xii Contents
4 Tailor 51
4.1 Introduction . . . 51
4.2 TailorDesign and Implementation . . . 54
4.2.1 TaleChainEvents . . . 54
4.2.2 TailorProfiler and Proxy . . . 57
4.2.3 Local-Node Redundancy . . . 61
4.3 System Setup . . . 64
4.4 Hazardous System Behaviors and Optimizations . . . 65
4.5 Related Work . . . 70
4.6 Summary . . . 73
5 Elfen 75 5.1 Introduction . . . 75
5.2 Background and Motivation . . . 78
5.3 ElfenDesign and Implementation . . . 84
5.3.1 Nanonap . . . 85
5.3.2 Latency of Thread Control . . . 86
5.3.3 Continuous Monitoring and Signaling . . . 88
5.3.4 ElfenScheduling . . . 89
5.4 Methodology . . . 93
5.5 Evaluation . . . 94
5.6 Related Work . . . 100
5.7 Summary . . . 101
6 Conclusion 103 6.1 Future Work . . . 104
6.1.1 Distributed High-Frequency Profiling . . . 104
6.1.2 A Profiling Core . . . 104
6.1.3 System Signal Processing . . . 104
6.2 Final Words . . . 105
List of Figures
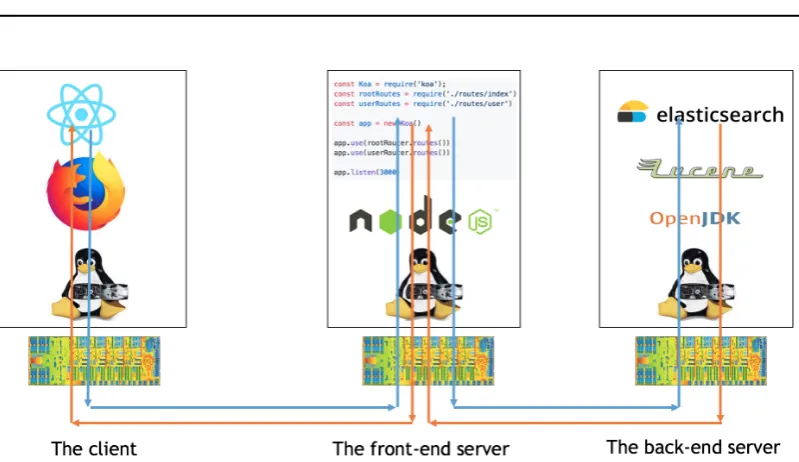
1.1 Leveraging rich abstractions makes it possible to craft a simple http
server in a few lines of JavaScript code. . . 2
1.2 IPC timeline for Lusearch. Sampling with 10 MHz exposes behavior unseen by existing profilers (red, blue). . . 3
1.3 A simple web request crosses layers of complex systems in a few mil-liseconds. . . 4
2.1 Computer systems generate software and hardware signals. . . 10
2.2 Locating signal channels of current-method-id events. . . 11
2.3 The Intel performance counter specification [Intel, 2019]. . . 11
2.4 Three sampling approaches: instrumentation, interrupt-driven sam-pling, and direct observation. . . 13
2.5 Shared hardware resources can be shared channels. . . 14
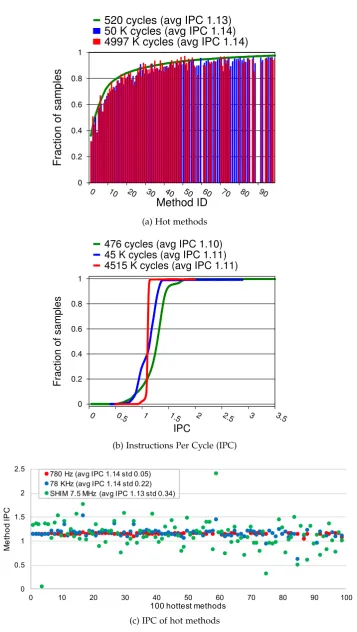
3.1 The impact of sample rate onlusearch. (a) Varying the sample rates identifies similar hot methods. The green curve is the cumulative frequency distribution of samples at high frequency. Medium (red) and low (blue) frequency sampling cumulative frequency histograms are permuted to align with the green. (b) Sample rate significantly affects measures such as IPC. (c) Sample rate significantly affects IPC of hot methods. Each bar shows average IPC for a given hot method at one of three sample rates. . . 23
3.2 Shimobserver loop. . . 27
3.3 Four clock readings ensure fidelity of rate measurements. Grey regions depict two measurements,tmmt n andtmmtn 1, in which Shimreads all coun-ters. The sample period is,Cs (red) toCe(blue). If the ratio of red and blue periods is one, then tmmt n =tmmtn 1 and Shim does not induce noise. DTE discards noisy measurements of rate metrics based on this ratio. . 28
3.4 DTE filtering on SMT keeps samples for which ground truth CPC is 1.±0.01, eliminating impossible IPC values. At small sample periods, DTE discards over half the samples. At sample periods >2000, DTE discards 10% or fewer samples. . . 30
3.5 Shimhas large variation in sample period and between samples with DTE filtering. The green curve shows variation in the period of good samples. The red curve shows variation in the period between consec-utive good samples. . . 32
xiv LIST OF FIGURES
3.6 Shim SMT observer effect on IPC for 476 cycle sample period with lusearch. The green curve showslusearch IPC, red shows Shim’s IPC, and blue shows IPC for the whole core. . . 32 3.7 Shim observing on SMT and CMP method and loop identifiers—a
highly mutating software signal . . . 35 3.8 Microbenchmarks explore software overheads. . . 37 3.9 CMP overheads. Write-invalidates induce observer effects and
heads. Increasing the producer or consumer periods drop the over-heads to<5%. . . 38 3.10 SMT overheads. SMT observer effects are highest as a function of
producer, but then relatively constant at ~10%. . . 38 3.11 Shimon SMT observing IPC as a function of sample rate. Overheads
range from 47% to 19%. . . 39 3.12 Shim on SMT correlating method and loop identifiers with IPC and
cache misses. . . 39 3.13 The overhead of Shim is essentially zero when observing IPC from a
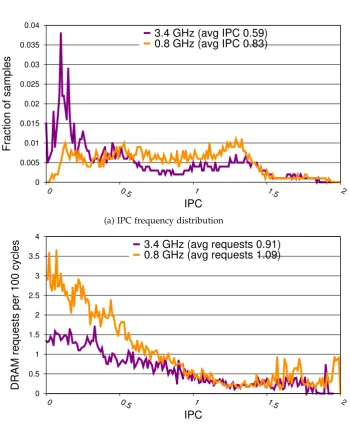
remote core. . . 39 3.14 DVFS effect at 3.4 and 0.8 GHz on IPC and memory bandwidth for
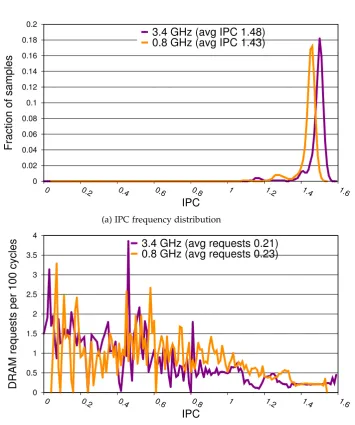
stacks (poor locality). . . 43 3.15 DVFS effect at 3.4 and 0.8 GHz on IPC and memory bandwidth for
globals (good locality). . . 44 3.16 Prefetching effect (on/off) on IPC and memory bandwidth for stacks
(poor locality). . . 45 3.17 Prefetching effect (on/off) on IPC and memory bandwidth for globals
(good locality). . . 46 3.18 DVFS effect on IPC for globals with prefetching off. . . 47 3.19 Strong correlation between IPC and memory bandwidth revealed in
time line series for stacks and globals. . . 48
4.1 The life of a latency-critical request. Notice that the client-observed latency (bottom) is very different to the server-observed latency (top). . 52 4.2 A timeline of TaleChainevents shows the behavior of requests. . . 56 4.3 Tailor instruments Linux to generate the kernel wakeup event into
the software channel. . . 57 4.4 Tailorcreates software channels for the operating system, the JVMs,
the proxy, and Lucene search servers. . . 58 4.5 The architecture of Tailor . . . 59 4.6 The Shim profiler continuously records new TaleChainevents from
software channels into the timeline stream and takes preprogrammed actions for certain events. . . 60 4.7 The proxy forwards requests and responses between clients and the
LIST OF FIGURES xv
4.8 Tailor presents a timeline view of a Lucene request. Each bar rep-resents one TaleChain event. The red bars mark the five stages of processing requests: the proxy receives the request, then the Lucene coordinator task receives the request, the Lucene worker starts to pro-cess the request, the Lucene worker finishes the request, and finally the proxy finishes the request. The blue arrows show the request flow of these five stages, while the green arrows show wake-up chains pointing from wakeup events to their corresponding schedule events. . . 63 4.9 The Shim profiler mitigates the impact of JVM pauses by sending
hedged requests after detecting hazardous events. . . 64 4.10 The tail latency of sending 1000 requests in 20 iterations at 1000 QPS. . 66 4.11 The operating system buffers the request response. Disabling the TCP
Nagle algorithm avoids the hazardous behavior. . . 68 4.12 Extremely long page faults after the deep sleep slow down requests.
Pre-touching the JVM heap avoids triggering the hazardous behavior, reducing the client-side tail latencies of iterations 3-8 under 3 ms con-sistently. Notice that other peaks caused by JVM pauses have not been addressed yet. . . 69 4.13 JVM pauses caused by class loading and garbage collection affect
re-quest latency. . . 71 4.14 Tailorreduces the maximum client-side tail latency by mitigating the
impact of JVM pauses with the local-node redundancy. . . 72
5.1 Highly variable demand is typical for latency-critical workloads. Lucene demand distribution with request processing time on x-axis in 1 ms buckets, fraction of total on left y-axis, and cumulative distribution red line on right y-axis. . . 79 5.2 Overloading causes non-linear increases in latency. Lucene percentile
latencies and utilization on one core. Highly variable demand induces queuing delay, which results in non-linear increases in latency. . . 80 5.3 Simultaneous Multithreading (SMT)A single thread often
underuti-lizes core resources. SMT dynamically shares the resources among threads. . . 81 5.4 Unfettered SMT sharing substantially degrades tail latency. Lucene
99th percentile latency and lane utilization with IPC 1 and IPC 0.01 batch workloads. . . 82 5.5 Lucene Inter-request idle times are highly variable and are
fre-quently short. Histogram (left y-axis) shows the distribution of request idle times. The line (right y-axis) shows the cumulative time between completing one request and arrival of the next request at 0.71 lane utilization on one core at RPS = 120. . . 83 5.6 Pseudo code fornanonap. . . 87 5.7 Microbenchmark that measures time to sleep withnanonap,mwait, and
xvi LIST OF FIGURES
5.8 Time to sleep and wake-up SMT partner lanes. . . 88 5.9 The pseudocode of four scheduling policies (the borrow idle policy
and the fixed budget policy). . . 90 5.9 The pseudocode of four scheduling policies (the refresh budget policy
and the dynamic refresh policy). . . 91 5.10 99th percentile latency (top) and utilization (bottom) for Lucene
co-running with DaCapo batch workloads. . . 95 5.11 99th percentile latency (top) and utilization (bottom) for Lucene
co-running with C microbenchmarks under four Elfenpolicies on a single two-way SMT core. . . 97 5.12 Normalized DaCapo benchmark execution time, user space CPU
List of Tables
4.1 TaleChainevents for the Lucene search workload. . . 55
Chapter 1
Introduction
In this dissertation, we focus ongeneral purpose sampling-based profilers that observe both software and hardware behavior by sampling hardware and software events on existing hardware platforms.
Specifically, we addresse the challenge of designing new frequency high-fidelity profilers on existing hardware platforms, discovering insightful fine-grain system behaviors with new profilers, and designing a new class of profile-guided optimizations.
1.1 Motivation
In computing,performanceis measured by the amount of useful work accomplished by computer systems in a fixed period, andfunctionalityis measured by what kinds of useful work computer systems can do. Since the first computer was invented, performance improvements have been driving the development of new functionality. Higher system performance enables engineers to explore new ways of designing and using computer systems, new solutions to challenging problems, and more produc-tive ways of crafting computer systems. For example, in the seventies, researchers at Xero PARC made astonishing innovations—the graphical user interface (GUI), Smalltalk, the What-You-See-Is-What-You-Get (WYSIWYG) editor, laser printing, and Ethernet—that together laid the foundations of modern personal computers. Alan Kay, the Smalltalk designer, attributed these innovations to the Xerox Alto, the highly optimized computer they were using, saying “It (Xerox Alto) was atime machine to allow individual researchers starting in 1973 to work about 12–15 years in the future they were trying to invent.” [Kay, 2019]. Today, fast, small and energy efficient SoC chips make it possible to build smart phones. Massive parallel computing power, pro-vided by GPUs and datacenters, is the heart of AI and machine learning. To advance the functionality of computer systems, we must keep optimizing performance.
Over decades, Moore’s law and Dennard scaling have been major forces pushing system performance forward: faster and smaller transistors gave us more powerful computer hardware every year. Today, as both of these forces are reaching their limits, to get better performance, engineers must optimize the full system stack, including the micro-architecture, operating systems, programing languages, core libraries, and
2 Introduction
Figure 1.1: Leveraging rich abstractions makes it possible to craft a simple http server in a few lines of JavaScript code.
applications.
Not only does the ending of Moore’s law and Dennard scaling force engineers to do full-stack optimizations, but so do the diverse performance requirements of modern computer systems. Today, in addition to latency and bandwidth, performance has many other facets: tail latency, utilization, scalability, energy efficiency, and availability. Many of these performance problems cannot be automatically solved with faster computers, but require engineers to understand root performance problems and design new optimizations.
However, discovering new optimizations is challenging. Just as with other ex-perimental sciences, it requires a scientific discovery process: observing computer systems, understanding system behavior, and designing new optimizations. None of these steps is easy when facing complex computer systems. Butler Lampson quoted Wheeler’s words in his Turing lecture, “Any problem in computer science can be solved with another level of indirection.” We have been crafting computer systems by leveraging and providing rich abstractions for decades. The result is a complex system stack. The layers of abstractions improve developer productivity significantly. As shown in Figure 1.1, a few lines of JavaScript can implement a simple HTTP server by invoking layers upon layers of libraries, but it also poses the challenge of finding performance problems and discovering optimizations because it is hard to understand system behavior. For example, Dick Sites from Google [Sites, 2015] mentioned that they spent three years on understanding the root causes of some mystery tail requests. After investigating disk traces and analyzing full system stacks across datacenters, they finally found that the root problem was from within the Linux kernel.
§1.1 Motivation 3
IPC
New sample rate at 10 MHz
IPCIPC
Current maximum sample rate at 100 KHz
Current default sample rate at 1 KHz
0 0.5 1 1.5 2 2.5
[image:21.595.122.506.120.402.2]0 0.5 1 1.5 2 2.5 0 0.5 1 1.5 2 2.5
Figure 1.2: IPC timeline for Lusearch. Sampling with 10 MHz exposes behavior unseen by existing profilers (red, blue).
invoke kernel system calls before optimizing hot paths. Latency-critical application developers, from virtual reality (VR) to web services, have to diagnose root causes of tail latency before designing new optimizations.
4 Introduction
Figure 1.3:A simple web request crosses layers of complex systems in a few milliseconds.
Figure 1.3 shows that in a few milliseconds, a web request passes through multi-ple system stacks across three machines. Current general-purpose profilers are not able to analyze fine-grain interactions between system components when requests travel through stacks. To observe fine-grain system behavior, engineers reluctantly switch to other inconvenient and high-overhead approaches, such as microbench-marks, simulation, direct measurement, tracing and exhaustively sampling. Because of such limitations, these alternative approaches cannot directly observe the behavior of online production systems.
1.2 Problem Statement
Understanding fine-grain system behavior is important for diagnosing performance problems and designing new optimizations. However, current general purpose profil-ers are not capable of observing the invaluable fine-grain system behaviors of online production systems, which slows down performance improvements.
1.3 Insights and Contributions
§1.3 Insights and Contributions 5
the impact of these hazardous behaviors. 3) Shim’s real-time fine-grain control of system components enables a new class of feedback-directed optimizations. Many latency-critical workloads have low CPU utilization because they must consistently deliver low responses in order to retain users. We introduce Elfen, a Shim-based job scheduler that borrows the cycles in the idle periods of latency-critical workloads for batch workloads. Elfen improves CPU utilization significantly without interfering with latency-critical requests by monitoring status changes of latency-critical requests with Shim, and taking real-time scheduling actions. We next describe each of these contributions in more detail.
Shim The sample rates of current general purpose profilers are limited by their inherently disruptive sampling approach: they fire an interrupt and sample events in the interrupt handler. The overheads of taking interrupts in the kernel and the possibility of overwhelming the kernel’s capacity to service interrupts place limits on their maximum resolution [Linux, 2014b].
Shimviews computer systems as high-frequency signal generators, and observes fine-grain system behavior by sampling generated hardware and software signals in a co-running observer thread at high frequencies on existing multicore hardware. A Shimobserver thread executes simultaneously with the application thread it observes, but on a separate hardware context, exploiting unutilized hardware on a different core or on the same core with simultaneous multithreading (SMT). Instead of us-ing interrupts or insertus-ing instrumentation, which substantially perturb applications, Shimefficiently samples hardware and software signals by simply reading hardware counters and memory locations. Shimimproves its accuracy by automatically detect-ing and discarddetect-ing samples affected by measurement skew which it or other system parts introduce. We measure Shim’s observer effects and show how to analyze them. When on a separate core, Shimcan continuously observe one software signal with a 2% overhead at a ~1200 cycle resolution. At an overhead of 61%, Shim samples one software signal on the same core with SMT at a ~15 cycle resolution. We vary prefetching and DVFS policies in case studies that show the diagnostic power of fine-grain IPC and memory bandwidth results. By repurposing existing hardware, we deliver a practical tool for fine-grain performance microscopy for developers and architects.
Tailor Faced with complex computer systems, it is a challenge for latency-critical web services to consistently deliver low responses, because complex system compo-nents can unexpectedly delay latency-critical requests by orders of magnitude larger than their target latency. Shim’s high-frequency profiling enables a new approach to identifying and addressing these hazardous system behaviors in real time.
6 Introduction
application-level network proxy. The profiler continuously records request-related events from system components that show how the system stack processes latency-critical requests into a timeline stream. It also detects and takes real-time control actions on hazardous behaviors. The proxy forwards requests and responses for the active and backup servers. Whenever it detects a slow request, it searches and ana-lyzes that request’s related events from the timeline stream, then presents a timeline to developers showing how system behaviors affect the slow request. We evaluate Tai
-lorwith a latency-criticalLuceneworkload whose client-side tail latency is 16 times larger than the maximum server time. We show that Tailor identifies hazardous sys-tem behaviors that are from the operating syssys-tem and the JVM. By adjusting syssys-tem configurations to avoid the hazardous behaviors induced by the operating system and mitigating the impact of unavoidable JVM pauses with local-node redundancy, Tailorreduces tail latency nine-fold, from 46 ms to 5 ms.
Elfen Not only does profiling critical workloads with Shimshow promising opti-mization opportunities, but Shim’s real-time fine-grain control of system components can help us implement a new class of real-time feedback-directed optimizations. For instance, profilingLucene, a popular open-source search engine, shows that interac-tive web services have short idle periods and poor temporal locality between requests. This profiling result presents a promising optimization opportunity: we can improve datacenter utilization significantly without interfering with latency-critical requests if we can fill many short idle periods with batch jobs. However, the challenge of im-plementing the optimization is how we can accurately control batch jobs so that they enter and leave the short idle periods in real time. Shim’s high-frequency profiling and fine-grain control make it possible to detect short idle periods and take real time scheduling actions.
§1.4 Thesis Structure 7
1.4 Thesis Structure
Designing optimizations is an experimental science. It follows three steps: observing computer systems, developing insights, and designing new optimizations. The body of this thesis is structured around this optimization discovery process.
Chapter 2 gives background and an overview of profilers. Chapter 3 explains Shim, a new high-frequency sampling approach that can observe fine-grain system behavior. Chapter 4 describes Tailor, a Shim-based real-time latency controller that can analyze and control the fine-grain interactions of complex system components. Chapter 5 discusses Elfen, a Shim-based job scheduler that controls fine-grain inter-actions between latency-critical requests and batch jobs.
Chapter 2
Background
Profilers help engineers observe the run-time behavior of systems, understand perfor-mance problems, and design new optimizations. They record time-varying software and hardware events, analyze these signals, and present profiling results. This chapter gives an overview of profilers, structured as follows: Section 2.1 explains how profil-ing works; Section 2.2 introduces the development of profilprofil-ing techniques; Section 2.3 discusses the problem domain addressed by this thesis.
2.1 Profiling
Profilers observe the behavior of systems by recording and analyzing time-varying software and hardware events. This section first explains what and where these events are, then introduces how profilers read and analyze the events.
2.1.1 Software and Hardware Events
Computer systems continuously change software and hardware states. For example, when executing the code in Figure 2.1(a), the software states of variables iandsum, stored either in registers or memory, are updated at every loop iteration; hardware states, such as the number of retired instructions, are updated at every CPU cycle. If we view computer systems as signal generators, and places holding software and hardware states as signal channels, whenever computer systems (signal generators) mutate states, they generate events in signal channels. These time-varying software events and hardware events are signals of system behavior, as shown in Figure 2.1(b) and Figure 2.1(c). Thus, profilers are able to observe and analyze system behavior by reading events from signal channels and analyzing sampled signals.
Software channels are storage locations holding the software state and interfaces for accessing the state, such as registers, memory locations, files and APIs. Some software channels are explicit about where and how to sample them. For example, Linux maintains each process’s status and exports it via the/proc/[pid]/statvirtual file. But there are many program-specific software channels whose location is not explicitly exported, such as storage locations of variables i and sum, the loop and method identifiers in Figure 2.1(b). To sample program-specific channels, profilers
10 Background
1 for (int i=0; i<10; i++) 2 sum += i;
(a) A simple loop
[image:28.595.78.478.107.315.2](b) Two Software signals (c) A hardware signal
Figure 2.1:Computer systems generate software and hardware signals.
need to locate them first. Figure 2.2 shows the process of locating channels of the current-running-method event in a Java virtual machine on Linux. Profilers look up running Java threads from channels of currently running tasks, then search for their current frame pointer from channels of current frames, finally they read the method IDs from channels in the stack.
Hardware channels are places holding hardware states. On modern processors, the main software-accessible channels are performance counters and hardware profil-ing buffers. Modern processors provide a few configurable performance counters for each hardware thread (hardware context) to count architectural events. Each counter has a control register with which software chooses the event to be monitored from a rich set of architectural events such as the number of retired instructions, L1 data/in-struction cache misses, and memory references. The control register also has flags to control whether to generate an interrupt on counter overflow, to select hardware domains (counting events from the current hardware thread or from the whole core), and other conditions. Once a counter is started, the processor will increase its value for matched events.
Figure 2.3 shows an Intel performance counter and its control register. On modern Intel processors, software chooses one event to count from hundreds of architectural events, and reads the counter value with theRDMSRinstruction. In addition to coun-ters, modern processors also provide hardware profiling buffers. For example, Intel PEBS [Intel, 2019] and AMD IBS [AMD, 2019] store sampled instructions and associ-ated architectural performance states such as memory-reference latency in profiling buffers. Intel Processor Trace (Intel PT) [Strong, 2014] records full traces of instruc-tions to trace buffers.
§2.1 Profiling 11 Kernel User CPU Task 1 3224 … … Task Stack 3224 0xff.. … … method ID … … … method ID … … … The current frame
Java
Figure 2.2:Locating signal channels of current-method-id events.
Vol. 3B 18-115 PERFORMANCE MONITORING
•
IBUSQ Latency event — This event accumulates weighted cycle counts for latency measurement oftransac-tions in the iBUSQ unit. The count is enabled by setting MSR_IFSB_CTRL6[bit 26] to 1; the count freezes after software sets MSR_IFSB_CTRL6[bit 26] to 0. MSR_IFSB_CNTR7 acts as a 64-bit event counter for this event. See Figure 18-55.
18.6.7 Performance Monitoring on L3 and Caching Bus Controller Sub-Systems
The Intel Xeon processor 7400 series and Dual-Core Intel Xeon processor 7100 series employ a distinct L3/caching bus controller sub-system. These sub-system have a unique set of performance monitoring capability and programming interfaces that are largely common between these two processor families.
Intel Xeon processor 7400 series are based on 45 nm enhanced Intel Core microarchitecture. The CPUID signature is indicated by DisplayFamily_DisplayModel value of 06_1DH (see CPUID instruction in Chapter 3, “Instruction Set Reference, A-L” in the Intel® 64 and IA-32 Architectures Software Developer’s Manual, Volume 2A). Intel Xeon processor 7400 series have six processor cores that share an L3 cache.
Dual-Core Intel Xeon processor 7100 series are based on Intel NetBurst microarchitecture, have a CPUID signature of family [0FH], model [06H] and a unified L3 cache shared between two cores. Each core in an Intel Xeon processor 7100 series supports Intel Hyper-Threading Technology, providing two logical processors per core. Both Intel Xeon processor 7400 series and Intel Xeon processor 7100 series support multi-processor configurations using system bus interfaces. In Intel Xeon processor 7400 series, the L3/caching bus controller sub-system provides three Simple Direct Interface (SDI) to service transactions originated the XQ-replacement SDI logic in each dual-core modules. In Intel Xeon processor 7100 series, the IOQ logic in each processor core is replaced with a Simple Direct Interface (SDI) logic. The L3 cache is connected between the system bus and the SDI through
[image:29.595.136.507.430.665.2]Figure 18-54. MSR_EFSB_DRDYx, Addresses: 107D0H and 107D1H
Figure 18-55. MSR_IFSB_CTL6, Address: 107D2H; MSR_IFSB_CNTR7, Address: 107D3H Other
49 38
50 37 36 3433
Saturate
Own Reserved
63 6059585756 55 48 39 35 32
31 0
32 bit event count MSR_EFSB_DRDYx, Addresses: 107D0H and 107D1H
Reserved MSR_IFSB_CTL6 Address: 107D2H
MSR_IFSB_CNTR7 Address: 107D3H Enable
63 59 57 0
63 0
64 bit event count
(a) The counter register.
18-4 Vol. 3B
PERFORMANCE MONITORING
See Figure 18-1 for the bit field layout of IA32_PERFEVTSELx MSRs. The bit fields are:
• Event select field (bits 0 through 7) — Selects the event logic unit used to detect microarchitectural conditions (see Table 18-1, for a list of architectural events and their 8-bit codes). The set of values for this field is defined architecturally; each value corresponds to an event logic unit for use with an architectural
performance event. The number of architectural events is queried using CPUID.0AH:EAX. A processor may support only a subset of pre-defined values.
• Unit mask (UMASK) field (bits 8 through 15) — These bits qualify the condition that the selected event logic unit detects. Valid UMASK values for each event logic unit are specific to the unit. For each architectural performance event, its corresponding UMASK value defines a specific microarchitectural condition.
A pre-defined microarchitectural condition associated with an architectural event may not be applicable to a given processor. The processor then reports only a subset of pre-defined architectural events. Pre-defined architectural events are listed in Table 18-1; support for pre-defined architectural events is enumerated using CPUID.0AH:EBX. Architectural performance events available in the initial implementation are listed in Table 19-1.
• USR (user mode) flag (bit 16) — Specifies that the selected microarchitectural condition is counted when the logical processor is operating at privilege levels 1, 2 or 3. This flag can be used with the OS flag. • OS (operating system mode) flag (bit 17) — Specifies that the selected microarchitectural condition is
counted when the logical processor is operating at privilege level 0. This flag can be used with the USR flag. • E (edge detect) flag (bit 18) — Enables (when set) edge detection of the selected microarchitectural
condition. The logical processor counts the number of deasserted to asserted transitions for any condition that can be expressed by the other fields. The mechanism does not permit back-to-back assertions to be distin-guished.
This mechanism allows software to measure not only the fraction of time spent in a particular state, but also the average length of time spent in such a state (for example, the time spent waiting for an interrupt to be serviced).
• PC (pin control) flag (bit 19) — When set, the logical processor toggles the PMi pins and increments the counter when performance-monitoring events occur; when clear, the processor toggles the PMi pins when the counter overflows. The toggling of a pin is defined as assertion of the pin for a single bus clock followed by deassertion.
• INT (APIC interrupt enable) flag (bit 20) — When set, the logical processor generates an exception through its local APIC on counter overflow.
• EN (Enable Counters) Flag (bit 22) — When set, performance counting is enabled in the corresponding performance-monitoring counter; when clear, the corresponding counter is disabled. The event logic unit for a UMASK must be disabled by setting IA32_PERFEVTSELx[bit 22] = 0, before writing to IA32_PMCx.
• INV (invert) flag (bit 23) — When set, inverts the counter-mask (CMASK) comparison, so that both greater than or equal to and less than comparisons can be made (0: greater than or equal; 1: less than). Note if counter-mask is programmed to zero, INV flag is ignored.
Figure 18-1. Layout of IA32_PERFEVTSELx MSRs
31
INV—Invert counter mask EN—Enable counters INT—APIC interrupt enable PC—Pin control
8 7 0
Event Select
E—Edge detect
OS—Operating system mode USR—User Mode
Counter Mask E E N
I N T
1918171615 20 21 22 23 24 Reserved I N V P C U S R O
S Unit Mask (UMASK) (CMASK)
63
(b) The control register.
12 Background
buffers. Libpfm provides library interfaces to translate human-readable event names to hardware configurations.
2.1.2 Profiling Approaches
The quality of recorded signals determines the level of detail profilers can observe and analyze. Current profilers mainly use two approaches to record system signals: 1) Instrumentation: profilers instrument target programs with code that reads and analyzes hardware and software events. This approach is good at locating program-specific software channels and recording full traces of target events, and thus is adopted by many software profilers. 2) Interrupt-driven sampling: profilers send interrupts and execute code that reads and analyzes events in the interrupt handler. Because this approach can continuously sample the whole system at low frequencies but with low overhead and correlate sampled coarse-grain signals, it is the default profiling approach of current continuous system profilers.
Modern computer systems generate high-frequency signals. However, because both of the above obtrusive approaches are not capable of recording high-frequency signals, current profilers are not able to observe and analyze fine-grain system behav-ior. This thesis introduces direct observation, a new non-obtrusive high-frequency sampling approach that continuously polls remotely observable events of target con-texts in a separate hardware context. This new approach enables Shim, Tailor, and Elfento observe, analyze, and control the fine-grain behavior of production systems.
Instrumentation Instrumentation code is added to programs to record hardware and software events at run time. The code can be added at any stage: engineers directly implement the code in the source code; compilers insert the code either in offline ahead-of-time (AOT) compilation or online just-in-time (JIT) compilation; binary modification tools insert the code to the final binary executable files.
Figure 2.4(a) shows an example of how the instrumentation approach collects the call graph—important profiling statistics showing frequencies of invoking meth-ods. The instrumentation code, inserted to the function prologue, reads the current method ID and its caller method ID from signal channels in the stack and updates the corresponding entry in the call graph.
The insertion of instrumentation code is normally done by tools that understand target programs, thus this approach is good at locating program-specific channels. As shown in the above example, since the compiler controls the stack layout, the instrumentation code inserted by the compiler knows where to read the caller and callee IDs. The instrumentation code is always invoked by the modified code, so it is capable of recording full traces of modified-code-related events. However, the instrumentation code is also only invoked by the modified code, which is likely to produce biased samples due to poor sample-space coverage.
§2.1 Profiling 13
func bar {
….
….
}
instrument code
caller callee freq foo bar 124
…
…
time caller ID … … … callee ID … … …(a) The instrumentation code reads the caller and the callee (software events) from the stack (signal channel) to compute the call graph.
Problem: Samples Are Not Atomic
5
time
Counters: C – cycles, R - retired instructions
0.1-1 ms (1-100 KHz)
R
1C
1 The interrupt handler:C – cycles, R – retired instructions IPC = (Rt– Rt-1) / (Ct– Ct-1)
cycles = (Ct– Ct-1)
id = current_method(stack) associate(id, IPC, cycles)
✓
0 0.51 1.52 2.5
(b) The interrupt handler samples and correlates IPCs, current method-ids, and cycles.
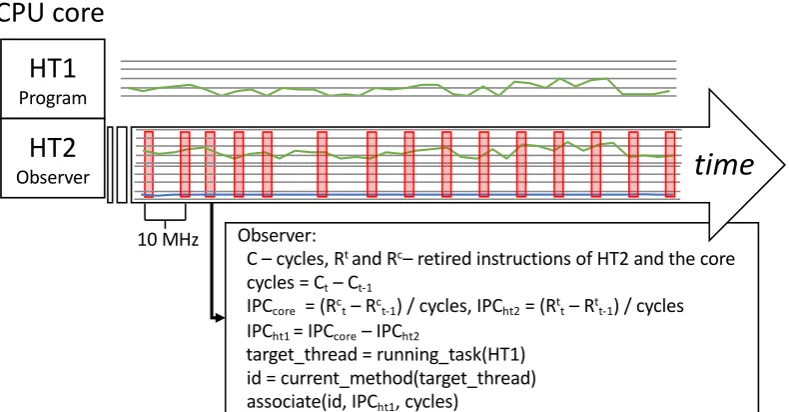
Observer:
C – cycles, Rtand Rc– retired instructions of HT2 and the core cycles = Ct– Ct-1
IPCcore = (Rc
t– Rct-1) / cycles, IPCht2= (Rtt– Rtt-1) / cycles IPCht1 = IPCcore– IPCht2
target_thread = running_task(HT1) id = current_method(target_thread) associate(id, IPCht1, cycles)
Problem: Samples Are Not Atomic
6
Counters: C – cycles, R - retired instructions
R
1
C
1
The interrupt handler:
C – cycles, R – retired instructions IPC = (Rt– Rt-1) / (
cycles = (Ct– C id = current_method associate(id, IPC,
✓
HT1
ProgramHT2
ObserverCPU core
time
10 MHztime
[image:31.595.123.518.486.692.2](c) The observer samples and correlates the target hardware thread’s IPCs, method IDs, and cycles.
14 Background
shared cache
H
T
H
T
shared memory
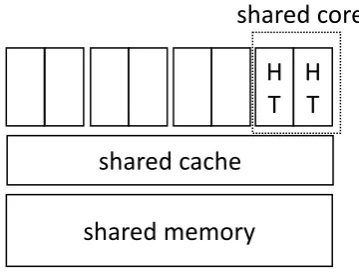
[image:32.595.190.370.120.258.2]shared core
Figure 2.5:Shared hardware resources can be shared channels.
Therefore recording high-frequency system signals with this approach not only incurs unacceptable overhead, but also introduces significant observer effects.
Interrupt-driven Sampling The interrupt-driven sampling approach sends inter-rupts to target hardware contexts, and executes profiling code in the interrupt han-dler. Figure 2.4(b) shows how this approach associates hardware events of IPCs and cycles with software events of the current method. Profilers send periodic interrupts to the target CPU at low frequencies, between 1 KHz and 100 KHz. In the interrupt handler, the profiling code computes the IPC and cycles of the last sampling period, then associates them with the current method which is read from the current thread’s stack.
Interrupt-driven sampling is the default profiling approach for current continuous system profilers because: 1) it avoids inserting instrumentation code; 2) it can cover a large set of system components by randomly adjusting sampling intervals over a long time, and 3) it is able to control its sampling overhead by limiting sampling frequencies. However, the possibility of overwhelming the operating system’s ca-pacity to service interrupts plus the overhead of taking interrupts places limits on sampling frequencies. As a result, this approach cannot observe fine-grain behaviors and accurately analyze sampled signals. As shown in Figure 2.4(b), because millions of cycles and thousands of methods can be executed in one sampling period, the aver-age IPC of the sampling period neither shows high-frequency signals, nor accurately represents the IPCs of associated methods.
Direct Observation Both the instrumentation approach and the interrupt-driven approach execute the profiling code in target contexts, either by inserting the instru-mentation code to target software or sending interrupts to target hardware threads to execute the instrumentation code. The overhead of executing injected profiling code prevents these approaches from observing fine-grain system behavior.
hard-§2.2 Profiling Techniques 15
ware threads via channels hosted by shared resources on multicore processors as shown in Figure 2.5. The observer thread samples software events of other threads from remotely accessible software channels such as shared memory and shared files. For hardware events, it configures its performance counters to count hardware events of shared domains (e.g., a shared last level cache) and also can use hardware profiler buffers to record hardware events from other hardware threads.
Figure 2.4(c) shows how the observer thread samples similar events to the example in Figure 2.4(b). Two hardware threads, HT1 and HT2, share one simultaneous multithreading (SMT) core. The observer thread running on HT2 remotely samples events from HT1. It uses performance counters in its hardware context to compute the IPC and cycles of HT1, then associates them with the current method ID of the task running on HT1 which it reads from the task’s stack in shared memory.
The direct observation approach samples signal channels at extremely high fre-quencies in a tight loop, and doing so does not introduce extra direct overhead to target contexts because it is non-obtrusive, which makes this approach a good candi-date for high-frequency full-stack continuous profiling.
2.2 Profiling Techniques
General-purpose profilers were developed at the same time as early high-level lan-guages: ALGO, FORTRAN, and C. These high-level languages encouraged engineers composing large complex programs with high-level abstractions such as FORTRAN statements, C functions and libraries. To attribute performance to activities with high levels of abstraction, compiler researchers and engineers started to build general-purpose profilers. Knuth [1971] uses The FORTRAN Debugging Aid Program (FOR-DAP) that can instrument source code of FORTRAN programs, to gather execution frequencies of FORTRAN statements over a set of selected FORTRAN programs. Sat-terthwaite [1972] implements an ALGOL W profiler by extending the ALGOL W compiler. The profiler inserts instrumentation code when compiling ALGOL pro-grams to collect run-time statistics and traces of statements. Graham et al. [1982] designed gprof, a general-purpose profiler that records the run-time call graph and attributes execution time with C functions. They developed gprof in response to their efforts to improve their code generator [Graham, 1980]. Gprof adopts two profiling approaches: inserting instrumentation code in the function prologue to gather the call graph, and periodically sending timer interrupts to target programs to sample execution-time statistics of functions.
16 Background
collects profiling statistics on execution frequency, branch directions, and memory-mapped I/O operations of source instructions.
Inserting instrumentation code into final binary executable files is more general and independent. MIPS’s pixie, SUN’s Spix, and qp/qpt [Larus and Ball, 1994] insert instrumentation code to binary executable files to gather run-time statistics and traces. ATOM [Srivastava and Eustace, 1994] and PIN [Luk et al., 2005] provide binary modification infrastructures, letting engineers customize their instrumentation code to collect different profling results.
To avoid reloading modified operating system images, Dtrace [Cantrill et al., 2004], Ftrace [Rostedt, 2019], and BCC [iovisor, 2019] reuse built-in instrumentation probes added by OS developers to dynamically load instrumentation code. They also provide script languages to help engineers develop customized instrumentation code.
Inserting instrumentation code is obtrusive and invoking the instrumentation code in hot paths introduces high overhead. Conte et al. [1996] design a low-overhead dedicated hardware buffer that is able to record statistics of conditional branches. Chen et al. [2006] proposes Log-Based Architectures (LBA) that is capable of recording and analyzing sofwate execution logs. commodity processors support hardware profiling buffers too. Intel PEBS [Intel, 2019] and AMD IBS [AMD, 2019] store sampled instructions and associated CPU states in profiling buffers. Intel Processor Trace [Strong, 2014] and ARM CoreInsight [ARM, 2019] record full traces of instructions.
Continuous profiling the whole stack, including hardware, the operating system, libraries and applications, can greatly help engineers understand system behavior, but it must have low overhead. DCPI [Anderson et al., 1997] and Morph [Zhang et al., 1997] are progenitors of today’s interrupt-driven continuous profilers such as Vtune [Intel, 2014], Oprofile [OProfile, 2014], Linux Perf [Linux, 2014a], and Google GWP [Ren et al., 2010]. They periodically send interrupts and sample software and hardwaren events in the interrupt handler. To avoid overwhelming interrupt handling and control overhead, they samples at low frequencies, between 1 KHz and 100 KHz. Regular interval sampling produces biased samples [Mytkowicz et al., 2010; Bond and McKinley, 2007], DCPI introduced random sampling intervals to avoid the bias. Modern computer systems have a complex system stack. Correlating events of components helps engineers find root causes of performance problems. Vertical Profiling [Hauswirth et al., 2004] correlates hardware, operating system, library, JVM, and application events. Ammons et al. [1997] attribute hardware events such as cache misses with hot paths. Kanev et al. [2015] continuously profile more than 20,000 Google machines over three years and correlate stack traces with hardware events.
2.3 Problem Domain
§2.4 Summary 17
complex systems, identifying optimization opportunities is challenging. For example, Kanev et al. [2015] find that common components in the lower levels of the system stack can take 30% of cycles across Google servers after continuously profiling 20,000 servers over three years.
In this dissertation, we focus on building full-stack continuous profilers to help engineers continuously observe, analyze, and optimize production systems on exist-ing hardware platforms, especially fine-grain complex interactions between system components.
2.4 Summary
Chapter 3
SHIM
Discovering performance optimizations is a challenging process: engineers observe system behavior, understand root causes, and then propose new optimizations. Unfor-tunately, the root causes of many problems occur at a finer granularity than existing profilers can observe. Limited by their interrupt-driven sampling approach, current profilers’ sample rates are too low to observe the fine-grain system behavior of online production systems. In this chapter, we introduce Shim, a new sampling approach that samples at resolutions three to five orders of magnitude finer than previous profilers. Shim views computer systems as high-frequency signal generators, and observes fine-grain system behavior by sampling generated hardware and software signals at high frequencies in a profiling observer thread running on existing multi-core hardware.
This chapter is structured as follows. Section 3.2 motivates fine-grain profiling by comparing coarse-grain and fine-grain sampling for hot methods, instructions per cycle (IPC), and IPC for hot methods. Section 3.3 introduces the design and implementation of Shim. Section 3.4 examines Shim’s observer effects and shows how Shimmanages them to improve its accuracy. Section 3.5 describes our evaluation methodologies and Section 3.6 evaluates the strengths, limitations, and overheads of a variety of Shimconfigurations and sampling rates.
The work described in this chapter is published in “Computer Performance Mi-croscopy with SHIM” [Yang et al., 2015a].
3.1 Introduction
Understanding the complex interactions of software and hardware remains a daunt-ing challenge. Developers currently use two main profildaunt-ing approaches: instrumenta-tion and interrupt-driven sampling. They pose hypotheses and configure these tools to instrument software events and read hardware performance counters. Next they attempt to understand and improve programs by correlating code with performance events, e.g., code to bandwidth consumption, low Instructions Per Cycle (IPC) to branch behavior, and loops to data cache misses. State-of-the-art continuous profil-ing tools, such as Intel VTune and Linux perf, take an interrupt and then sample hardware performance counter events [Intel, 2014; Linux, 2014a]. The possibility of
20 SHIM
overwhelming the kernel’s capacity to service interrupts places practical limits on their maximum resolution [Linux, 2014b]. Consequently, their default sample rate is 1 KHz and their maximum sample rate is 100 KHz, giving profile resolutions of around 30 K to 3 M cycles on a modern core.
Unfortunately, sampling at a period of 30 K cycles misses high frequency events. Statistical analysis sometimes mitigates this problem, for example, when a single small portion of the code dominates performance. However, even for simple rate-based measures such as IPC, infrequent samples are inadequate because they report the mean of the period, obscuring meaningful fine-grain variations such as those due to small but ubiquitous code fragments, as we show in Section 3.2.
Consequently, developers must currently resort to microbenchmarks, simulation, or direct measurement to examine these effects. However, microbenchmarks miss interactions with the application context. Simulation is costly and hard to make accurate with respect to real hardware. Industry builds proprietary hardware to examine performance events at fine granularities at great expense and thus such results are scarce.
The alternative approach directly measures code by adding instrumentation auto-matically or by hand [Linux, 2014a; Demme and Sethumadhavan, 2011; Zhao et al., 2008; Ha et al., 2009]. For instance, developers may insert instrumentation that di-rectly reads hardware performance counters. Software profilers such as PiPA and CAB instrument code automatically to record events such as path profiles. A con-suming profiler thread analyzes the buffer offline or online, sampling or reading it exhaustively. In principal, developers may perform direct measurement and fine-grain analysis with these tools [Ammons et al., 1997]. However, inserting code and the ~30 cycles it takes to read a single hardware performance counter both induce observer effects. Observer effects are inherent to code instrumentation and are a func-tion of the number of measurements—the finer the granularity and the greater the coverage, the more observer effect. In summary, no current solution delivers accurate continuous profiling of hardware and software events with low observer effects at resolutions of 10s, 100s, or even 1000s of cycles.
This chapter introduces a new high resolution approach to performance analysis and implements it in a tool called Shim.1 Shim efficiently observes events in a separate thread by exploiting unutilized hardware on a different core or on the same core using Simultaneous Multithreading (SMT) hardware. A Shim observer thread executes simultaneously with the application thread it observes, but in a separate hardware context.
Signals We view computer systems as high-frequency signal generators that gen-erate high-frequencysignals—time-varying software and hardware events—tosignal channels, the places that hold hardware and software states. A Shimobserver thread samples hardware signals from hardware channels such as performance counters, and
1A shim is a small piece of material that fills a space between two things to support, level, or adjust
§3.1 Introduction 21
software signals from software channels (e.g. memory locations that store method and loop identifiers). A compiler or other tool configures software signals and com-municates memory locations to Shim. Shimtreats software and hardware data uni-formly by reading (sampling) memory locations (software channels) and performance counters (hardware channels) together at very high frequencies, e.g., 10s to 1000s of cycles. The observer thread logs and aggregates signals. Then further online or offline analysis acts on this data.
Measurement fidelity and observer effects The fidelity of continuous sampling is subject to at least three threats: (i) skew in measurement of rate metrics, (ii) observer effects, and (iii) low sample rates. Shimreduces these effects.
To improve the fidelity of rate metrics, we introduce double-time error correction
(DTE), which automatically identifies and discards noisy samples by taking redundant timing measurements. DTE separately measures the period between the start of two consecutive samples and the period between the end of the samples. If the periods differ, the measurement was perturbed and DTE discards it. By only using timing consistency, DTE correctly discards samples of rate measurements that seem obviously wrong (e.g., IPC values of>10), without explicitly testing the sample itself. A minimal Shimconfiguration that only reads hardware performance counters or software signals inherent to the code does not instrument the application, so has no direct observer effect. Shim induces secondary effects by contending for hardware resources with the application. This effect is largest when Shim shares a single core with the application using Simultaneous Multithreading (SMT) and contends for instruction decoding resources, local caches, etc. We find that the Shimobserver thread offers a constant load, which does not obscure application behavior and makes it possible to reason about Shim’s effect on application measurements. When Shim
executes on a separate core, it interferes much less, but it still induces effects, such as cache coherence traffic when it reads a memory location in the application’s local cache. This effect is a function of sampling and memory mutation rates. Shimdoes not address observer effects due to invasive instrumentation, such as path profiles.
Randomization of sample periods is essential to avoiding bias [Anderson et al., 1997; Mytkowicz et al., 2010]. We show high frequency samples are subject to many perturbations and their sample periods vary widely.
We measure a variety of configurations and show that Shimdelivers continuous profiles with a rich level of detail at very high sample rates. On one hand, Shim
delivers ~15 cycle resolution profiling of one software signal in memory on the same core with SMT at a 61% overhead. Placing these results in context, popular Java profilers, which add instrumentation to applications, incur typical overheads from 10% to 200% at 100 Hz [Mytkowicz et al., 2010], with sample periods six orders of magnitude longer than Shim. Because Shim offers a constant load on SMT, Shim
observes application signals with reasonable accuracy despite its overhead. To fully validate Shim’s fine-grain accuracy would require ground truth from proprietary hardware-specific manufacturer tools, not available to us.
22 SHIM
software signal with just 2% overhead.
Case Studies The possibility of high fidelity, high frequency continuous profiling invites hardware innovations such as ultra low latency control of dynamic voltage and frequency scaling (DVFS) and prefetching to tune policies to fine-grained program phases. We analyze the ILP and bandwidth effects of DVFS and turning off and on prefetching on two examples of performance-sensitive code, showing that fine-grain policies have the potential to improve efficiency.
Hardware to improve accuracy and capabilities Modest hardware changes could significantly reduce Shim’s observer effects, improve its capabilities, and make it a powerful tool for architects as well as developers. When Shim shares SMT execution resources, a thread priority mechanism, such as in MIPS and IBM’s Power series [Snavely et al., 2002; Boneti et al., 2008], would reduce its observer effect. Executing Shim with low priority could limit the Shim thread to a single issue slot and only issue instructions from it when the application thread has no ready instruction. When Shim executes on a separate core, a no-caching read, such as on ARM hardware [Stevens, 2013], would reduce observer effects when sampling memory locations. A no caching read simply transfers the value without invoking the cache coherence protocol. On a heterogeneous architecture, the simplicity of the Shim observer thread is highly amenable to a small, low power core which would reduce its impact. If hardware were to expose all performance counters to other cores, such as in IBM’s Blue Gene/Q systems [Bertran et al., 2013], Shim could capture all events while executing on a separate core. We show that Shim in this config-uration would incur essentially no overhead and experience very few observer effects. By repurposing existing hardware, Shim reports for the first time fine-grain contin-uous sampling of hardware and software events for performance microscopy. We make Shim publicly available [Yang et al., 2015b] to encourage this line of research and development.
3.2 Motivation
This section motivates fine-grain profiling by comparing coarse-grain and fine-grain sampling for hot methods, instructions per cycle (IPC), and IPC for hot methods.
§3.2 Motivation 23
0 0.2 0.4 0.6 0.8 1
0 10 20 30 40 50 60 70 80 90
Fraction of samples
Method ID 520 cycles (avg IPC 1.13) 50 K cycles (avg IPC 1.14) 4997 K cycles (avg IPC 1.14)
(a) Hot methods
0 0.2 0.4 0.6 0.8 1
0 0.5 1 1.5 2 2.5 3 3.5
Fraction of samples
IPC 476 cycles (avg IPC 1.10) 45 K cycles (avg IPC 1.11) 4515 K cycles (avg IPC 1.11)
(b) Instructions Per Cycle (IPC)
0 0.5 1 1.5 2 2.5
0 10 20 30 40 50 60 70 80 90 100
Me
th
o
d
2IP
C
1002hottest2methods 7802Hz2(avg2IPC21.142std20.05)
782KHz2(avg2IPC21.142std20.22) SHIM27.52MHz2(avg2IPC21.132std20.34)
[image:41.595.143.501.101.734.2](c) IPC of hot methods
24 SHIM
36% of all samples, while the rightmost point of the curve reveals that the 100 most sampled methods account for 97% of all samples. The blue and red bars are the cu-mulative frequency histograms for medium and low frequency sampling respectively, reordered to align with the green high frequency curve. A gap appears in the blue and red histograms whenever a method in the green hottest 100 does not appear in their top 100 method histogram. The red histogram is noisy because many methods attract only two samples. However, the blue histogram is very well sampled, with the least sampled method attracting 142 samples. Most bars fall below the green line, indicating that they are relatively under sampled at lower frequencies, although a few are over sampled. While sample rate does not greatly affect which methods fall in the top 50 hottest methods, Mytkowicz et al. [2010] show that randomization of samples is important to accurately identifying hot methods.
Revealing high frequency behavior On the other hand, Figures 3.1(b) and 3.1(c) show that sampling at lower frequencies masks key information for metrics that vary at high frequencies, using IPC as the example. Figure 3.1(b) presents IPC for retired instructions. We measure cycles and instructions retired since the last sample to calculate IPC. The figure shows the cumulative frequency distribution for IPC over all samples. The green curve shows that when the sample rate is higher, Shimobserves a wider range of IPCs. About 10% of samples observe IPCs of less than 0.93 and 10% observe IPCs of over 1.45, with IPC values as low as 0.04 and as high as 3.5. By contrast, when the sample period grows, observed IPCs fall in a very narrow band between 1.0 and 1.3, with most at 1.11. As the sample period grows, each observation asymptotically approaches the mean for the program.
Figure 3.1(c) illustrates a second source of error due to coarse-grain sampling of rate-based metrics. In Figure 3.1(c), we calculate IPC, attribute it to the executing method, and then plot the average for each of the hottest 100 methods. Lowest fre-quency sampling (red) suggests that IPC is very uniform, at around 1.14, whereas high frequency sampling (green) shows large variations in average IPC among meth-ods, from 0.04 (#4), to 2.39 (#59). The lower IPC variation at lower sample rates is largely due to the fact that IPC is measured over a period. As that period grows, the IPC reflects an average over an increasingly large part of the running program. This period is typically much larger than the method to which it is attributed. When the period is orders of magnitude longer than the method’s execution, sampling loses an enormous amount of information, quantified by the standard deviations at the top of Figure 3.1(c). This problem occurs whenever a rate-based measure is determined by the period of the sample.
§3.3 Design and Implementation 25
3.3 Design and Implementation
Viewing time-varying events as signals motivates our design. A Shimobserver thread executes continuously in a separate hardware context, observing events from an application thread executing on neighbor hardware. The observer samples hardware and software signals from signal channels at extremely high frequencies, logging or analyzing samples depending on the configuration. Shim samples signals that the hardware automatically generates in performance counters (hardware channels) and memory locations (software channels) that the application either explicitly or implicitly generates in software. Shimconsists of three subsystems: a coordinator, a sampling system, and a software signal generating system.
Signals Shimobserves signals from either hardware or software for three kinds of events: tags,counters, andrates. An eventtagis an arbitrary value, such as a method identifier, program counter, or stack pointer. An event counter increments a value each time the event occurs. Hardware counters can choose events to be monitored from a rich set of performance events supported by the processor, including cycles, instructions retired, cache misses, prefetches, and branches taken. Software similarly may count some events, such as allocations, method invocations, and loop iterations. Software signals may be implicit in the code already (e.g., a method identifier or parameter on the stack) or a tool may explicitly add them. For example, the compiler may insert path profiling code. Shim computes rates by reading a given counter
X and the clock, C, at the start and end of a sample period and then computing the change in X over change in C for that period. Section 3.4 describes how Shim
correctly reports rates by detecting and eliminating noise in this process.
26 SHIM
Sampling system The Shim observer thread implements the sampling system. It observes some number of hardware and software signals at a given sampling rate, as configured by the coordinator. The sampling system observes hardware signals by reading performance counters and the software signals by reading memory locations. The coordinator initializes the sampling system by creating a buffer for samples. The observer thread reads the values of the performance counters and software addresses in a busy loop and writes them in this buffer, as shown in Figure 3.2.
We divide the observer into two parts, one for counters (lines 4 to 9) and another for tags (lines 13 to 16). Software or hardware may generate counters, rates, or tag signals. Recording counters and rates requires high fidelity in-order measurements. We use the rdtscp()instruction, which returns the number of cycles since it has been reset. It forces a synchronization point, such that no read or write may issue out of order with it. It requires about 20 cycles to execute.
Each time Shim takes one or more counter samples, it first stores the current clock (line 4 in Figure 3.2). It then synchronously reads every counter event from either hardware performance counters or a software specified memory location and then stores the clock again (line 9). We can measure rates by comparing values read at one period to those read at the previous one. The difference in the clock tells us the period precisely. If the time to read the counters (lines 4 to 9) varies from period to period, the validity of the rate calculation may be jeopardized. As we explain in Section 3.4, we can precisely quantify such variation and filter out affected measurements. Because it is correct to sample any tag value within the period, we do not read tags synchronously (lines 13 to 16).
The simple observer in Figure 3.2 stores samples in a buffer. Realistic observers will use bounded buffers which are periodically consumed or written to disk, or they may perform lightweight online analysis such as incrementing a histogram counter. Chapter 4 shows one example of realistic observers, Tailor that correlates samples from different system components online. Real-time feedback directed optimizers can process and act on such data, Chapter 5 shows Elfen, a Shim-based scheduler, continuously monitors the status of latency-critical requests, and makes real-time scheduler decision based on the status.
Signal system The signal system generates software signals and selects hardware and software signals.
For hardware signals, we choose and configure hardware performance counter events. These configurations depend on the analysis and on which core the observer executes. For example, when observing the number of cycles the application thread executes, we only need the elapsed cycles event counter, when all hardware threads execute at the same frequency. To measure how many instructions the application executes, we need two counters on a two-way SMT processors to derive what happens on the neighbor thread. One counter counts instructions retired by the whole core and another one counts instructions retired by the Shimthread. The difference is due to the application thread.