202 | P a g e
Application of Fuzzy logic in Micro- Drilling
Machining Process
.
Ranadhir R Landge
1, Dr. Atul B Borade
2 1Ph.D.Research Scholar and Workshop Superintendent (Asstt. Professor),
Government College of Engineering, Jalgaon, Maharashtra, (India)
2Professor and Head of Mechanical Engineering Department,Jawaharlal Darda Institute of
Engineering and Technology, Yavatmal, Maharashtra, (India)
ABSTRACT
Fuzzy logic systems are widely used for control, system identification, and pattern recognition problems. It achieves the deduction in optimization, which describes the dynamic behavior of the system to be controlled . Because of the number, complexity and unclear, vague nature of the variables of the dynamic systems that may influence the decision maker’s decision, fuzzy logic is the most suitable solution . Most of automotive components are manufactured using a conventional machining process, such as turning, drilling, milling, shaping and planning, etc. Out of these conventional process Drilling originates hole on any metal.Micro Drilling is high precision process for smaller holes below 1mm.It is used for the purpose increasing quality of special parts and items during goal in machining operations This research aims to investigate the effect of the cutting speed, feed rate and depth of hole on material removal rate (MRR) and Machining time in micro drilling were analyzed. Experiments were conducted based on the Taguchi design of experiments (DOE) with orthogonal array, with optimization of the Fuzzy parametric deduction to Optimize MRR .
Keywords: Micro-drilling, Cutting tool, Material removal rate, Fuzzy logic,Taguchi
.
I. INTRODUCTION
Fuzzy sets are sets whose elements have degrees of membership. Fuzzy sets were introduced by Lotfi A. Zadeh
and Dieter Klaua in 1965 as an extension of the classical notion of set. At the same time, defined a more
general kind of structures called L-relations, which were studied by him in an abstract algebraic context. Fuzzy relations, which are used now in different areas, such as linguistics decision-making (Kuzmin, 1982) and
clustering, are special cases of L-relations when L is the unit interval [0, 1]. System performance can be improved by undertaking design optimization process in fuzzy system in which the adjustable parameters are
tuned to maximize a given performance criterion some and are tuned to minimize. Fuzzy linguistic models permit the translation of verbal expressions into numerical ones. Therefore, the input output relationship of the
process is described by the collection of fuzzy control rules involving linguistic variables rather than a
complicated dynamic mathematical model[1]. Material removal rate is commonly considered as a major
manufacturing goal in machining operations in many of the existing research. Taguchi method , an experiment
203 | P a g e
through the setting of design parameters, but also reduce the sensitivity of the system performance to sources of
variation.[2]
Micro-drilling refers to the drilling of holes less than 0.5 mm (0.020 in). Drilling of holes at this small diameter
presents greater problems since coolant fed drills cannot be used and high spindle speeds are required. High
spindle speeds that exceed 10,000 RPM also require the use of balanced tool holders. Micro drilling is one of the
most fundamental machines technologies and it is moving high precision and high spindle speed application in
manufacturing field and increasing productivity and quality. Now a day’s micro drillings have a great use for
manufacturing to apply special parts and items. Micro hole drilling is the precision hole drilling technology to
use in manufacturing and work shop. The micro drill tools play a critical role is increasing the productivity of a
cutting process. Although the price of a cutting tool itself is relatively low, the costs caused by tool failures are
considerably higher. Therefore, from the viewpoint of cost and productivity, modeling and optimization of
drilling processes are extremely important for the manufacturing industry. The poor removal of chips in deep
drilling of small diameter is often the cause of tool breakage and poor quality surface. High speed machining
technology, the smaller the tools, the higher the spindle speed you will need to efficiently machine quality parts
and avoid tool breakage. High-frequency spindles with speed ranges.[3] Cutting tools are used of mostly of the
material Tugnsten Carbidewhich are available in wide range of mico mm sizes , longer flute length, Improves
wear resistance for long tool life, Better chip evacuation and lowers friction during drilling process and Enables
deeper drilling.
II.PERFORMANCE OF EXPERIMENT
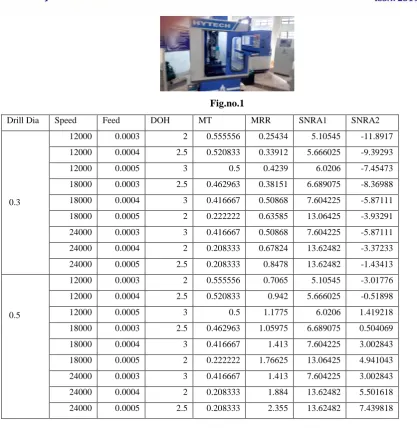
An Experiment was carried out on a CNC micro drilling processes(fig no.1) in order to find the best quality of
drilling for Brass material. Drill bit size was 0.3mm and 0.5mm.Experiments were performed by different high
spindle speed (12,000-24,000 rpm) and feed at three different levels. The results were analyzed using
optimization of process parameters, MRR.[3] In order to efficiently reduce the conventional experimental tasks,
the orthogonal array by using design parameters will be proposed and adopted[4]. Using Minitab 17 for Taguchi
Design of Experiment considering three input parameters , three level orthogonal array is constructed as given
below in table no 1. Taguchi Orthogonal Array Design ,L9(3^3),Factors: 3,Runs: 9,Columns of L9(3^4)
Array,1 2 3 and respective Machinig time and Material Removal Rate was calculated by using below formula in
equation no.(1) and (2)with their Signal to noise Ratio, and Signal to Noise Ratio is calculated as mentioned in
equation no.(3) and (4).
Machining time = DOH/Speed /Feed. ---(1).
MRR = Initial weight-Final weight/ density/machining time.---(2)
S/N=-10 ﴾ log sum y2/n) ---lower the better. ---(3)
204 | P a g e
Fig.no.1
Drill Dia Speed Feed DOH MT MRR SNRA1 SNRA2
0.3
12000 0.0003 2 0.555556 0.25434 5.10545 -11.8917
12000 0.0004 2.5 0.520833 0.33912 5.666025 -9.39293
12000 0.0005 3 0.5 0.4239 6.0206 -7.45473
18000 0.0003 2.5 0.462963 0.38151 6.689075 -8.36988
18000 0.0004 3 0.416667 0.50868 7.604225 -5.87111
18000 0.0005 2 0.222222 0.63585 13.06425 -3.93291
24000 0.0003 3 0.416667 0.50868 7.604225 -5.87111
24000 0.0004 2 0.208333 0.67824 13.62482 -3.37233
24000 0.0005 2.5 0.208333 0.8478 13.62482 -1.43413
0.5
12000 0.0003 2 0.555556 0.7065 5.10545 -3.01776
12000 0.0004 2.5 0.520833 0.942 5.666025 -0.51898
12000 0.0005 3 0.5 1.1775 6.0206 1.419218
18000 0.0003 2.5 0.462963 1.05975 6.689075 0.504069
18000 0.0004 3 0.416667 1.413 7.604225 3.002843
18000 0.0005 2 0.222222 1.76625 13.06425 4.941043
24000 0.0003 3 0.416667 1.413 7.604225 3.002843
24000 0.0004 2 0.208333 1.884 13.62482 5.501618
24000 0.0005 2.5 0.208333 2.355 13.62482 7.439818
Table no.1
The performance measure, signal-to-noise ratio(S/N) can be used to obtain the optimal parameter combinations.
In the Taguchi method, a loss function will be defined to calculate the deviation between the experimental value
and the desired value. Usually, there are three categories of the performance characteristics in the analysisofthe
signal-to- noise ratio, i.e., th etter .To obtain optimal machining performance, the minimum Machining time and
the maximum MRR are desired. Therefore, the lower the-better MT and the higher-the better MRR should be
selected. This method, the S/N ratio is used to determine the deviation of the performance characteristic from
the desired value. .The S/N ratio is found by using Taguchi Analysis in Minitab 17[6]
Taguchi Analysis: MRR versus Speed, Feed, DOH
III.FUZZY LOGIC
MATLAB is a convenient Software to perform fuzzy logic methodology. Considering Signal to noise ratios for
205 | P a g e
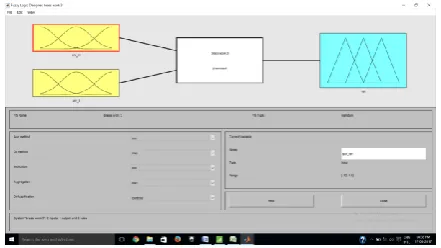
Optimal performance Index form 0 to 1 intervals. [7] It is carried out by Defining the Input /Output variables
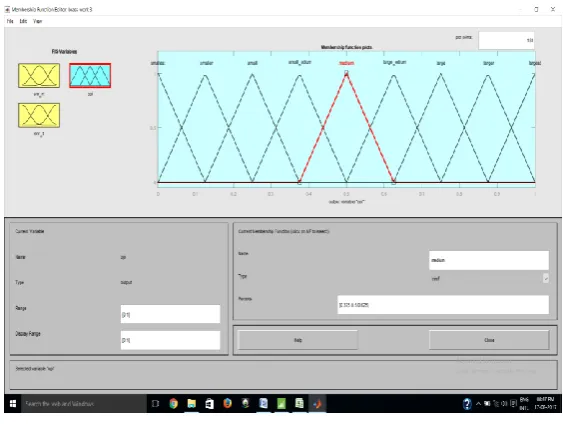
Fig no.2 a & b then the Member functions were Selected for 0.3mm and 0.5mm.Fig.no.3 a,b,cand d.Then
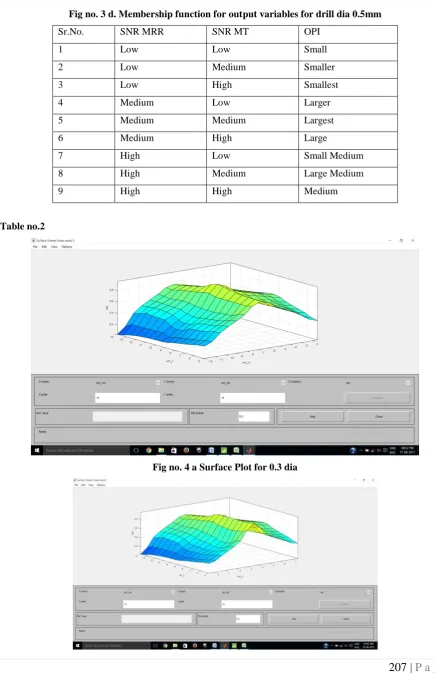
fuzzy rules were developed as shown in Table no.2.Then centroid for each combination of SNR was found as a
value of Optimal Performance Index(OPI), which is called Defuzzification. Shown in fig 4 a,b, c and d and
value of OPI is given in Table no.3
Fig.No.2 a. Defining Input Output variables for drill dia 0.3 mm
Fig no.2 b. Defining Input Output variables for drill dia 0.5 mm
206 | P a g e
Fig no.3 b. Membership function for input variables for drill dia 0.5mm
207 | P a g e
Fig no. 3 d. Membership function for output variables for drill dia 0.5mm
Sr.No. SNR MRR SNR MT OPI
1 Low Low Small
2 Low Medium Smaller
3 Low High Smallest
4 Medium Low Larger
5 Medium Medium Largest
6 Medium High Large
7 High Low Small Medium
8 High Medium Large Medium
9 High High Medium
Table no.2
208 | P a g e
Fig no.4 b. Surface plot for 0.5 dia
Fig no. 4 c Defuzzification for 0.3 dia
Fig no 4 d Defuzzification for 0.5 dia
Drill dia Input value Ouput value Drill dia Input value Output value
SNRA1 SNRA2 OPI SNRA1 SNRA2 OPI
0.3mm
5.10545 -1.8917 0.25
0.5mm
5.10545 -3.01776 0.25
5.666025 -.39293 0.544 5.666025 -0.51898 0.461 6.0206 -.45473 0.801 6.0206 1.419218 0.732
6.689075 -.36988 0.588 6.689075 0.504069 0.474 7.604225 -.87111 0.789 7.604225 3.002843 0.812 13.06425 -.93291 0.644 13.06425 4.941043 0.648
7.604225 -.87111 0.789 7.604225 3.002843 0.812
13.62482 -.37233 0.5 13.62482 5.501618 0.6
13.62482 -.43413 0.5 13.62482 7.439818 0.5
209 | P a g e
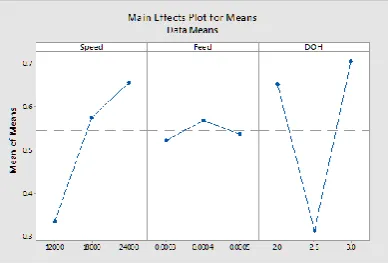
IV. RESULTS
By considering the parameter combinations of the nine sets of experiment based on the L9 orthogonal array, the
quantified results from fuzzy deduction for the MRR are determined in the form Optimal Performance Index
and shown as Table 4. Introducing the deduction results as the Mean for MRR under larger-the-best expectation,
the results of factor responses are calculated and listed in Table 5. The mean effects for Means are then drawn
by MINITAB 17 and shown as Fig. 7.
Results of OPI are recorded and response table for analysis of mean is done in TAGUCHI Analysis
Taguchi Analysis: OPI 1 versus Speed, Feed, DOH
Response Table for Means 0.3 Response Table for Means 0.5
Level Speed Feed DOH Level Speed Feed DOH
1 0.5317 0.5423 0.4647 1 0.4810 0.5120 0.4993
2 0.6737 0.6110 0.5440 2 0.6447 0.6243 0.4783
3 0.5963 0.6483 0.7930 3 0.6373 0.6267 0.7853
Delta 0.1420 0.1060 0.3283 Delta 0.1637 0.1147 0.3070
Rank 2 3 1 Rank 2 3 1
Table.no.4
210 | P a g e
Fig.no 6 mean for drill dia 0.5mm
V. CONFIRMATION TEST
The optimum result is achieved by our proposing deduction optimization technique, the machining operations
under both fuzzy TAGUCHIoptimization parameters and benchmark parameters; Speed(medium), Feed
(medium), DOH (medium),which are often introduced into the confirmation experiment in many of the studies
for comparison to the optimum parameters, are performed on the CNC Micro-drilling.It is observed that the
MRR under fuzzy deduction parameters meets the benchmark parameter which is slightly more than benchmark
parameters.
Drill Dia Bechmark level Fuzzy Level
0.3 mm 18000 A2 24000 A3
0.0004 B2 0.0004 B2
2.5 C2 2.5 C2
MRR 0.50 0.66
0.5mm 18000 A2 24000 A3
0.0004 B2 0.0004 B2
2.5 C2 2 C1
MRR 1.41 1.8
Table no.5
VI.CONCLUSIONS
This parametric deduction scheme was proposed parameters under the considerations of MRR. Optimum
deduction parameters was calculated to indicate the effectiveness of the proposed fuzzy TAGUCHI optimization
method which was understood by confirmation test also by this experimental results validate the potency that
the MRR meets the benchmark parameters obtained from average value of parameters This type optimization
will suggest the manufacturers to go fuzzy logic analysis through TAGUCHI prior to manufacturing. This gives
211 | P a g e
VII.ACKNOWLEDGEMENT
The authors would like to express sincere thanks to SantGadgeBaba Amravati University for registration of this
research work and also express thanks to College of Engineering and Technology,Akola for availing necessary
laboratories facilities.The authors also gratefully acknowledge for necessary financial support of Government
College of Engineering,Jalgaon and also grateful to Jawaharlal Darda Institute of Engineering and
Technology,Yavatmal for their time to time help.
REFERENCES
[1] L. A. Zadeh, “Outline of a New Approach to the Analysis of Complex Systems and Decision Processes,”
IEEE Transactions on Systems, Man, and Cybernetics, SMC- 3(1), 28-44, January 1973.
[2] Tian-SyungLan,(2011). Fuzzy Parametric Deduction for Material Removal Rate Optimization, Journal of
Mathematics and Statistics,7(1), pp.51-56
[3] B.Y. Lee, H.S. Liu and Y.S. Tarng, (1996). Modeling and Optimization of Drilling Process. Department of
Mechanical ManufactureEngineering, National Huwei Institute of Technology, Huwei, 632, pp. 1-9
[4] Sahoo P., Barman T. K. and Routara B. C., (2008), “Taguchi based practicaldimension modeling and
optimization in CNC turning”, Advance in ProductionEngineering and Management, Volume 3, Number 4,
pp. 205-217.
[5]. B.K Hinds, G.M Treanor ,(2011)” Analysis of stresses in micro-drills using the finite element method”
International Journal of Machine Tools and Manufacture.
[6] Singh H. and Kumar P., (2006), “Optimizing Feed Force for Turned Parts throughthe Taguchi Technique”,
Sadhana, Volume 31, Number 6, pp. 671–681.
[7] S.Prasad,P.Rajkhowa,N.Lahon,I.Shivkoti,P.M.Pradhan(2014),”Modelling and Optimization od EDM Process:A Fuzzy based Approach”,Volume 4,Issue 3,pp34-38