International Journal of Innovative Technology and Exploring Engineering (IJITEE) ISSN: 2278-3075, Volume-8 Issue-9, July 2019
Abstract: Presence of nodules in lung images can be an indication of multiple types of diseases such as tumor, cancer, etc. Detection of nodules for lung images is a ubiquitous task, which requires lot of computations for pre-processing, tissue detection, removal of non-nodule regions and finally nodule segmentation. In this paper we propose a multi-threshold descriptor based algorithm which applies multiple levels of thresholds to the image, in order to detect and remove all the non-nodule regions and finally uses KNN algorithm in order to classify the input image into benign or malignant. The training and testing sets are carefully selected in order to obtain optimal accuracy for the system. In this work, we obtain 82.65% accuracy,sensitivity and specificity is 85.71% and 80.35% respectively for classification of the input medical image.
Index Terms: classification, KNN algorithm, multi-threshold, nodule.
I. INTRODUCTION
Lung cancer is a dangerous disease, which is also known as lung carcinoma and it’s a malignant lung tumor which is identified by the extremely unrestrained cell growth arising in the lung tissues. Lung cancer is one of the risks for the life of human throughout the world. There is a high risk of death due to the lung cancer as compared to the other kinds of malignant growth (cancer). Lung cancer is standout amongst the most dangerous cancer in the whole universe, with the least survival count after the determination, with a continuous growth in the count of mortality every passing year. If the disease can be identified at the beginning periods, then the survival rate of an individual is high [1]. Generally, in lung cancer there are mainly 4 stage; 1 to 4. Staging of cancer relies on tumor size and lymph node position. CT scan is more powerful than normal chest x-ray in identifying and treating the malignant growth of lung. An expected 85% of lung malignant growth cases in males and 75% in females are brought about by smoking [2]. An expected 228,150 new cases of lung disease will be analyzed in the US in 2019. An expected 142,670 deaths from lung malignant growth will occurs in 2019 [1]. Therefore, diagnosis of a disease in the earlier stage is very important. The aim of this research paper is to detect the cancerous lung nodule and must provide a good accurately evaluated outcomes by applying enhancement, segmentation and classification methods.
Revised Manuscript Received on July 05, 2019
Sakshi Wasnik, Electronics Engineering Department, Shri. Ramdeobaba College of Engineering and Management, Nagpur, India
Pallavi Parlewar, Electronics and Communication Engineering Department, Shri. Ramdeobaba College of Engineering and Management, Nagpur, India
Dr. Prashant Nimbalkar, Radiologer, Precision Scan and Research Centre, Nagpur, India.
II. LITERATURE REVIEW
Ashwin S et al. [3] proposed a two stage CAD system, where the first and foremost step is preprocessing and afterwards segmenting the cancerous nodule region. And in the further stage they have used ANN machine learning technique which is being trained by using BFGS algorithm. Adaptive median filtering is being utilized to eliminate the noise present in the image. For enhancing the CT image, contrast limited adaptive histogram equalization (CLAHE) technique is used and for segmentation multilevel thresholding technique is adopted and thus they have achieved the accuracy of 96.7%, sensitivity of 92.1%, specificity of 94.30%. Imran et al. showed a method for segmenting of lung region from CT scan images [4]. They employed Wavelet Packet Frame (WPF) technique to acquire spatial frequency representations and apparently applied k-Means clustering for better segmentation of lung tissues. This proved that the technique is powerful and is able to effectively segment lung regions from numerous images from different scans.
Azar et al. [5] suggested decision support tool for the identification of breast cancer nodules on the basis of three kinds of classifier viz. Single decision tree (SDT), Boosted decision tree (BDT), Decision tree forest. It is found that BDT performance is good as compared to SDT having the accuracy of 98.83% & 97.07% respectively. Li-Hong Xiao et al used Random forest algorithm for the prediction of prostate cancer. Here they combine transrectal ultrasound outputs, age, and serum PSA levels to predict prostate cancer [6]. This model is good for deciding whether invasive biopsy is necessary or not and gives us a more accurate results. The only disadvantage with this method is that it does not take into account all factors that may be useful for prostate cancer diagnosis, such as family history of prostate cancer, digital rectal exam results, and Gleason score. This method gives us an accuracy of 83.10%, sensitivity and specificity of 65.64% and 93.83% respectively, positive predictive value of 86.72% and negative predictive value of 81.64%. Yeh et al. [7] introduced decision-tree prototype as one of the ideal prototype for particularly brain disease with comparision to Bayesian-classifier and back-propogation neural network and it got a tremendously good accuracy of 99.59%. Fan et al. [8] presented a model which is based on hybrid reasoning and fuzzy decision tree (BFDT) for detection of liver disease with an accuracy of 81.6% which is highest among various other models. Ozcift [9] used best first search random forest algorithm and found classification accuracy of 98.9%. Nguyen et al. [10] utilized random forest classification algorithm with feature
selection for diagnosis of breast cancer and achieved a good classification accuracy
Nodule detection in lung using multi-threshold
segmentation
of 99.82%. Polat et al. [11] uses least square SVM with an accuracy of 98.53%. M.F.Akay [12] uses SVM model with grid search and feature selection for the implementation of breast cancer diagnosis and found an accuracy of 99.51%. Sasikala et al. utilizes CNN and deep convolution network approach to detect lung cancer and got an accuracy of 96% and 93% respectively [13]. Fuzzy clustering technique was used by Kanazawa, to figure out the organs which is of interest and also classifies the lung part into two different clusters i.e. air- cluster and various additional organ-cluster [14]. Shin-Chung et al. evolved CNN, to imitate the vision type network in order to identify the lung nodule [15]. Intensity-based detection technique is mainly relying on the belief that the lung nodules have potentially greater intensity as compared to lung parenchyma as well as employ methods like multiple-thresholding [16]; clustering [17]; artificial neural networks (ANN) [18]; and mathematical morphology [19], in order to carefully identify cancerous nodule present in the lung region.
Giger et al. [20] describes the early use of automated 2-D nodule metrics, which incorporates perimeter, area, compactness, and circularity of a nodule. K. Murphy et al. [21] adapted k-nearest-neighbour (KNN) classifier in order to classify benign and malignant tumor. Rati et al. shows various methods of machine learning such as ANN, NBC, KNN, SVM for identifying breast cancer [22]. Aniket et al. [23] describe multiple methods for nodule detection in general. An aspiratory knob is relatively circular molded darkness estimating under 3 centimeters in width encompassed by lung parenchyma. Its shape can be distorted by the neighboring vessels or pleural surface. Four kinds of knobs distinguished by were: all around encircled, the knob is at the center of the lung tissue without being associated with vasculature; vascularized, the knob is at the focal point of the lung documented however is fundamentally associated with the encompassing lung vessels; pleural tail, the knob is situated nearer to the pleural surface associated by a thin structure; juxtra-pleural, a significant bit of the knob is associated by a thin structure.
III. METHODOLOGY
Lung image classification has emerged as a trending area for analyzing the nodule and various other parameters of the human body. The flow chart is shown in fig.1. The image classification process is having a following step,
Image capture
Noise removal and pre-processing Image segmentation
Nodule extraction Nodule description Image classification Disease detection
[image:2.595.332.508.60.257.2]The image procurement stage is of most extreme significance. In this stage, the images are caught from the prostate image catching gadget.
Fig. 1 Flow chart of proposed method
A. Preprocessing
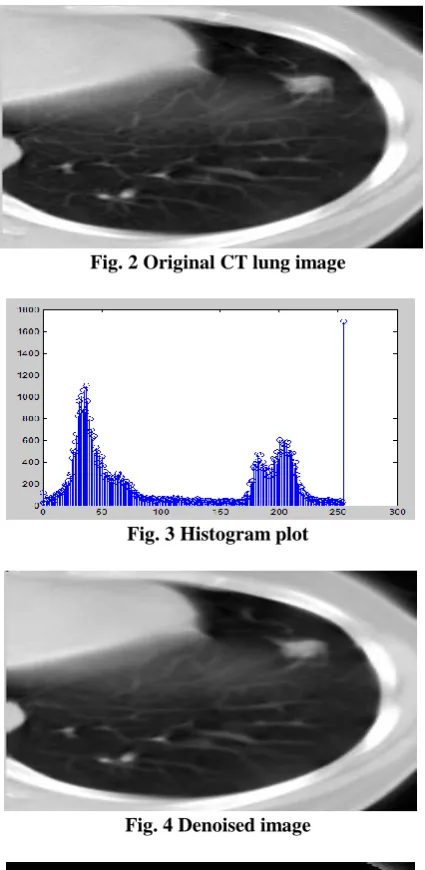
The gained images as shown in Fig. 2 are given to the pre-handling block, where the undesirable commotion from the images is decreased. Lung image catch more often than not adds gaussian clamor to the image, which is evacuated utilizing wiener and averaging filter. The denoised image is shown in Fig. 4. These clamors can cause issues in the division procedure, and must be expelled before any further processing is done on the images.
B. Segmentation
Segmentation is the way towards separating a digital image into numerous locales. The fundamental point of segmentation process is to isolate the object from its background region, so that a distinct set are formed and thus only the object of intrigue will remain. These days, different techniques and algorithms have been created for the segmentation of an image.
Thresholding is a vital approach for image segmentation. In thresholding, the histogram of image can be divided in two classes viz. single value also known as bi-level thresholding and multiple values also known as multiple level thresholding. Hypothetically, there is an increase in the thresholding levels as compared to the quantity of items available in an image, however the calculation burden will likewise be expanded proportionally. Multilevel thresholding is partitioning the histogram of image into a few sets. An image function is characterized in two dimension i.e. f (a, b), where a and b refers spatial coordinates, while the amplitude of f at any pair of co-ordinates (a, b) is known as the image intensity at any particular level. It distinguishes a particular level (a, b) in one item type if Thl < (a, b) <= Th2 and the another item type if f (a, b) > Th2 while the background item type can be distinguish if f (a, b) <= Thl.
Proposed nodule detection approach based on multi-threshold descriptors
Prostate images
Image Preprocessing
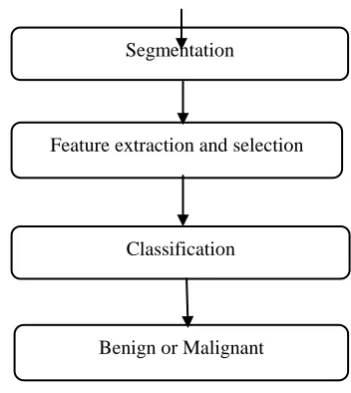
Segmentation
Feature extraction and selection
Classification
International Journal of Innovative Technology and Exploring Engineering (IJITEE) ISSN: 2278-3075, Volume-8 Issue-9, July 2019
The proposed lung nodule detection technique can be described using the following steps:
i. Evaluation of image histogram
In this step, the image histogram is evaluated and the bin values are stored in an array, while the total bins are marked as 'num'.
ii. Background weight calculation
All the 'num' values are given to a background weight calculation block. This block goes through each level of the image and uses the following equation to evaluate the background weight,
, (1) where, w is the weight, i is the bin level and num(i) is the number of bins in the histogram.
iii. Foreground weight calculation
The same equation is used to evaluate the weights for the foreground image, but the image is given to a histogram equalization block before evaluation.
iv. Evaluation of variance
The variance for both the foreground and background weights is calculated to obtain the first image threshold.
v. First level thresholding
The variance of both foreground & background weights is averaged, and if the pixel level is less than this threshold, then it is removed, else it is retained. This removes all the low intensity regions from the image, which is needed to remove the darker cell information from the image.
vi. Morphological enhancement
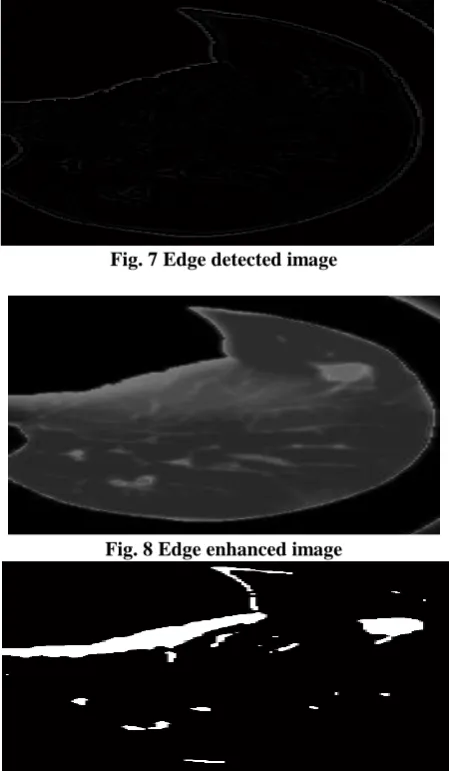
The dark region removed image is given to hole filling and edge enhancement and the morphologically filtered image is shown in Fig. 6. For edge detection, we have used the Laplacian of Gaussian operator and enhance the edges of the image as shown in Fig. 7,8 respectively. This ensures better visibility of the nodule regions.
vii. Re-evaluation of threshold
The enhanced image is again processed using the steps 1 to 4, and another threshold value is obtained.
viii. Second level thresholding
[image:3.595.321.534.48.484.2]In this step, there are 2 thresholds available. One threshold is with the help of background variance, and other is with the help of foreground variance. If the image pixels are between the first and second threshold then it is marked as the nodule region, else the regions are discarded. Once the nodules are detected as shown in Fig. 9 then they are passed through a feature extraction block. This block extracts the morphological features of the image. These features are utilized to train a KNN based classifier. The trained classifier is then evaluated for test images and output classes for disease and non-disease types are found in order to classify the input image.
Fig. 2 Original CT lung image
Fig. 3 Histogram plot
Fig. 4 Denoised image
Fig. 5 Segmented image
Fig. 7 Edge detected image
Fig. 8 Edge enhanced image
Fig. 9 Nodule detected image
C. Feature Extraction and Selection
Subsequently, after performing the segmentation on lung region, the segmented region of nodules is further being utilized for feature extraction. It is the procedure to take out different attributes from an image such as size, shape, circularity, area, perimeter, etc. which separates out the utmost significant properties. The features which we were used in this paper are circularity, area, perimeter.
a) Circularity: It decides the circularity of the item in another words we can say that how nearer the shape of item steps closer to a circle. It is defined by a following formula:
Circularity= (4π* Area)/(perimeter)2 , (2) b) Area: The area is calculated from the segmented part of the tumor, which contains only ‘white’ pixels; that is the pixel having the value ‘1.’ The area of the tumor image is the total number of ‘white’ pixels (1’s) in the image array. It is defined by a following formula:
Area(A) = n{w}, (3) where n{w} represents the number of white pixels in the tumor part.
c) Perimeter: The perimeter of the segmented tumor is calculated from the distance between every adjacent pair of pixels around the boundary of the region. It will be calculated based on the continuous pixels inside the region of interests. Perimeter is computed by means of counting the number of pixels inside the border of the region. If the image contains discontinuous regions, then it returns unexpected results.
Feature extraction is the most significant part of a system. A feature is a huge snippet of data extracted from an image, which gives increasingly nitty gritty comprehension of the image. Fig. 10 and 11 shows the circularity and perimeter graph respectively.
D. Classification
K nearest neighbours or KNN Algorithm is a simple algorithm which utilizes the entire dataset in its training phase. At whatever point another information comes the prediction is necessary for an unobserved information, it will look through the entire training set of data for k-most alikeor likelihood cases and the data with the most alike cases is finally come back as the prediction model. The k-nearest neighbours algorithm uses a very basic approach to perform the classification. For testing a newexample, it will definitely look through the training data which was stored earlier and then finds the k training. The k-nearest neighbours algorithm uses a very basic approach to perform the classification. For testing a new example, it will definitely look through the training data which was stored earlier and then finds the k training examples that are nearest to the new example. Then it will assign the most common class label (among those k-training examples) to the test example for finding the output i.e. prediction.
[image:4.595.306.548.403.713.2]The next section describes the results of the algorithm, followed by some interesting conclusions about the developed algorithm and some future work.
Fig. 10 Circularity vs Area graph of a nodules present in an image
Fig. 11 Perimeter vs Area graph of a nodules present in an image
[image:4.595.307.546.403.546.2]International Journal of Innovative Technology and Exploring Engineering (IJITEE) ISSN: 2278-3075, Volume-8 Issue-9, July 2019
We tested the proposed algorithm on multiple images and checked the accuracy of segmentation by visual analysis. We have used total of 205 CT scan lung images and out of them 107 images are utilized for training and the remaining 98 images are left for the training purpose. The following results were obtained for the images.
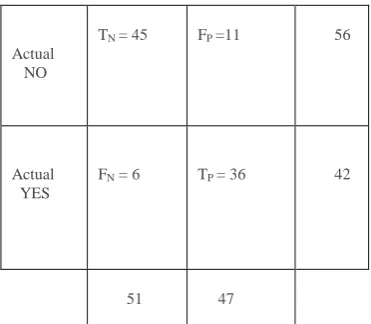
By measuring the percentages of Sensitivity (SE), Specificity (SP) and Accuracy (AC), we can calculate the performance of the classification (KNN) algorithm by using a confusion matrix shown in table 1 and the respective definitions [24] are as follows:
Sensitivity: It is used to test the proportion of people who test positive for the disease among those who have the disease. SE = TP/ (TP+FN) * 100, (5) SE = 36/ (36+6) * 100 = 85.71%
Specificity: It is used to measure the proportion of negatives that are correctly identified.
SP = TN/ (TN+FP) * 100, (6) SP = 45/ (45+11) *100 = 80.35%
Accuracy: It represents how often is the classifier gives correct output. Accuracy is calculated as the number of all correct predictions divided by the total number of the dataset. AC = (TP+TN)/ (TN+TP+FN+FP) * 100, (7) AC = (36+45)/ (45+36+6+11) * 100 = 82.65%
Table 1: Confusion matrix
Predicted NO
Predicted YES
Actual NO
TN = 45 FP =11 56
Actual YES
FN = 6 TP = 36 42
51
47
Whereas the terms TN, TP, FN, FP are having a specific meaning [25].
True positives (TP): In this case, we predict that a particular person is having a disease and in actual also they do have a disease.
True negatives (TN): In this case, we predict that a person doesn’t have a disease and in actual also they don’t have a disease.
False positives (FP): In this case, we predicted that a person is having a disease, but in actual they don't have a disease. (also named as a "Type I error.")
[image:5.595.320.506.48.210.2]False negatives (FN): In this case, we predicted that the person is not having a disease, but in actual they do have a disease. (also named as a "Type II error.")
Table 2: Accuracy, Sensitivity, Specificity evaluation table
Once the detection process is done, we evaluated the images with proper training and testing sets and obtained the classification results as mentioned in table 1. From the results it is clear that for greater accuracy of the system need to increase the number of training and testing images as shown in figure 13. Thus, the recommendation is to use more than 70 images for training and 40 images for testing.
Fig 13. Accuracy evaluation
As it is observed that the trained algorithm produces good level of accuracy and can be used for real time classification of nodules.
V. CONCLUSION
The proposed algorithm is tested under various condition and found to be 82.65% accurate for classifying the nodule using KNN classifier. The sensitivity and specificity of the proposed system is 85.71% and 80.35% respectively. The work may be extended for any of the organ containing nodule in order to assist doctor for various types of nodules related investigation.
REFERENCES
1. Cancer Facts and Figures 2019- American Cancer Society [Online].
TP+FN TN+FP TP+TN TN+TP+FN+FP Accuracy
AC= (TP+TN)/ (TN+TP+FN+FP) * 100
Sensitivity
SE = TP/ (TP+FN) * 100
Specificity
SP =TN/ (TN+FP) * 100
36+6=42 45+11=56 36+45=81 45+36+6+11=98 AC=(81/98)*100
=82.65%
SE=(36/42)*100 = 85.71%
Author-3
oto Author-1
Author-2 Available:https://www.cancer.org/content/dam/cancer-org/research/ca
ncer-facts-and-statistics/annual-cancer-facts-and-figures/2019/cancer -facts-and-figures-2019.pdf
2. Daw-Tung Lin and Chong-Ren Yan, “Lung nodules identification rules extraction with neural fuzzy network,” Proceedings of the 9th International Conference on Neural Information Processing (ICONIP`02), volume 4, 2002.
3. Ashwin S, Arvind Kumar S, Ramesh J, Gunavathi K, “Efficient and reliable lung nodule detection using a neural network based computer aided diagnosis system,” in Emerging Trends in Electrical
Engineering and Energy Management (ICETEEEM), 2012 International Conference 2012:135–142.
4. Imran Fareed Nizami, Saad Ul Hasan, Ibrahim Tariq Javed, “A Wavelet Frames + K-means based Automatic Method for Lung Area Segmentation in Multiple Slices of CT Scan,” 17th IEEE International Multi Topic Conference 2014.
5. Ahmad Taher Azar, Shereen M, El-Metwally, “Decision tree classifiers for automated medical diagnosis,” Neural Computing and Applications, volume 23, no. 7–8, pp. 2387–2403, Dec. 2013. 6. L H Xiao, P R Chen, Z P Gou, Y Z Li, M Li, L C Xiang, Feng, “Prostate
cancer prediction using the random forest algorithm that takes into account transrectal ultrasound findings, age, and serum levels of prostate-specific antigen,” Asian Journal of Andrology, volume 19, no. 5, pp. 586-590, 2017.
7. Duen-Yian Yeh, Ching-Hsue Cheng, Yen-Wen Chen, “A predictive model for cerebrovascular disease using data mining,” Expert Systems with Application, volume 38, no. 7, pp. 8970–8977, July 2011. 8. Chin-Yuan Fan, Pei-Chann Chang, Jyun-Jie Lin, J.C. Hsieh, “A hybrid
model combining case-based reasoning and fuzzy decision tree for medical data classification,” Applied Soft Computing, volume 11, no. 1, pp. 632–644, 2011.
9. Akin Ozcift, “Enhanced Cancer Recognition System Based on Random Forests Feature Elimination Algorithm,” Journal of Medical System, volume 36, no. 4, pp. 2577–2585, May 2011.
10. Cuong Nguyen, Yong Wang, Ha Nam Nguyen, “Random forest classifier combined with feature selection for breast cancer diagnosis and prognostic,” Journal of Biomedical Science and Engineering, volume 6, no. 5, pp. 551–560, 2013.
11. Kemal Polat, Salih Gunes, “Breast cancer diagnosis using least square support vector machine,” Digital Signal Processing, volume 17, no. 4, pp. 694–701, July 2007.
12. Mehmet Fatih Akay, “Support vector machines combined with feature selection for breast cancer diagnosis,” Expert System with Application, volume 36, no. 2, Part 2, pp. 3240–3247, March 2009.
13. S. Sasikala, M. Bharathi, B. Sowmiya, “Lung Cancer Detection and Classification Using Deep CNN,” International Journal of Innovative Technology and Exploring Engineering (IJITEE) ISSN: 2278-3075, Volume-8, Issue-2S, December 2018.
14. K. Kanazawa, Y. Kawata, and N. Niki, “Computer aided diagnosis for pulmonary nodules based on helical CT images,” IEEE Nuclear Science Symposium Conference, 1998
15. Shih Lo, Shyh Lou, Jyh Lin, Matthew Freedman, Minze Chien, and Seong Mun, “Artificial Convolution Neural Network Techniques and Applications for Lung Nodule Detection,” IEEE Transaction on Medical Imaging, volume 14, no. 4, pp.711-718, December 1995. 16. Samuel G. Armato, Maryellen L. Giger, and Heber MacMahon,
“Automated detection of lung nodules in CT scans: Preliminary results,” Medical Physics, volume 28, no. 8, pp. 1552–1561, May 2001.
17. Metin N. Gurcan, Berkman Sahiner, Nicholas Petrick, Heang-Ping Chan, Ella A. Kazerooni, Philip N. Cascade, and Lubomir Hadjiiski, “Lung nodule detection on thoracic computed tomography images: Preliminary evaluation of a computer-aided diagnosis system,” Medical Physics, volume 29, no. 11, pp. 2552–2558, October 2002. 18. Kenji Suzuki, Samuel G. Armato, Feng Li, Shusuke Sone, and Kunio
Doi, “Massive training artificial neural network (MTANN) for reduction of false positives in computerized detection of lung nodules in low-dose computed tomography,” Medical Physics, volume 30, no. 7, pp. 1602–1617, June 2003.
19. Kazuo Awai, Kohei Murao, Akio Ozawa, Masanori Komi, Haruo Hayakawa, Shinichi Hori and Yasumasa Nishimura, “Pulmonary nodules at chest CT: Effect of computer-aided diagnosis on radiologists’ detection performance,” Radiology, volume 230, no. 2, pp. 347–352, February 2004.
20. Maryellen L. Giger, Kyongtae T. Bae, Heber MacMahon, “Computerized detection of pulmonary nodules in computed tomography images,” Investigative Radiology., volume 29, no. 4, pp. 459–465, 1994.
21. Murphy K, van Ginneken B, Schilham AM, de Hoop BJ, Gietama HA, Prokop M, “A large-scale evaluation of automatic pulmonary nodule detection in chest CT using local image features and k-nearest neighbor classification,” Medical Image Analysis, volume 13, no. 5, pp. 757-770, July 2009.
22. Rati Shukla, Vikash Yadav, Parashu Ram Pal, Pankaj Pathak, “Machine Learning Techniques for Detecting and Predicting Breast Cancer,” International Journal of Innovative Technology and Exploring Engineering (IJITEE), ISSN: 2278-3075, Volume-8 Issue-7, May 2019.
23. Aniket Bombale, C.G.Patil, “Segmentation of lung nodule in CT data using k-mean clustering,” International Journal of Electrical, Electronics and Data Communication, ISSN: 2320-2084 volume 5, no. 2, February 2017.
24. Animesh H, Nanigopal B, Avijit M, “Predicting Lung Cancer Survivability using SVM and Logistic Regression Algorithms,” International Journal of Computer Applications (0975 – 8887) volume 174, no. 2, September 2017.
AUTHORS PROFILE
Sakshi Wasnik, received the B. E degree in Electronics and Communication Engineering in the year 2016 and currently pursuing M.Tech in VLSI Design from Shri. Ramdeobaba college of Engineering and Management.
Dr. Pallavi Parlewar, Associate Professor at Shri Ramdeobaba college of Engineering and Management, Nagpur. She received her B.E. degree in Electronics and Telecommunication Engineering in the year 2000. She completed her MTech in VLSI Design in 2006. She has done her Ph.D on “An Explorative study of X-Let Transform for image denoising Applications”, from RTMNU, in March 2013. Her field of interest is image processing. She has published 1 paper in International Conference and 1 in International Journal.