International Journal of Innovative Technology and Exploring Engineering (IJITEE) ISSN: 2278-3075, Volume-8 Issue-9, July, 2019
Abstract: Inventory management is a growing topic of concern and better software support is lacking for customers. All existing software applications that exist are expensive and thus can only be used by rich retail stores. There is no app that is powerful yet simplistic enough for anyone and everyone. To implement a project such as this it is important to understand the target audience; the human mind that lives and breathes through us. This project is based on concepts from behavioral economics about the human mind. Research sheds light on the topic of behavioral economics and how the different factors in different situations change how a customer perceives a situation which includes multiple decisions. One of the most important cases of behavioral modeling is to study and understand the rational mind. This project implements the module that deals with the case of a rational mind. A rational mind is one that makes decisions that always give the maximum output and benefit and reaps the best results. Behavioral economics also gives an insight on other cases such as uncertainty, prospect theory, temporal dimensions, social dimensions and ethics. Uncertainty is a case where the user cannot make up their mind about a choice. Prospect theory is how a simple, single question asked in two different perspectives can make the buyer pick another option. Temporal dimensions deal with how time plays a huge role in the choices a user makes and how the decisions depend on future events as well as present. Social dimensions include social norms and trust, dishonesty and such factors of a human mind that play a huge role while buying something. Lastly, ethics play a huge role on how a human mind perceives a situation. To implement another module of this, a smaller section of the temporal dimension, machine learning was studied. The main module that deals with the rational mind making rational choices was implemented. Before implemented, following the software development life cycle the design of the architecture was done and analysis of how the application will react to the user was conducted. Then all the nonfunctional requirements were defined, and the functional requirements were set. The algorithm to implement the project was developed to begin the implementation life cycle. A survey of two hundred people was conducted to be able to define defaults. The survey shed light on different sections of the module such as time interval for buying distinctly quantifiable items, like grains and pulses, and monthly expenditure. The module for a segment for future work including machine learning was generated. In conclusion, the project successfully deals with the rational mind and the rational choices. Behavioral modeling and predictive modeling play a huge role in this case and there is still more scope of adding more modules to this project to improve it.
Revised Manuscript Received on July 05, 2019
Prof. Rakhee Kundu, Computer Engg., NMIMS University/Mukesh Patel School Of Technology Management and Engineering, Vileparle, India Rohan Verma, Computer Engg., NMIMS University/Mukesh Patel School Of Technology Management and Engineering, Vileparle, India
Maharath Sinha, Computer Engg., NMIMS University/Mukesh Patel School Of Technology Management and Engineering, Vileparle, India
Shreyas Singhvi, Computer Engg., NMIMS University/Mukesh Patel School Of Technology Management and Engineering, Vileparle, India
Index Terms: Behavioural Modelling, Behavioural Economics, Prediction, Stock Maintenance.
I. INTRODUCTION 1.Introduction
In today’s age where people do not have time for breathing in their rushed lifestyles and in this rush, they always forget about picking things that they need during shopping for essentials. Grocery shopping is a key activity in maintaining a healthy life as all the essentials are required for sustenance; essentials such as soap, rice, salt, sugar, oils and many more absolute requirements. Thus, in this hasty life, stock maintenance becomes a major issue. Software applications to combat this issue exists, however these applications are costly and thus can only be afforded by major retailers for the benefit of their own stores for stock calibration and removing shopping lag between customer requirements and availabilities. This project tackles the aspect of expensive stock management. Having a personalized stock maintenance is much more beneficial than having a generalized version of the same concept. Taking into consideration one of the biggest retailers in the world, Amazon. When a customer purchases and item on Amazon, he or she gets recommended for similar items based on what other people who bought that same item also buy. Coming into the groceries and food market, the choices of one person depends maximum on their family and their own. It does not matter what another person eats or buys. Thus, giving birth to the importance of having a personalized software support. Having such a personalized software support reduces waste, increases profits for vendors, brings in the factor of how a person thinks and deals with multiple cases of behavioral economics to provide the apt support. This project deals with a module of behavioral economics: rational mind. A rational mind is one which, all the decisions made during shopping are made for the optimum output and optimum results. Optimum results can be attributes like lowest prices and longest lasting stock. However, this project is made with the goal of extensibility in mind. Other modules of behavioral modelling can be implemented, and the project will be updated with the new modules. This proves the application is flexible and adaptable to change. In a world where every market is changing every day, it is difficult to pinpoint on a single solution and bring stability, but this project comes closest to easier maintenance and flatlining changes and reducing variance.
All the future modules deal with issues such as weather, season, timed discounts and many more cases of behavioural economics.
II. DATA AND INFORMATION REQUIRED
Ration Guru: Implementation of an Advance
Method to Simplified Stocking
A. Experimental Data Used
As this project strays into the topic of behavioural economics, we conducted a survey using Google Forms. The questions asked were general and void of specifications to be able to cover a huge demographic of people. The survey was conducted to be able to infer the default values for the starting clusters of the application. The survey was conducted in order to find the averages of the most quantifiable entities of a household. Items like rice, pulses and oil are bought at regular intervals and these intervals do not usually change over a long period of time. This would help us to identify the clusters for the average date of buying.
The default values inferred allowed the module implementation of the rational mind to be able to provide some prediction even with few data entries.
B. Behavioural Economics Research conducted to specify methods for modules.
This application was conjured based on idea of implementing machine learning as the sole support for the functionalities provided by the system. However, studying a human mind for this domain and industry this application belongs was of utmost importance and a necessity. This project steps one foot into the boat of predictive modeling and one foot into the boat of behavioral economics. Behavioral economics studies the effects of psychological, cognitive, emotional, cultural and social factors on the economic decisions of individuals and institutions and how those decisions vary from those implied by classical theory [1]. In behavioral economics, models of systematic imperfections are applied to all sectors of life including human rationality, the engineering and construction of organizations and the societies within them, the markets that rule the economy and each policy that affects this market [2]. The study of individual differences is also important in understanding how social interactions and economic aggregation minimizes the effects of rationality limits [2]. The behavioral economics approached is in juncture with the “as if” approach endorsed by Milton Friedman. Milton’s “F-twist” argument lists two distinct criteria for this approach: I. Theories should not be judged by the accuracy of their predictions;
II. Theories should not be judged by the accuracy of their assumption.
This brings us to the case of choices of a user. In statistics, an outlier is defined as an observation point in a data set that is distant from other observations in the same data set [3][4]. A user’s mind falls under multiple categories of decision-making thought processes leading to outliers in a consistent dataset. Considering a large dataset of values collected over a long period of time, many observations that would be otherwise considered as outliers may be rendered irrelevant to the rest of the data clusters in the data store.
Uncertainty: A human mind begins with the most common decision-making process; not being able to make one. Uncertainty is a stage when the user is stuck in between either two or more choices or no choices at all. Being stuck in the state of indecisiveness among multiple choices can mean that there are more choices to pick from than what the user can comprehend and the pros of one outweigh the cons of the other and the pros of that outweigh the cons of another. This
condition falls into a circle of decision hopping and the user is never able to reach a certainty. The other half of this where there are no choices have two clauses; one - there are too many choices and none of them are up to the level of requirement for the user, however the user is forced to pick one; two – there are literally no choices at all, an absolute lack of choices to choose from [5]. In the case of uncertainty, the two of the most probable outcomes of the situation are either the user goes with the default option provided or chooses none [6].
Rational Choice: In a perfect world, defaults, frames [7], and price anchors would have no bearing on consumer decisions. Our choices would be the result of carefully weighing of costs and benefits and being informed by existing preferences. We would always end up making optimal and idealistic decisions [8]. Several ideas known as the pillars of so-called ‘rational choice’ theory was outlined by the renowned economist Gary S. Becker in the 1976 book The Economic Approach to Human Behavior. This theory assumes that humans have a set of stable rigid preferences and tend to engage in maximizing behaviour.
Prospect Theory: Prospect theory proposed by the extensive and detailed work of Amos Tversky and Daniel Kahneman shows that decisions are not always ideal or optimal. The willingness of a consumer to take a risk is influenced by the way the choices are framed [7] [9]. For example, framing this one decision question in two ways makes a big difference in perceiving the choice:
1. a. A certain win of Rs. 2,500, versus
b. A 25% chance to win Rs. 10,000 and a 75% chance to win nothing?
2. a. A certain loss of Rs. 7,500, versus
b. A 75% chance to lose Rs. 10,000 and a 25% chance to lose nothing?
Giving something up is more painful than receiving something small. Thus, when questions are posed as the first question, people will most likely choose the riskless option of choice “a” while on the other hand, when posed with question two, they would rather choose the riskier choice “b” because it diminishes loss.
Temporal Dimensions: One of the most important domains of behavioral economics is the presence of the time dimension and its effect on human evaluations and preferences. A user decides their choices depending on the two requirements, that is, need and effective cost. These two dimensions alone are invariant of each other and independent.
An optimal choice would be low cost and high need, however just because the cost of an item is low does not mean the need for that item is high or vice versa. Thus, incentivizing a purchase based on cost gives low outcome of revenue for vendors. However, adding a third dimension, time, brings in the inter dependability between cost and need.
Time discounting and Present Bias: As stated by Fredrick and Lowenstein in their paper in 1999; according to time-discounting policies,
International Journal of Innovative Technology and Exploring Engineering (IJITEE) ISSN: 2278-3075, Volume-8 Issue-9, July, 2019
Discounting is a non-linear domain under time and has inconsistency in its propagation rate over time. The value of events that are farther in the future falls more slowly than those closer to the present [11]. People will choose cost over need in a time of considerable discount. This leads to un-prioritized expenditure. Psychology plays a huge role here, when an item that is expensive and not very high on the priority of need list goes on a major discount, the mind believes that the cost drop causes an increase in the need requirement.
Forecasting and memory: A question that pops up in a buyers mind during the process of making a decision to buy an item is in general terms, “It is available, but I do not need it now; what if in the future I need it and it is unavailable at that time?” When we make plans for the near or far future, we tend to be over-optimistic because of the sheer amount of time that lies in front of us. For example, if not everyone, a majority of people commit the planning fallacy by simply underestimating how long it will take us to complete a given task and ignoring past experiences and data that might prove a different timeline [12].
Social Dimensions: Contrary to the homo economicus view of human motivation and decision making, behavioral economics does not assume that humans make choices in isolation, or to serve their own interest. Aside from cognitive and affective (emotional) dimensions, an important area of BE also considers social forces, in that decisions are made by individuals who are shaped by—and embedded in—social environments [13].
Trust and dishonesty: Trust, which is one of the explanations for discrepancies between actual exhibited behavior and that predicted by a behavioral model of self-interested and self-promoting actors in an environment, makes social life possible and permeates economic relationships. It has been related to positive economic outcomes, such as macro-level economic growth [14] and micro-level intrinsic motivation and work performance [15].
Social norms: The sociologist Alvin Gouldner referred to reciprocity as a “generalized moral norm” [16]. Social norms are implicit or explicit behavioral expectations or rules within a society or group of people, and they are an important component of identity economics, which considers economic actions to be the result of both monetary incentives and people’s self-concepts. Our preferences are not simply a matter of basic tastes; they are also influenced by norms, as manifested in gender roles, for example.
Consistency and commitment: Humans are susceptible to choosing based on feedback. The better the feedback is, the more inclined the user is to decide to buy that choice. When the outcome of an action threatens this desire, we may change our behavior, though we often simply change our attitudes or beliefs. When this happens, we usually resort to ‘rationalization’, which is a form of cognitive dissonance reduction [17].
Ethical issues: Ethics play a major role in the topic of behavioral economics. When it comes to brand activity, the effect of the brands actions in social media and real life plays a huge role on how their customers perceive the brand. If the company endorses a social identity that not all customers agree with, they tend stray away from the brand. Sometimes a controversy causes the users to cause movements like boycotting of the whole brand itself and some of its products if not all. Other times controversies cause brands to pull out
selling their products to certain markets due to social or political reasons.
III. SOFTWARE REQUIREMENT SPECIFICATIONS i. Non-functional requirements
a.Processing Chip of minimum: Snapdragon 420 b.RAM: 1GB
c.Android running version: KitKat 4.0 or above (Android SDK version: 18 or above)
d.Internet connection of minimum 512Kbps for stable database updating
ii.Functional requirements
Following the Software Development Life Cycle, in the planning phase analysis of the requirements of the users was conducted. It was decided that during development, simplicity must be emphasized. Once all the requirement analysis was complete, the requirements were then set and defined.
The requirements were defined as:
A.Customers and vendors must be provided with software support for their stocking decisions with the help of an estimate on usage and their buying patterns related with the current stock present.
B.The inventory management should be powerful enough to bring stability to household maintenance.
Assessment parameters for functional requirements: A. Analysis:
The project is based on the concepts of behavioral modeling and machine learning. Analysis of the application running, and the database set up for the app is very necessary to understand how it acts and reacts to the user conditions. Since the application requirement states that it be personalized and does not take into consideration the usage of another customer, analysis becomes even more important. It is a key parameter to decide the requirements and to be able to set the requirement definitions to prevent pushbacks in the software development life cycle. In the life cycle, analysis also plays a role that helps decide how the developer decides to choose the method of implementation. While in the software development life cycle, the testing phase not only requires there be a minimum amount of analysis created but also there be accurate analysis of the results done. The application deals with multiple cases of outliers.
These outliers are sometimes difficult to classify as either, in fact, outliers or irrelevant data entities or observations. The analysis of and ideal condition in a control environment determines how the application deals with outliers during the tenure of running. Since the application must be independent of how the user uses the app, it is important to analyze all the risks and chances of failure. Analysis will allow the development process to include cases of error correction, fault tolerance and maintainability.
In the development process, once all the requirements are taken, the definitions are created. Once the requirement definitions are listed, they cannot be reiterated and changed during the same iteration of the process and must wait till the next iteration. Before changing the requirement definitions again, it is of utmost importance to analyze the change in requirements. As the requirements of the application software keep changing, it might become more difficult to construct a new software design. Thus, constructability is a major requirement assessment parameter for functional requirements. If the requirements changed after an iteration cause the coding process of the application to go backwards, the constructability is reduced as, for the new iteration, future code already exists which might not be needed and might only cause hindrance to the development of the application with respects to the new requirement. Another case stands where the development under coding of the application may be too difficult given in the time frame and by the time the first iteration is over, the requirements are updated, the application will not be carried on as the construction itself has not been completed of the first iteration.
C. Cost Estimation:
Every development process has its own budget for development. This project however had no monetary budget for its development process but instead its cost estimation can be calculated in terms of time. The cost of this project including its six-month research period adds up to 9 months for full development cycle and 3 months per individual life cycle. The cost estimation of a project can be calculated by either the deriving the function point cost by calculating the number of lines or using the bulk code to understand its true cost.
D. Extensibility:
This project is based on heavily on the concepts of the human mind from behavioral modeling. Extensibility defines the ability to be extended or stretched. The behavioral economics deciphered postulate the fact that the human mind is not a quantizable entity and changes now and then. To implement all modules of behavioral economics, the project must be highly extensible and must be allowed modification. Take into consideration season fruits. The application must not predict for item out of stock out of season. To implement this module the project must adhere to change and be able to adapt to the new updates. Extensibility speaks in large also about the flexibility and the adaptability of the project. A project that is flexible and adaptable not only has higher fault tolerance but also more stability. Being an extensible project, modules can be added or removed as when desired. Adding modules will make the application heavier in terms of physical size and processing size. More the data, more the time for each process to complete. This means that the project, while being extensible must also not lose on its optimization and processing speed.
E. Functionality:
Functionality of a project defines how that specific project is suited for its practical purpose. This project must be functional as it is made for everyday customers. The main goal of technology is to improve the lives of people who use and not the opposite. The project must be functional to be of use to every person in the target audience. It should fit their needs and requirements. Practicality plays a huge role in
determining the functionality of the project. This project is functional as it removes a monotonous task that everyone does at some point or the other and replaces with a more permanent solution to the issue. This project not only acts as a check list but also as a personal reminder.
F. Maintainability:
Maintain a project is important to how the project deals and is dealt with over time. There must be enough support to maintain and update the app. Everything decays over time. Databases get heavier and larger, process become slower, the hardware begins to deteriorate. Maintenance becomes a key factor in the usage of the application. There should be updates to improving the databases and the process inside the app as when they seem possible. After user interaction, any kind of inputs can be expected, and all failures must be dealt with. Crashes and critical failures must be checked, resolved and relaunched. The application must go under maintenance to deal with redundancies and irrelevance.
G. Software Usage:
The software usage functional requirement is an important metric in the improvement of the application. It will help in improvement of the application and the project over all. Software usage includes analytics of user engagement, performance, module integration, optimization. Software usage is like a gauge to understand how to improve underperforming sections of an application and how to make the application better. It also deals with the legal section of the rights of the user while using the application and help analytics expand their understanding of all components of the project to make it work in unison.
IV. DESCRIPTION OF ALGORITHMS USED
A.Database Implementation:
For implementation of this project we used the mobile and web application called Firebase. It was developed by Firebase in 2011 and acquire by Google in 2014. Now owned by Google, it has many functions that help in projects like the one at hand.
Firebase is comprehensive mobile development platform. Firebase has the following services that are of importance to this application.
Realtime Database (Firestore):
The real time database provided by Firebase is known as Cloud Firestore. Although this database was released as a Beta version for use, it is powerful enough to perform all the functions for the requirements of this application. This application puts to use the Firestore for all its functions. As Firestore is real time, it removes the dependability on the application timestamps and uses the server’s timestamps instead.
International Journal of Innovative Technology and Exploring Engineering (IJITEE) ISSN: 2278-3075, Volume-8 Issue-9, July, 2019
structure of Collections and Documents. A Collection is defined as multiple Documents. A Collection cannot store data. Thus, to store data, Documents are used. Each Document has Fields. These fields are of different data types and can be used to store actual data. The fields are of types Number, String, Timestamp and many more as such. However, for this project we only required the use of the three fields. The advantage of using Firestore is the interconnectivity of Documents and Collections. A collection can store as many as desired documents within it. This is powered by documents as a document is what stores the actual data. Not only does the document save a data, it can also collections within it. This gives the database a tree structure. A tree structure is very powerful for hierarchical storage of data. The key part of Firestore is the absence of the usage of a Structure Query Language. Retrieval works without the use of dull SQL as it is based on NoSQL database. The path to each node is saved as a string. Each collection and each document have its own unique name or identification. Similar to a Windows file path, this database has its own file path which is made up of the names of each layer it has traversed to reach that specific node.
When searching through the database, it uses the path to search making it an optimized search and a shallow search. Instead of traversing each node and leaf of each branch, it optimizes its search by doing selective search and this procuring results in a smaller time frame.
To make the database personalized and per app, Firestore comes with a powerful integration of Firebase Authorization. This authorization factor enables users to use their own personal database with the use of their Google or Facebook account. Authorization not only makes the application personalized to the user and that user only by removing its link from other users. The limelight goes to Firestore where every personal database can be all stored under one database making maintainability easier and the database more powerful. The Firebase Authorization is a simple console that sits as a thin layer between the application and the database. To use authorization, each account created is set with its own and only its own document inside the parent collection. This parent collection is the data base of all the users in essence and each account bound document inside is each account’s own database. Making documents account bound not only take care of fault tolerance in the case of a crash or network loss but also help in retrieval.
B.Predicted date implementation:
The application provides a reminder as a notification for the user to be reminded about the upcoming end of stocks. This reminder is based on the average time gap of buying an item. The prediction algorithm was devised on simple mathematics of averaging.
Module for prediction of stock ending:
i. The last timestamp of the date bought, and the new timestamp of buying is used to calculate the new time interval for buying that specific item. The difference of days of the new timestamp and the older one is saved as a value. ii. This value is then added to the previously calculated total
time intervals. This is now the new total interval time.
iii. A counter is used to count the number of times the user has purchased that item. Upon buying again, along with the timestamp being updated, the counter value is also increased. iv. The new total interval time is divided by the new counter to find the new average days. The longer the app is used, a greater number of entries there are, the more stable is the average date.
v. The new average time gap calculated is added to the updated timestamp received from the server. This is used to predict the end date of the stock or the next time the user might need to buy the item.
vi. While calculating the new time interval, if the interval is a much different value as compared to the already saved average days, it is considered as and outlier and depending on a suitable condition it may be excluded from the average days and used solely used to calculate the next date of buying. vii. The next entry after the outlier must fall under the condition
of being near the average number to be counted into that value for prediction.
viii. If the number of outliers begin increasing, the new average is decided by the cluster created by the outliers.
C.Application Implementation:
The end user application was implemented on Android. Android is light and Firebase is integrated within Android Studio, thus making the application development smooth.
The user interface was designed with the main goal of keeping it simple and straightforward for the user to interact with. Google Material Design promotes simplicity and provides powerful user interfaces when coded in android studio.
The application must integrate Fireabase and the User Interface to seem like one whole application.
i. Each item has its path saved with it in a variable.
ii. When the user adds to cart, the item along with its path is moved to the cart.
iii. iv. v.
vi. Upon checkout, the path is followed and the data in the database is updated.
vii. After checkout the cart is cleared for the next use.
The prediction dashboard must be simple and easy to understand. Accessibility is very important and must be prioritized.
i.
The items closest to their deadlines should be brought up first in order of days remaining.ii.
The user should be able to view all of the other item’s days remaining as well.This leads to many modules yet to be implemented as an integration with the application; for instance, the module that deals with drastic changes and outliers. This module itself deals with cluster changes and makes sure the bedrock of the project is stable. A rational mind is extremely rare to find, many circumstances and events in real life prevent anyone from reaching an absolutely
module that deals with such outliers and cluster shifts. The algorithm for that is implemented here and has to be added as a module to existing module. It uses K-nearest neighbors for calculating outliers and cluster shifts. The classification algorithm allows the application to differentiate between a cluster shit and an outlier.
K-nearest neighbors for outliers:
i. K-nearest neighbors classification algorithm is used to complete the next step of deciding the average days. The k-nn algorithm classifies clusters in a given data set.
ii. The k-nn algorithm is similar to the previous averaging algorithm because just like the average days being calculated, the k-nn classification algorithm separates out clusters using the sample mean per cluster. Each item is put into a segregated cluster by calculating the Euclidean distance of that new observation to all the present clusters previously made from the algorithm.
iii. The previous algorithm and this K-nn algorithm is used in cohesion to set the time interval or time gap. The most updated cluster is used as the current cluster for buying. The sample mean of that cluster is sent to the previous algorithm to update its own average days for predicting the next time the item needs to be bought.
iv. The last recorded observation that goes into a cluster, makes that cluster the active cluster. A threshold for the number of observations per cluster is set. Below this number, the cluster should not be considered.
v. The sample mean of the active cluster is used as the average interval for that item.
This algorithm takes care of the second module of the application. As mentioned earlier, it is important to study cluster shifting in behavioral economics. An active cluster is one in which the last observation recorded was classified into. When multiple outliers begin to be recorded and start forming their own cluster, that means a new cluster created becomes the active cluster.
V. DISCUSSION ON RESULTS
The project was devised to bring out the product of behavioral modeling and machine leaning to make a personalized support for households.
A survey was conducted to be able to infer the default values for the starting clusters of the application. The survey was conducted in order to find the averages of the most quantifiable entities of a household. Items like rice, pulses and oil are bought at regular intervals and these intervals do not usually change over a long period of time. This would help us to identify the clusters for the average date of buying. The default values inferred allowed the module implementation of the rational mind to be able to provide some prediction even with few data entries.
The clusters set will get modified with use, but the application gets a starting point. A total of 200 responses were recorded per question. To begin the survey and be able to classify clusters, the family size or the size of the group that buys the groceries was important. A larger family size will have a lower or smaller time gap per shop. To quantify the time gap, we needed time interval per unit. However, since this project was made to be personalized, this segment of the survey forms
[image:6.595.336.481.194.257.2]a part of a module that has yet to be implemented. In this case, a family size steps into multiple puddles of behavioral economics. A family consists of more than one human being, which means multiple different mindsets that define how the entire family buys their groceries. Different people in one family might follow different meal plans. Sometimes members might not stay at home but come back home once a moth or irregularly thus changing buying patterns. In Fig 1 we see the average family sizes and can correlate their shopping habits based on that.
Fig 1. Survey response on family size
The average days per item per customer was required to set the default clusters for the items. The module implemented takes into consideration the default clusters as the machine learning algoritm was and seto default clusters to begin clustering with the new inputs. Each input adds itself into the default cluster. The clusters decided provide only the sample mean of that cluster and give the average date for prediction. The clusters in essence are not complete clusters as only the important part of the cluster is the sample mean.
The sample mean is calculated by finding mean of the cluster. Every new obseervation and input that is added to a new cluster needs to first find its cluster by calculating the eucledian distance of that observation to the sample mean of each cluster. The shortest eucledian distance decided the cluster that the observation is put into.
Fig 2.a Survey response on time interval for buying grains and pulses
International Journal of Innovative Technology and Exploring Engineering (IJITEE) ISSN: 2278-3075, Volume-8 Issue-9, July, 2019
Fig 2.b Clusters of average intervals for all responses on cooking oil
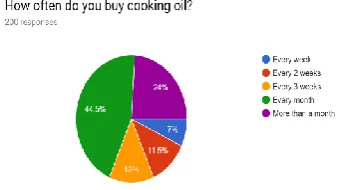
Since this application was to be set for an Indian market, we considered all foods cooked in a certain type of oil. Oil is a distinctly quantifiable item as buying patterns in oil do not show irregularity unless in case of extreme outliers. The two hundred responses were plotted given the
Fig 3.a Survey response on time interval for buying cooking oil
[image:7.595.54.282.54.162.2]Similarly, Fig 3.2 shows the clusters of the average interval days for buying cooking oil per response.
Fig 3.b Clusters of average intervals for all responses on cooking oil
Behavioral modeling suggests that the human mind is never in a constant thought space and thus buying options and choices change with it. The diet plan, a family or person follows, defines what kind of food they buy and eat. A diet plan for losing weigh decides the specific kind of food items that they buy. For instance, more healthy food items like grains, pulses, vegetables and less junk food items. For gaining weight or muscle, a person would normally follow a diet plan that includes a high intake of proteins and fibers and at the same time high amount of carbohydrates. Not all foods provide high carbohydrates and proteins at the same time.
Fig 4. Survey response on family diet plan
[image:7.595.66.236.258.353.2]Every household has at least a maximum budget however high it may be. From Fig 5, the survey told us that more than half, about fifty-six percent people tend to spend more than five thousand rupees a month on groceries, other thirty-seven percent spend between two thousand and five thousand and the rest spend on an average below two thousand.
Fig 5. Survey response on monthly expenditure
VI. CONCLUSION AND FUTURE SCOPE
The project successfully deals with an important case of behavioral economics. The rational mind; the mind with the thought process that always decides to go for the optimal solution to any situation and relate that to past experiences and learn from it. Providing close to perfect predictions is key to this module. It does not take into consideration the presence of outliers and deals with distinct intervals and stable household inventory management.
Firebase Analytics and Firebase Authorization is a module that necessary for the running of this application and to be able to maintain one database and concurrent users of that single database having their own databases within it.
Analytics play a major role in implementation of an application that is based on behavioral modeling. Analytics not only allow the developers to understand their app better but also understand their user inputs and fine tune it to those requirements. A huge part of Firebase Analytics is called Crashlytics. This console allows the administrators to be notified of crashes as a result of real time reporting. This console adds another layer to the already strong Firebase console. In case of multiple issues causing crashes, Crashlytics analyze and help
[image:7.595.53.271.422.545.2]Author-1 Photo crashes are notified and marked important to analyze the risk
of repeated failure. Firebase’s Performance Monitoring console also maximize and optimize the application to use the least amount of resources and run the smoothest
As behavioral economics has multiple cases that require their own methods to deal with, implementing all the different modules should be considered future work. Some of the modules are:
Season shifts: Take into consideration a fruit like mango. The user uses this application and buys mangos for over 3 months and teaches the application the users buying interval. Now, the season shifts from summer to fall when mangoes are no longer available. It will be incorrect to keep reminding the user that their mango stock is almost over. Thus, to implement this module, there has to be clustering and classification applied to the database. Having it integrated with the current online market also will help the application deal with this case easier.
Time discounts: Sometimes it is observed that during a major national holiday, retailers give out large discounts to entice customers to come out and buy items. These timely discounts might cause incorrect prediction as this will have a drastic change in cluster shifting. Sometimes these sales for over a week and sometimes go on to last a whole month. When this last for so long, it will make the application learn about the discount buying pattern. But when the sale ends, suddenly the patterns will be drastically changed and no gradual change. Temporal Dimensions: Temporal dimension is the dimension where time is a factor. The application should be able to predict based on the time of the year or month. The next step to add betterment for dealing with temporal dimensions is integrating weather into the application. It will be able to alert the user of incoming weather issues and restocking.
The human mind is a complex entity and takes a very long time to study and learn about. This project gets better with more use from the user. The more the user uses it, it learns about the user and makes itself better for the user. There still lies a lot of research remaining to be done to make this project perfect. It is important to make sense of available knowledge about the brain we have now in this domain and conduct more research to study more.
REFERENCES
1. Lin, Tom C. W. (16 April 2012). "A Behavioral Framework for Securities Risk". Seattle University Law Review.
2. Camerer, Colin. (2005). Behavioral Economics.
3. Grubbs, F. E. (February 1969). "Procedures for detecting outlying observations in samples". Technometrics. 11 (1): 1–21. doi:10.1080/00401706.1969.10490657. “An outlying observation, or "outlier," is one that appears to deviate markedly from other members of the sample in which it occurs.”
4. Maddala, G. S. (1992). "Outliers". Introduction to Econometrics (2nd ed.). New York: MacMillan. pp. 88–96 [p. 89]. ISBN 978-0-02-374545-4. “An outlier is an observation that is far removed from the rest of the observations.”
5. Ajzen, I. (1991). The theory of planned behavior. Organizational Behavior and Human Decision Processes, 50, 179-211.
6. Goldstein, D. G., Johnson, E. J., Herrman, A., & Heitmann, M. (2008). Nudge your customers toward better choices. Harvard Business Review, 86, 99-105.
7. Tversky, A., & Kahneman, D. (1981). The Framing of Decisions and the Psychology of Choice. Science, 211 (4481), 453-458.
8. Kahneman, D. (2011). Thinking, fast and slow. London: Allen Lane. 9. Kahneman, D., & Tversky, A. (1979). Prospect theory: An analysis of
decision under risk. Econometrica, 47, 263-291.
10. Frederick, S., & Loewenstein, G. (1999). Hedonic adaptation. In D. Kahneman, E. Diener, & N. Schwarz (Eds.), Well-being: The foundations of hedonic psychology (pp. 302-329). New York: Russell Sage Foundation.
11. Laibson, D. (1997) “Golden eggs and hyperbolic discounting”, Quarterly Journal of Economics, 112, 443-477.
12. Kahneman, D. (2011) “Thinking, fast and slow”, London: Allen Lane. 13. Alain Samson, PhD. (2014) “Behavioral Economics Guide 2014”,
[Internet]
https://www.behavioraleconomics.com/resources/introduction-behavi oral-economics/
14. Zak, P. J., & Knack, S. (2001). Trust and growth. Economic Journal, 111, 295-321.
15. Falk, A., & Kosfeld, M. (2006). The hidden costs of control. American Economic Review, 96, 1611–1630.
16. Gouldner, A. W. (1960). The norm of reciprocity: A preliminary statement. American Sociological Review, 25(2), 161-178.
17. Festinger, L. (1957). A theory of cognitive dissonance. Stanford: Stanford University Press.
18. Kapil Bakshi, Kiran Bakshi ," Considerations for Artificial Intelligence and Machine Learning: Approaches and Use Cases ".
AUTHORSPROFILE
Rakhee Kundu is currently Assistant Professor at Narsee Monjee Institute of Management Studies University in Mukesh Patel School of Technology Management and Engineering in the department of Computer Engineering. She has more than 9 years of Academic Experience. She has received her B.E Degree in Computer Engineering in the year 2011 from University of Mumbai, her M.E degree in the year 2014 from University of Mumbai. She is currently Pursuing her Ph. D in Computer Engineering form Amity University. Her current research interests are Deep learning, Machine Learning, Software testing, IOT, Cloud Computing, Fog Computing. She is a life time member of Indian Society of Technical Education