Towards Understanding Cloud Usage through Resource
Allocation Analysis on XSEDE
Hyungro Lee
Indiana University 2719 10th Street Bloomington, Indiana, U.S.A.
Gregor von Laszewski
∗Indiana University 2719 10th Street Bloomington, Indiana, U.S.A.
[email protected]
Fugang Wang
Indiana University 2719 10th Street Bloomington, Indiana, U.S.A.
Geoffrey C. Fox
Indiana University 2719 10th Street Bloomington, Indiana, U.S.A.
ABSTRACT
In shared resource environments, usage data is necessary to identify utilization of the infrastructure by users. Many cloud platforms recently started to collect measurements for use of resources that can be applied to billing and moni-toring. Understanding utilization and performance through these measurements is crucial in the infrastructure in order to provide better cloud provisioning, system management and capacity planning. In this paper, we present an inte-grated cloud accounting solution on XSEDE, Cloud Metrics, to measure cloud resource usage across several cloud plat-forms such as OpenStack, Nimbus, and Eucalyptus. The usage data allows a user to see as how all resources are efficiently supplied to their applications and discover pat-terns from cumulative data. With Cloud Metrics, virtual resources such as compute, storage and network are mea-sured to evaluate time and cost of user applications and the statistics for these resources offer visibility to utilization of XSEDE cloud resources. This article shows statistical anal-ysis of several case studies by tracing resource allocation on FutureGrid as XSEDE resources. Based on the observation on FutureGrid, we found that different patterns between sci-entific research projects and educational projects regarding the type of virtual machines (VMs) and the patterns of using virtual resources. Cloud Metrics enables users and project leaders to identify utilization and performance on XSEDE.
Categories and Subject Descriptors
H.4 [Information Systems Applications]: Miscellaneous; D.2.8 [Software Engineering]: Metrics—complexity
mea-∗Corresponding Author.
sures, performance measures
General Terms
Measurement, Performance
Keywords
XSEDE, Cloud Metrics, FutureGrid, Resource monitoring, cloud accounting, metering
1.
INTRODUCTION
1.1
Background
In distributed systems and HPC, resource usage are typi-cally monitored to detect any hardware and software issues. Real-time monitoring applications help provide sustain and consistent services and engage performance of their system. Distributed systems were built with complex hardwares and require to incorporate with various hardwares such as router, switch, network, and servers along with computing resources like cpu, memory and disk. In Cloud Computing, people have attention to monitoring and accounting systems in vir-tualized environments, so that they can measure resource consumption which is what they are paying for on the on-demand service, cloud computing.
is important to satisfy service-level agreements (SLAs) and improve the system administration, however in a virtualized environment, measuring shared resources is not an easy task since they are in multiple points and different layers.
1.2
Real Consumption vs Allocation
There are two types of measuring resource usage on the cloud. Like a conventional monitoring, resource consump-tion on the cloud is based on current usage data for cpu, memory, network and disk traffics. These are dynamically changing according to traffics, and are important to vali-date system health frequently. The other type of measur-ing resource usage is measurmeasur-ing the amount of allocated re-sources. It is an accounting system that records allocation of resources. In a shared resource environment which is a fundamental concept in utility computing, the amount of allocated resource means that your requested resource will be dominated to you not interrupted by any other users. Resource allocation is not measuring real-time resource us-age. Instead, it records rented resources in an accounting book for billing and charging. There are static metrics for allocation such as allocated number of cpu cores, memories, and disks. Number of public IP addresses is also counted for metrics.
1.3
Motivation
Investigation for performance managements on the cloud would provide understanding of resource usage and statistics in several ways such as accounting/billing and provisioning. This classification will help evaluate the current performance of the cloud systems and gain the visibility of resource uti-lization across application layer and system layer.
1.4
Problem
Cloud platform relies on sharing of computing and storage resources with many people like a public utility, understand-ing amounts of the usage of resources is gettunderstand-ing important to the cloud users and cloud providers. It is not only important measuring use of resources but also important displaying metrics via graphical charts. There are concrete challenges for this research area:
Understanding - it is a basic functionality to see how reli-able the system is and to prevent system failures by knowing the resource utilization. It also gives an opportunity to man-age the system efficiently by knowing the performance of the system.
Getting informed - the system of alerts allows system ad-ministrators to react when the incidence of problems are detected. If the alerts are related to a resource reallocation, it is important to react on time according to the notifica-tions. These alerts are not limited to delivering errors and warnings which are passive means, but rather they can be used as a proactive and defensive measure.
Estimating future requests (Prediction) - it discovers us-age patterns and trends of system resources which allows to projection the increasing of system capacity and perfor-mance.
Reporting - Measured statistics can be viewed in differ-ent ways with various visualization tools. Several graphical tools and charts APIs can help identify which resources are consumed the most by whom, what, where, why and when. There is a small number of accounting software to provide metered resource utilization in open source cloud platforms.
Those tools such as Gold accounting Manager [12] are very simple and are supposed to support system administrators not cloud users. Eucalyptus 2.0 and 3.0 Enterprise gener-ates resource usage information via log messages with user information. We have an idea for a log parsing tool to col-lect metering values from Eucalyptus and a command line tool to show measured data. A graphical representation of measured data is required to represent multiple numbers of numerical metrics and we have chosen HighCharts [11], Google Chart API to generate chart images.
1.5
Definition
Once we started investigation on Cloud Accounting tools, similarity of accounting, billing, and monitoring tools is some-thing that we need to clarify. In this section, we give our own words to identify differences among them.
1.5.1
Monitoring
Monitoring is about measuring resource utilization. In a typical way, real-time monitoring is performed in a sys-tem/hardware layer to show activities. It is supposed to provide performance analysis by measuring CPU utilization, load average, memory usage (free/used), network bandwidth in/out and disk I/O. Given that metrics, monitoring system shows that how many resources are being used at any given time.
1.5.2
Accounting
Accounting is about measuring resource allocation. Un-like monitoring, accounting system doesn’t care how much idle exists for allocated resources but rather focuses on col-lecting and storing usage information in a user level. The size of allocation and the amount of time for the allocation are most important factors to measure resource usage.
1.5.3
Billing
Billing is about issuing a bill to a user for what they used. Billing system usually sees transactions on an accounting system to include the duration of the used time, type of the used items, and the quantity of the rented resources. It is more like paying a utility bill for a user.
1.5.4
Auditing
Auditing is about finding a proof and a trait of an action a user made while resources are being used. Observing a user’s every behavior should be performed by logging events and detailed information is necessary to track back any issues on a system.
2.
USAGE MEASUREMENT FOR IAAS
2.1
OpenStack
OpenStack Compute (Nova) also provides a command line tools to retrieve usage statistics, for example, ’nova usage-list’ provides usage data for all tenants. These management commands typically limited to system administrators to ex-ecute.
2.1.1
Ceilometer
Ceilometer project is a framework for monitoring and me-tering the OpenStack cloud and Ceilometer is a primary place to get access of all usage data in openstack compo-nents. It was mainly developed to charge customers as a billing system. Like other commercial cloud platforms, for example Amazon Web Services, these metrics are included, with an hour level granularity :
• Compute (Nova)
• instance type, availability zone • cpu core
• memory size
• nova volume block device type and availability zone • Network
• data transfer (in / out), availability zone • external floating ip
• Storage (Swift) • disk size used • data in/out
2.1.2
Implementation
There is a program named an agent on each OpenStack node and aggregates information about virtualized resources. The agent on each nova compute node uses Linux virtual-ization API (libvirt) and Windows Management Instrumen-tation (wmi) to extract essential information from hypervi-sor. Some other agents harvest the data from iptables, swift proxy or the nova database, if additional information can be obtained through these external services.
There are four basic components to Ceilometer:
• Agent: runs on each compute node and polls for re-sources utilization statistics.
• Collector: runs on management servers to manage the message queues for data coming from the agent. Me-tering data are stored to the openstack data store di-rectly and a notification message are delivered to the Openstack messaging bus once it is processed.
• Data store: is a place of collected data. It provides interaction with the collector and a api server.
• API server: runs on management servers to provide statistics about the measured data.
An API server provides access to metering data in the database via a REST API. A central agent polls utilization statistics for other resources not tied to instances or compute nodes. There may be only one instance of the central agent
running for the infrastructure. A compute agent polls me-tering data and instances statistics from the compute node (primarily the hypervisor). Compute agents must run on each compute node that needs to be monitored. A collec-tor monicollec-tors the message queues (for notifications sent by the infrastructure and for metering data coming from the agents). Notification messages are processed, turned into metering messages, signed, and sent back out onto the mes-sage bus using the appropriate topic. The collector may run on one or more management servers. A data store is a database capable of handling concurrent writes (from one or more collector instances) and reads (from the API server). The collector, central agent, and API may run on any node. These services communicate using the standard OpenStack messaging bus. Only the collector and API server have ac-cess to the data store. The supported databases are Mon-goDB, MySQL, PostgreSQL, HBase and DB2; however, A dedicated host for storing the Ceilometer database is rec-ommended, as it can generate lots of writes. Production scale metering is estimated to have 386 writes per second and 33,360,480 events a day, which would require 239 Gb of volume for storing statistics per month. [6]
Openstack itself has notification systems built into the existing OpenStack components. Most usage data are col-lected from these notification systems. Ceilometer also re-quests metering messages from a pollster plugin using the ’ceilometer.poll.compute’ namespace.
2.1.3
Ceilometer with OpenStack Heat for
autoscal-ing
The OpenStack Orchestration program, Heat, provides an autoscaling service with Ceilometer like Amazon CloudFor-mation. OpenStack Heat scales VM capacity up or down according to the metrics from Ceilometer. Ceilometer col-lects metrics for virtual machines and its alarming module calls the Heat API if the threshold for the metrics is reached. Heat triggers the upscaling or the downscaling virtual ma-chines once it is notified by Ceilometer. This integration of Heat and Ceilometer allows you to ensure optimal utiliza-tion by managing the number of virtual machine instances. Amazon has a similar combination of AWS Auto Scaling and AWS CloudWatch to provide the autoscaling service based on monitoring values. [5]
2.1.4
Nova command line tools for usage statistics
Openstack provides usage statistics for OpenStack Com-pute (Nova), a main component for provisioning and manag-ing virtual machines, with command-line tools. Simple com-mands displays basic statistics on resource usage for hosts (physica nodes) and instances (virtual objects running on the host). Basic information such as CPU, memory, and disk usage are viewed. These information about allocated resources to the instances do not indicate resource usage on the physical host. For more detailed information about resource usage, Ceilometer has rich functions to see user re-lated or system rere-lated usage data. Ceilometer is available on OpenStack Hanava and Grizzly version.
Example 1. Display a summary of resource usage of the devstack-grizzly host
$ nova host-describe sierra
+---+---+---+---+---+
+---+---+---+---+---+
| sierra | (total) | 8 | 32176 | 144 |
| sierra | (used_max) | 6 | 12288 | 120 |
| sierra | (used_now) | 6 | 12800 | 120 |
| sierra | project1 | 3 | 6144 | 60 |
| sierra | project2 | 2 | 4096 | 40 |
| sierra | project3 | 1 | 2048 | 20 |
+---+---+---+---+---+
Usage data can be provided by Tenant Id which is a group of openstack cloud users. Each tenant id represents a group or an account to the group members, so usage data for the tenant id are aggregated.
Example 2. Summary statistics for tenants
$ nova usage-list
Usage from 2014-02-14 to 2014-03-15:
+---+---+---+---+---+ | Tenant ID | Instances | RAM MB-Hours | CPU Hours | Disk
GB-Hours |
+---+---+---+---+---+
| user1 | 17 | 6840394.43 | 3340.04 | 66800.73 |
| user2 | 17 | 185683.06 | 90.67 | 1813.31 |
| user3 | 1 | 932256.36 | 455.20 | 9104.07 |
| user4 | 26 | 4947215.08 | 2415.63 | 48312.65 |
| user5 | 5 | 18644854.23 | 9103.93 | 182078.65 |
+---+---+---+---+---+
Usage data for Ceilometer and the nova command line tools is provided by OpenStack Notification System. The notification system can be configured to emit events either through nova’s logging facility, or send them to a series of AMQP queues (one per notification priority). System usages are emitted as notification events with the INFO priority. Different types of usage events are distinguished via the no-tifications’ ’event type, which is a hierarchical dotted string such as compute.instance.create, which allows usages to be easily grouped for aggregation. Usage notifications can be immediate, created when a specific increment of usage oc-curs (such as creation of an instance) or periodic, generated by a periodic task, like a cron job, and covering usage for a certain period of time. Besides the standard Nova No-tification priority, noNo-tification timestamp, and event type, usage notifications contain a payload of data that will vary depending on the event type. This is presented as a json-formatted hash of key-value pairs. Some of the keys, such as tenant id will always be present in any usage notification, others will be data relevent to that event type (For example, instance related notifications will contain data describing the instance.) [13]
2.2
Eucalyptus
The Eucalyptus Amazon compatible private cloud has provided resource usage information through external mon-itoring tools such as Nagios and Ganglia. Since both Na-gios and Ganglia have been proved to observe state data within distributed systems, Eucalyptus relied on integration with these tools for resource monitoring. To enhance sys-tem management, Eucalyptus recently improves summary reports about resource allocation and status. There are com-mands line tools for generating reports for eucalyptus cloud that start with eureport- in the Cloud Controller (CLC) and eucadw- in the data warehouse. The reports provide us-age data for understanding how cloud resources are utilized and being used via simple command line tools. eureport-generate-report is a main command to get access usage data.
Various type of resources can be measured such as elastic-ip, instance, s3, snapshot, and volume when eureport-generate-report is ran with a eureport-generate-report type option. The Eucalyptus data warehouse is a place to keep all usage data coming from CLC. External programs can get access to the usage data from the data warehouse instead of CLC directly. It may reduce impact of pulling usage information from cloud when it performs its cloud duties. [7]
Regarding to commercial clouds, usage data is provided to cloud services running under your account.
2.3
Azure
Microsoft Azure - Microsoft Windows Azure is a cloud computing platform used to build, host and scale web appli-cations through Microsoft data centers [14]. The platform contains various on-demand services hosted in Microsoft data centers. These services are provided through three products.
• Windows Azure: an operating system that provides scalable compute and storage facilities.
• SQL Azure: a cloud based, scale out version of SQL server.
• Windows Azure AppFabric: a collection of services supporting applications both in the cloud and on premise.
The System Center Monitoring Pack for Windows Azure application is the most cost effective and flexible platform for managing traditional data centers, private and public clouds, and client computers and devices [3]. It provides monitoring of availability and performance for Windows Azure applications. It is the only unified management platform where multiple hypervisors, physical resources, and appli-cations can be managed in a single offering. From a single console view, the IT assets like network, storage and com-pute can be organized into a hybrid cloud model spanning the private cloud and public cloud services.
The monitoring pack runs on a specified agent and uses Windows API.s to remotely discover and collect information about a specified Windows Azure application. By default, the monitoring is not enabled. Therefore, the discovery must be configured by using the Windows Azure Application mon-itoring template for each Windows Azure Application to be monitored.
The following functionalities are provided by the Monitor-ing Pack for Windows Azure Applications:
• Discovers Windows Azure applications. • Provides status of each role instance.
• Collects and monitors performance information. • Collects and monitors Windows events.
• Collects and monitors the .NET Framework trace mes-sages from each role instance.
• Grooms performance, event, and the .NET Framework trace data from Windows Azure storage account.
• Changes the number of role instances.
• WADPerformanceCountersTable for the performance counters
• WADWindowsEventLogsTable for the windows event logs.
The performance monitoring can be enabled by imple-menting some code or using some tools like:
• Powershell cmdlets for Windows Azure [2] • Azure Diagnostics Manager 2 from Cerebrata [1] By using these tools one instance of Windows Azure is configured to collect some performance counters without modifying the application code. The performance data will be collected by the Azure Diagnostic Monitor and moved at the interval user specified to a table called WADPerfor-manceCounters. User can use diagnostic data for debug-ging and troubleshooting, measuring performance, monitor-ing resource usage, traffic analysis and capacity plannmonitor-ing, and auditing. Diagnostic data is not permanently stored unless user transfers the data to the Windows Azure stor-age emulator or to Windows Azure storstor-age. After the data is transferred to storage it can be viewed with one of several available tools. To collect Windows Event logs in a Win-dows Azure application, the Event logs data source must be configured.
Once, the Azure Management Pack is installed, three .run as. accounts must be created in System Center Operation Manager:
• One for binary authentication. This account will use the management certificate to connect to Azure.
• One for basic authentication. This account will be used for the certificate
• One that will be used for the proxy agent.
The monitoring data can be visualized using System Cen-ter Operation Manager Console. From Operation Manager, user can create custom dashboard or publish graphs on Share-Point to people who do not have the SCOM console.
2.4
Amazon
2.4.1
Amazon CloudWatch
Amazon CloudWatch monitors your Amazon Web Ser-vices (AWS) resources and the applications you run on AWS in real-time. ACW is a metrics repository. AWS product puts metrics into the repository, and users retrieve statistics based on those metrics. Metric is a variable you want to measure for your resources and applications. Namespaces are containers for metrics. Metrics are time-ordered sets of data points, are isolated from one another in different namespaces so that metrics from different applications are not mistakenly aggregated into the same statistics. Users re-trieve statistics about those data points as an ordered set of time-series data. Over the time value is important for met-rics since it contains historical changes in it. Timestamp always follows with a metric. Amazon provides PutMetric-Data API to create a custom metrics and publish to ACW. 2 weeks time period for store statistics. Each metrics has a dimension, which is a name / value pair that helps you to uniquely identify a metric.
CloudWatch has a notification to alert users and auto scal-ing (automatically make changes) to the resources you are monitoring based on rules that you define. Simply, Cloud-Watch manages threshold values to send a notification to users via email or text messages, and even more, apply changes with a pre-defined settings such as increasing vir-tual instances or diminishing. You gain system-wide visibil-ity into resource utilization, application performance, and operational health.
3.
MONITORING ON HPC
Monitoring in high-performance computing has a similar-ity to Cloud Computing. It provides fixed number of jobs that a user can create and each job runs on a same size of nodes in clusters. There are also common management tools to clusters, so accounting data can be collected from these tools.
3.1
XDMoD
XDMoD (XSEDE Metrics on Demand) is primarily devel-oped as UBMoD (University Buffalo Metrics on Demand) and is an open source tools for collecting and mining statis-tical data from cluster resource managers such as Torque/-Maui, OpenPBS, SGE and Slurm commonly found in high-performance computing environments. There are three fun-damental components: a metrics repository (XDMoD Data Warehouse), a RESTful API, and a web-based application (XDMoD Portal). Its web graphical user interface, XDMoD Portal, provides rich set of statistics with different type of charts and tables with communicating its RESTful API. [8, 9]
3.2
Nagios
Nagios is a web based Linux monitoring systems and it allows to monitor availability and response time of network services, usage of system resources like CPU load, RAM al-location etc., number of logged in users and so on. The main Nagios instance (server) collects information from Linux, BSD, Windows hosts or Cisco devices through Nagios clients (agents), and sees states of their services or processes in one place: Nagios web interface. Nagios generates a notification in case of any outage detected or any anomaly through wide range of alert methods such as e-mail, sms, chat messages and phone call notifications. And one more thing, Nagios monitors states but it doesn.t show any graphs like network interface usage etc.
3.3
Cacti
Cacti is a network monitoring tool using simple network management protocol (SNMP) and similar to other tools such as Nagios and Ganglia, it uses RRDtool as a DBMS and a visualization graphical tool. Since it supports polling monitoring data via shell scripts like php or c-based exe-cutable, it can be extended to measure other resources not only network traffic. It is also suitable for a hosting service with user-based management.
3.4
Zabbix
reports when they are needed. Zabbix Agent which is de-ployed on a monitoring target obtains utilization data using various monitoring protocols and tools like SNMP, TCP, and ICMP. For the cloud monitoring, Zabbix active agent auto-registration helps monitoring cloud instances such as Ama-zon cloud, and OpenStack without configuring manually.
3.5
Zenoss
Zenoss (Zenoss Core) provides a unified resource manage-ment service which manages applications, networks, servers, and storage in terms of monitoring physical or virtual sys-tems including the public, private and hybrid cloud. It is built on the Zope object-oriented web application server, and using RRDtool with MySQL as to store collected in-formation using SNMP, SSH, WMI and log files e.g. sys-log. Zenoss provides additional features with other mon-itoring mechanisms such as Perfmon, JMX, and VM API (e.g. VMware API) in the enterprise version which is based on the open-source core version. The one of the key fea-tures of Zenoss is Model-Driven Monitoring which is about automatic and dynamic discovery, configuration and mon-itoring. As a communication tool, Zenoss utilizes Twisted Perspective Broker (PB) instead of AMQP typed messaging system like RabbitMQ. They claims Twisted provides an asynchronous, event-driven with co-operative multi-tasking which is a deferred object.
3.6
Rackspace Cloud Monitoring
Rackspace Cloud Monitoring is an API driven monitoring system which allows administrators to use or create APIs depending on their needs which can send notifications to any device including mobile devices. This allows administrators to be on top of their Rackspace-hosted infrastructure which includes websites, protocols, and ports.
4.
SYSTEM DESIGN
Cloud Metrics pursues to provide an integrated account-ing service which users and system administrators are able to obtain cloud usage data for various cloud platforms such as Eucalyptus, OpenStack, and Nimbus and so on. The usage information will cover several aspects like billing, auditing, monitoring, and accounting systems. Parsing log files is a main process for collecting and storing information regard-ing the utilization of virtual machine (VM) instances and service nodes or clusters. The current development focuses on:
• A measuring tool of resource used
• A command-line interface to explore the cloud usage data
• A visualization to help understand usage data • A RESTful API Service to support external services We have observed Eucalyptus generates resource usage formation via log messages and OpenStack stores virtual in-stances information into database. Nimbus has a separated database about the deployment of virtual instances. We have been collecting information about resource utilization from the log messages and the database and incorporating the collected data into one place. These data aligned with a unique user account to provide integrated resource utiliza-tion across geographically distributed regions and services.
[image:6.595.316.536.132.255.2]For better presenting of numerical values and relationships with other metrics, we used external charting libraries such as HighCharts, Google Chart APIs. With rich variety of charts, we can provide better explanation for historical and real-time data. Figure 1 shows a conceptual view as to how Cloud Metrics works on IaaS.
Figure 1: Overview of Cloud Metrics
5.
IMPLEMENTATION
Cloud Metrics consists of four components: 1) a measur-ing tool of resource allocation and 2) a CLI tool to define metrics and collect usage data 3) a visualization tool to pro-vide graphical representative of the data and 4) Web Ser-vice APIs to support other applications e.g. scheduling and dynamic provisioning. We have the log parser named by fg-log-parser which reads and examines log messages of IaaS platforms (e.g. Eucalyptus, OpenStack) to collect metrics and stores the metrics into a database using a global object i.e. JSON converted from a python dictionary data type. fg-metrics takes the role of analyzing usage data and gener-ating results in a image file or a csv file. We assume every measured data is stored in the database from five different resources (Foxtrot, Hotel, India, Sierra, Alamo) to support more than 400 projects and 3200 members as of 2014. Our new development of federation management, CloudMesh, uses the REST APIs to deliver accounting features on its command-line interfaces and web services [4].
5.1
Metric Collector
fg-metric-converter and fg-log-parser are executable python scripts on Linux/Unix shell. These scripts are mainly col-lecting information of resource allocation from virtual in-stances. To get the information from Eucalyptus and Open-Stack, basic templates are used to parse log messages using our pre-defined regular expressions. These are critical for that what type of log events will be collected and how it will be parsed without parsing errors and missing events. We have examined log messages of Eucalyptus and OpenStack and created templates for their instance information i.e. print ccInstance() function and nova.compute.resource tracker in a debug logging mode. Our custom templates for these IaaS platforms parse the events of the logs in a periodic ba-sis or a real-time. There are basic metrics such as userid, instanceid, time values of a vm instance, a number of virtual cpu cores, disks, and a size of memories.
In FutureGrid, XSEDE users have a unique account id along with a project id across 8 different resources (Alamo, Bravo, Delta, Foxtrot, Hotel, India, Sierra, and Xray). The Metric analysis tool named by fg-metrics searches usage in-formation across distributed resouces and services with their unique id and provides results with search options. For ex-ample, a user can specify the options using basic commands such as ’set nodename india’ and ’set date -M 05 -Y 2012’ to get usage information of India resource on May 2012. In addition, it supports different output types to help un-derstanding statistics. Comma-separated values (CSV) files and graphical representation tools such as Google Chart API, Highcharts, D3.js, and jQuery Sparkline are used to generate results in image files (e.g. png, gif, and jpg).
6.
RESULTS AND STATISTICAL ANALYSIS
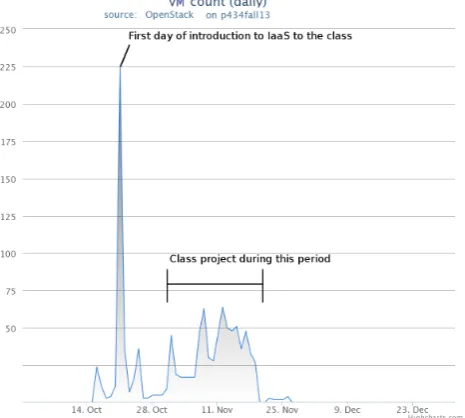
[image:7.595.320.553.61.270.2]Based on the observation on FutureGrid, there is a differ-ent pattern between a research project and class work when they acquire cloud resources. Resource allocation of aca-demic coursework shows time dependent request patterns. It shows a surge when there is a class, a lab session, and a project. For example, the undergraduate course for Dis-tributed Systems at Indiana University introduced IaaS in the class and used the IaaS platform for a class project. Figure 2 shows a spike in the class and variability until the project due. A research project, on the contrary, re-quests VM instances in a steady usage. The Next Genera-tion Sequencing (NGS) in the cloud project on FutureGrid shows relatively consistent resource allocation requested in Figure 3. With a certain period of time, vm instances of this project have been launched without unplanned spike requests. These two examples show different patterns for deploying resources but both cases have a factor to predict loads. The class schedule and the monitoring data for ap-plications can be used to measure the amount of resources and identify incoming requests. In paid cloud platforms such as AWS, GCE, and Azure, understanding these patterns is important to bring cost effectiveness over on-demand allo-cation. For example, Amazon EC2 Reserved Instances and Azure pre-pay plans may help reduce usage costs for periodic and planned workloads. These service plans simply provide discounts with an upfront payment. As long as a class and a project go as planned, cost saving chances are increased.
With the Gantt chart in Figure 4, allocation activities are viewed for all virtual instances launched for the class. At the beginning of the class, the gaps between the start and completed dates of the vm instances are small but a large number of instances are initiated. Once the class is became operative, the running time of vm instances is getting longer and a less number of instances are requested compared to the beginning. This observation tells us that academic projects require training sessions at the beginning of a project to get familiar with using infrastructure and to prepare environ-ments by installing software and datasets.
Other observation is a resource usage for administrative purposes. Figure 5 describes that instructors consumed a large number of vCPU cores before class starts and small tests just before class projects. It indicates that the prepa-ration of courses require extensive load testing on cloud re-sources to estimate compute capacity needed for applica-tions.
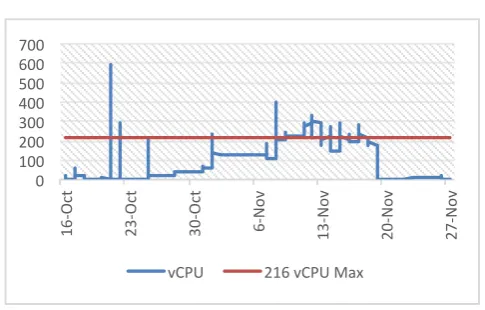
During the semester, 25 hosts, 216 vCPUs and 600GB memories were reserved for the class since it required large
Figure 2: IaaS Usage data for the Distributed Sys-tem class at Indiana University*
Figure 3: VM count for Next Generation Sequenc-ing (NGS) in the cloud project
virtual instances. In Figure 6 shows that the dedicated re-sources were being underutilized most time although the high volume requests had been made a few times includ-ing 273% overutilization on October 21th for testinclud-ing and preparing.
[image:7.595.329.551.326.536.2]23-‐Sep 13-‐Oct 2-‐Nov 22-‐Nov 12-‐Dec 1
52 103 154 205 256 307 358 409 460 511 562 613
[image:8.595.54.293.51.242.2]Timeline for VMs
Figure 4: Timeline for VM walltime
0 200 400 600 800 1000 1200
16-‐O ct
23-‐O ct
30-‐O ct
6-‐No v
13-‐No v
20-‐No v
27-‐No v
[image:8.595.321.549.152.319.2]Instructor Student
Figure 5: Usage between instructors and students for vCPU cores
0 100 200 300 400 500 600 700
16
-‐O
ct
23
-‐O
ct
30
-‐O
ct
6-‐No
v
13-‐No
v
20-‐No
v
27-‐No
v
vCPU 216 vCPU Max
Figure 6: vCPU Utilization (approximation per hour)
platform hybrid implementations are one of today’s trends for big data scientists and researchers. Regarding IaaS cloud platforms, there are three difference choices between Open-Stack, Eucalyptus, and Nimbus on the FutureGrid test-bed. One observation from Figure 7 is that OpenStack has taken Eucalyptus share since 2011 and became the most popular
[image:8.595.53.294.260.419.2]IaaS platform last year (2013). According to the recent re-port from RightScale [15], cloud competition is heating up not only in public cloud including Amazon Web Services (AWS) and Google Compute Engine (GCE), but also in pri-vate cloud. The report shows that OpenStack is the most popular cloud environment for private cloud users so the changes in Figure 7 is understandable in terms of finding cloud alternatives.
Figure 7: Service changes for along with Big Data between 2010 and 2013
In HPC, 64 and 128 CPU cores per job are most popular job sizes in FutureGrid HPC in 2013 (See Figure 8). 24% and 14% of total wall time are for 64 and 128 cpu jobs. An extra large jobs (i.e. 512 CPU cores) has been intensively used in the last year. Compared to the previous year 2012, the request has been increased about 350%. In early stage of FutureGrid between 2010 and 2011, tiny CPU jobs have been requested many times but in 2013, two thirds jobs are using more than 64 CPU cores.
Figure 8: Annual Wall Time Changes for Job Size in HPC between 2010 and 2013
6.1
Pricing Comparison
[image:8.595.52.295.451.606.2] [image:8.595.326.551.476.612.2]con-sider adopting cloud services among a lot of selections from different providers. In the comparison, important criteria are revealed through its pricing table. For example, there are a range of service offered, a size of available systems, costs, discounts and benefits such as technical support, and development tools. Amazon AWS, Windows Azure, Google Compute Engine (GCE), HP Cloud, IBM and Rackspace are compared. Pricing is scenario based. It can’t be simply pared with numbers. GCE looks cheaper than other com-petitors, but others have several options to reduce cost. For example, a pay-ahead model provides a discount for same instances, and a spot instance also provides a way of saving entire cost for task intensive workloads in a small amount of time. In Table 1, different price tags for virtual machine instances are described. With the comparison of the small-est vm instance which is 1 virtual core, 600-768MB memory and no storage option, we can see most IaaS service providers have similar pricing charts.
6.1.1
Example of Pricing Comparison
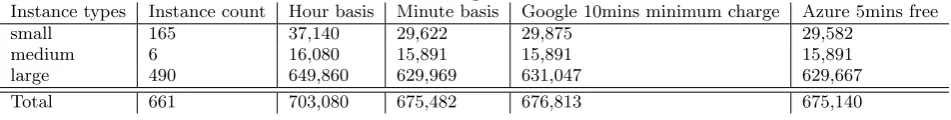
We tried to apply each pricing model; Amazon AWS, Google Compute Engine, Microsoft Azure; to the usage data of the class (P434 distributed systems at Indiana Univer-sity), to compare cost estimate of cloud resources. Google Compute Engine is the least expensive and 16% lower than Amazon AWS. It is mostly because of that Google has 10% discount pricing chart compared to AWS. We observed that a minute basis charge is only 3.3% less expensive for this class. Some restrictions and offers such as Google’s 10-minute minimum charge and Azure’s less 5-10-minute free of charge are relatively small amount of a discount or an ex-tra charge. Google’s 10-minute minimum charge asks 0.18% extra charge to the class, Azure provides 0.05% discount through their less 5-minute free of charge. Amazon only has an hourly based pricing model, while Google Compute Engine and Windows Azure offer a minute basis charge for use of virtual machine instances. Three types of instances (small/medium/large) had been used for its coursework and projects and usage of virtual machine instances was only calculated without network and storage usage. Table 2, 3 shows pricing comparison to the class.
7.
SUMMARY
We hope this activity provides a way of understanding per-formance and resource utilization across system and applica-tion layers, especially on XSEDE cloud resources. With the various requests of resource allocation on the cloud, XSEDE project leaders and members encounter challenges with find-ing availability of virtual resources and handlfind-ing this infor-mation. Cloud users in a pool of shared resources can suffer performance degradation by other users. Monitoring phys-ical resources is not enough to mitigate this degradation in cyberinfrastructure. In this paper, Cloud Metrics offer sev-eral means to get information of resource utilization and performance. In addition, the classification of performance managements and case studies provide an inside visibility to help identify the issues easily and finding solutions regarding resource allocation on the cloud. To enhance performance of systems and get powerful machines, understanding resource allocation of virtual resources is needed to avoid under per-forming systems and applications.
8.
FUTURE WORK
We can think about rerouting VM instances to ensure scal-able services by avoiding crowded zone. This cloud shifting may support relaxed management regarding load balancing of the cloud systems. The other potential work is probably that we can provide an indicator of cost-efficient leasing on the cloud based on the correlation data measured by this ac-tivity. Cost of using cloud can be reduced in many ways, in-cluding finding inexpensive cloud service providers, and us-ing parallel processus-ing technique such as MapReduce. Mea-suring correlation between physical and virtual resources could mean that we can find a spot in which reliable per-formance is guaranteed and it would be one of the main techniques to provide cost-efficient cloud renting across all the resources of XSEDE.
9.
ACKNOWLEDGEMENT
This material is based upon work supported in part by the National Science Foundation under Grant No. 0910812.
10.
REFERENCES
[1] “Cerebrata.” [Online]. Available: http://www.cerebrata.com/
[2] “Powershell cmdlets.” [Online]. Available: http://wappowershell.codeplex.com/
[3] “Guide for monitoring pack for windows azure applications,” 2011. [Online]. Available: http:
//technet.microsoft.com/en-us/library/gg276367.aspx [4] “Cloudmesh - a component to deliver a
software-defined system,” 2014. [Online]. Available: http://cloudmesh.futuregrid.org
[5] M. Abaakouk, “Autoscaling with heat and ceilometer,” 2013. [Online]. Available: http://techs.enovance.com/ 5991/autoscaling-with-heat-and-ceilometer
[6] N. Barcet, “Ceilometer volume calculator,” 2012. [Online]. Available:
https://docs.google.com/spreadsheet/ccc?key=
0AtziNGvs-uPudDhRbEJJOHFXV3d0ZGc1WE9NLTVPX0E [7] Eucalyptus-Systems, “Euca2ools 3.0.2 reference guide,”
2014. [Online]. Available: https://www.eucalyptus. com/docs/euca2ools/3.0/euca2ools-guide-3.0.2.pdf [8] T. R. Furlani, M. D. Jones, S. M. Gallo, A. E. Bruno,
C.-D. Lu, A. Ghadersohi, R. J. Gentner, A. Patra, R. L. DeLeon, G. von Laszewski, F. Wang, and A. Zimmerman, “Performance metrics and auditing framework using application kernels for
high-performance computer systems,”Concurrency
and Computation: Practice and Experience, vol. 25,
no. 7, pp. 918–931, 2013. [Online]. Available: http://dx.doi.org/10.1002/cpe.2871
[9] T. R. Furlani, B. L. Schneider, M. D. Jones, J. Towns, D. L. Hart, S. M. Gallo, R. L. DeLeon, C.-D. Lu, A. Ghadersohi, R. J. Gentner, A. K. Patra, G. von Laszewski, F. Wang, J. T. Palmer, and N. Simakov, “Using xdmod to facilitate xsede operations, planning and analysis,” inProceedings of the Conference on Extreme Science and Engineering Discovery
Environment: Gateway to Discovery, ser. XSEDE ’13.
New York, NY, USA: ACM, 2013, pp. 46:1–46:8. [Online]. Available:
[10] Y. Habibzai, “Heading into the cloud: Managing network performance across a unified fabric,” 2012. [Online]. Available:
http://www.networkworld.com/news/tech/2012/ 070612-cloud-performance-management-260734.html [11] A. Highsoft Solutions, “Highcharts js,”URL
http://www. highcharts. com, 2012.
[12] S. Jackson, “The gold accounting and allocation manager (2004).”
[13] OpenStack-Wiki, “Systemusagedata.” [Online]. Available:
https://wiki.openstack.org/wiki/SystemUsageData [14] E. Price, “Windows azure,” 2011. [Online]. Available:
http://social.technet.microsoft.com/wiki/contents/ articles/4373.windows-azure.aspx
[15] RightScale, “Rightscale ˜Os state of the cloud report,” 2013. [Online]. Available:
Table 1: Pricing chart for instances from AWS, GCE, and Azure
Billing granularity Price Variation for Price
AWS By hour $0.02 10 regions*, 6 platforms
[image:11.595.54.530.366.426.2]GCE By minute, with a minimum of 10 minutes $0.019 2 regions (Us, Europe) Azure By minute, No minimum, No billing for less than 5 minutes $0.02 6 regions, 5 platforms
Table 2: Usage data to the class
Instance types Instance count Hour basis Minute basis Google 10mins minimum charge Azure 5mins free
small 165 37,140 29,622 29,875 29,582
medium 6 16,080 15,891 15,891 15,891
large 490 649,860 629,969 631,047 629,667
Total 661 703,080 675,482 676,813 675,140
Table 3: Pricing comparison to the class
Service Cost Estimate Pricing (Small/Medium/Large) Restriction AWS $2,668.74 $0.06 / $0.12 / $0.24 per hour (US East Region; Linux) Hour basis charge