Copyright (0 2002 by John Wiley & Sons Ltd, Baffins Lane, Chichester, West Sussex PO19 IUD, England
National 01 243 179117 Intemutionnl ( -1-44) 1243 779177
e-mail (for orders and customer service enquiries): cs-books@ wiley.co.uk Visit our Home Page on http:Nwww.wileyeurope.coin
All Rights Reserved. No part of this publication may be reproduced, stored in a retrieval system, or Wimsmitted, in any forin or by any means, electronic, mechanical, photocopying, recording, scanniiig or othcrwwe, except under the terms of the Copyright, Designs and Parents Act 1988 or under the terms of a licence issued by the Copyright Licensing Agency Ltd, 90 Tottenhain Court Road, London,
UK WIP OLP, without the permission in writing of the publislier.
Neilher the authors nor John Wiley & Sons Lld accept any responsibility or liability for loss or daniagc occasioned to any person or property through using the material, instructions, methods or ideas contained herein, or acting or refraining from acting as a result of such use. The authors and
disclaim all implied warranties, including merchantability of fitness for any
Designations used by companies to distinguish heir prod
instances where John Wilcy & Sons IS aware of a claim, tie product names appear in initial capital or capital letters. Readers, however. should contact the appinpnate companies for more complete information regarding trademarks and registration.
re often claillied a8 tradcrnarks. In all
Other Wiley Edzron'ul Ojzces
John Wiley & Sons, Inc., 605 Thud Avenue, New York, NY 10 158-0012, USA
WILEY-VCH Verlag GmhH, Pappelallee 3,
D-69469 Wcinheim, Geiinany
John Wiley & Sons Australia Ltd, 33 Park Road, Milton Queenrland 4064, Australia
John Wiley & Sons (Asia) Pte Ltd, 2 Clement1 Loop #02-01, Jin Xing Distripark, Singapore 129809
John Wiley & Sous (Canada) Ltd, 22 Worcester Road, Rexdalc, Ontario M9W 1L1, Canada
~~~s~ Library ~ a ~ a l o ~ u i n g in ~ u ~ ~ i c a ~ i o n Data
A catalogue record for this book IS available from the British Lihrary
ISBN 0 41 1 48553 5
Typeset m 10/12 'Times by Thomson Press (India) Ltd., New Delhl
Printed and bound in Great Bntain by Antony Rowe Ltd, Chqpenh'm, Wiltshirc
. . .
I
.
1 Image and Video Compression. . .
11.2 Video CODEC Design
. . .
21.3 Structure of this Book
. . .
2ital
0. . .
Intr an. . .
2.2 Concepts, Capture and Display. . .
52.2.1 The Video Image
. . .
52.2.2 Digital Video
. . .
52.2.3 Video Capture
. . .
72.2.4 Sampling
. . .
72.3 Colour Spaces
. . .
102.3.1 R G B . ,
. . .
112.3.2 YCrCb
. . .
122.4 The Human Visual System
. . .
162.5 Video Quality
. . .
162.5.1 Subjective Quality Measurement
. . .
172.5.2 Objective Quality Measurement
. . .
192.6 Standards for Representing Digital Video
. . .
232.7 Applications
. . .
242.7.1 P...for.s
. . .
258 Sununary
. . .
. . .
25eferences
. . .
262.2.5 Display
. . .
9e
s
. . .
3.1 Introduction. . .
3.1.1 Do We Need Compression?. . .
273.2 Image and Video Compression
. . .
283.2.1 DPCM (Djfferential Pulse Code Modulation)
. . .
303 2.2 Transform Coding
. . .
313 2.3 Motion-compensated Prediction
. . .
313.2.4 Model-based Coding
. . .
323.3.1 Transform Coding
. . .
333.3 ImageCOaEC
. . .
33Vi CONTENTS
3.3.3 Entropy Coding . . .
ding
. . .
. . .
icing . . .
nsated Predicti~)n
. . .
uantisation and Entropy E n c ( ~ d i i ~ ~. . .
3.4.4 Decoding. . .
3.5 Sumrnary
. . .
. . .
4.1 .n.o...ction
. . .
. .
4.2 The ~ n ~ e r n a ~ ~ o n ~ l ~ t a n ~ ~ r d s Bodies. . .
4.2.1 The Expert Groups
. . .
4.2.2 The Staiidardisation Process
. . .
4.2.3 ~ ~ i d e ~ s t a n d i n ~ and Using the S t ~ d a r ~ s
. . .
JPEG (Joint Photographic Experts Group)
. . .
4.3.1 JPEG
. . .
4.3.2 Motion P E G
. . .
4.3.3 PEG-2000
. . .
g Picture Experts Group)
. . .
-1
. . .
-2
. . .
4.4.3 ~ ~ E
. . .
~ - 4 5 Summary. . .
eferences. . .
4 3s:
. . .
5.1 lntroduction
. . .
.261
. . .
.
263. . .
5.3.1 Featurcs
. . .
.
263 Optional ModeslH.263+. . .
H.263 Profiles
. . .
5.5 H.26E. . .
5.6 Perforniance of the Video Coding Standards
. . .
5.7 .uni.iary. . .
e ~ ~ r e n c e s. . .
. . .
6.1 Introduction
. . .
ion and Compensation
. . .
ents for Motion Estimation and .ompeiisa..on. . .
rence Energy
. . .
ation. . .
. . .
6.4 Fast Search
. . .
6A.l Three-Step Search (TSS)
. . .
CONTEJTI'S vii
6.4.2 Logarithic Search
. . .
1036.4.3 Cross Search
. . .
i04. . .
105rest Neighbows Search
. . .
105. . .
107ation Algorithms
. . .
1096.6 Sub-Fixel Motion Estimation
. . .
1 1 1 Frames. . .
113iction
. . .
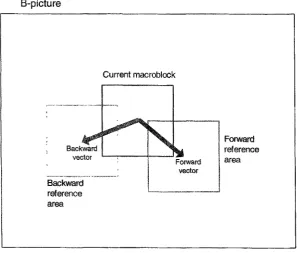
1136.7.2 Backwards Prediction
. . .
1136.7.3 ctional Prediction
. . .
1136.7.4 le Reference Frames
. . .
1146.8 Enhancements to the Motion Model
. . .
115nt Outside the Reference Picture
. . .
. . .
115. . .
115lock Motion Compensation (OBMC)
. . .
116on Models
. . .
116. . .
117ware Implementations
. . .
117ntations
. . .
122References
. . .
1256.10 S u m m y
. . .
125. . .
17.1 Introduction
. . .
1277.2 Discrete Cosine Transform
. . .
1277.3 Discrete Wavelet Transform
. . .
1337.4 Fast Algorithms for th CT
. . .
1387.4.1 Separable Tran rrls
. . .
1387.4.2 Flowgraph Algorithms
. . .
1407.4.3 Distributed Algorithms
. . .
1444.4.4 Other DCT A ~ ~ ~ r i t h ~ s
. . .
1457.5 I n ~ p l e ~ e n t i i ~ ~ the DCT
. . .
1467.5.1 UCT
. . .
2465.2 DCT
. . .
148uantisation
. . .
150ser
. . .
152II
. . .
153ementation
. . .
156iantisation
. . .
157. . .
160eferences
. . .
161. . .
8.1 ~ntroaucuon. . .
1638.2 Data Symbols
. . .
164...
II CONTENTS8.2.2 Other Symbols
. . .
8.3 Huffman Coding
. . .
8.3.1 ‘True’ 13uffman Coding. . .
8.3.2 Moclified Huffman Coding
. . .
8.3.3 Table Design
8.3.4 Entropy Coding Example
. . .
8.3.5 Vzuiable Length Encoder Design
. . .
8.3.6 Variable Length Decoder Design. . .
8.3.7 Dealing with Errors. . .
8.4 Aritbnietk Coding . . .
8.4.1 lniplementation h u e s
. . .
8.5 S u i n ~ ary
. . .
eferences
. . .
. . .
. . .
. . .
. . .
9.2 Pre-filtering
. . .
92.1 Camera Noise
. . .
9.2.2 CamernMovement
. . .
9.3 Post-filtering
. . .
9.3.1 Image ~ i s ~ o ~ ~ i o n
. . .
9.3.2 De-blocking Filters. . .
9.3.3 De-ringing Filters. . .
9.3.4 Error Concealment Filters
. . .
4 Summary
. . .
eferevrces.,. . .
y
. . .
uction
. . .
te and Distortion
. . .
10.2.2
10.2.2 Rate-Distortion Performai~ce
. . .
10.2.3 The Kate-Dis~o~tion Problem
. . .
10.2.4 Practical Rate Controll Methods. . .
30.3 ~ o n l p ~ ~ l a ~ i o n a l Complexity
. . .
10.3.1 Computational Complexity and Video Quality. . .
10.3.2 Variable Complexity Algorithms. . .
10.3.3 Complexity-Rate Cone01
. . .
4 Sumiiia ry. . .
~erences
. . .
The hiipoitilnce of Rate Control. . .
. . . .
. . .
. . .
s and Constraints
. . .
QoS Kequireinellts for Coded Video
. . .
Practical QoS Performance. . .
Effect of QoS Constraints on Coded Video
. . .
11.2.1CONTENTS i X
. . . 244
. . .
2silience
. . .
24411.3.3 Delay
. . .
247. . .
249EG-2 S y s t ~ m s / ~ r a n s p o ~
.
249 Multimedia Conferencing. . .
252.
5 Summary. . .
254ferences
. . .
255. . .
uction. . .
12.2 Cienerd-purpose Processors. . .
257abilities
. . .
258tirnedia Support
. . .
258roceswrs
. . .
260. . .
262. . .
263rs
. . .
264. . .
266. . .
26712.9 Summary
. . .
269. . .
270X CONTENTS
14.2 § ~ d i i d ~ r ~ s Evolution
. . .
14.3 Video Coding Research
. . .
14.4 Platfbrm Trends. . .
14.5 Application Trends. . .
14.6 Video CODEC Design. . .
eferences
. . .
y
. . .
ry. . .
289 290 290 291 292 293
The subjec~ o f this book i b the co~pression (‘coding”) of digital images ill1
the last 5-10 years, image and video coding have gone from being r e ~ a ~ i v e ~ y esoteric research wbjects with few ‘real’ applications to become key ~ ~ c h n o l o ~ ~ e s for a wide range of ~ a ~a p p l i c a ~ ~ o ~ ~ s , s ~ from personal computers to television. ~ ~ ~ ~ e ~
ike many other recent t e s ~ ~ o ~ [ ~ g i c a l devel inents, the einer~eiice of pideo
the n i i i S S market i s due to coiivergen of a number of xe~xs. Cheap an processors, fast network access, the ubiqui~ous Internet and a large-scale re
s ~ a n ~ ~ a r ~ i sation effort have all ~ ~ ) r i t r i b ~ ~ ~ e d to the deve~op~~ieiit of image and video coding technologies. Coding has enabled
~elev~siofl~ digital versatilc disk
o f new ‘multimedia’ movies, s t r e a i ~ i n ~
a1 gap in each of these ~ ~ ~ ~ l i c a t ~ ~ ~ s : the ~ - ~ ~ a l i ~ y d l l and moving images, d e l ~ v ~ r ~ ~ ~ y uicklly at
~ s i ~ s s i o ~ networks and storage devises.
gnaJ requires 21 6 Mbits ot storage or ~ r ~ i l s ~ i ~ ~ ~ ~ ~ ~ ~ ~ ~ ~ s s i o n of thil; type of signal in real time i 4 l~eyo~id
~ n u i ~ i s a t ~ o n s networks. A 2-hour ~ i ~ v i e (uncorn- orage, equivalent to 42 DV
order for digital video to b~~~~~~ a ~ ~ a u s ~ b ~ e alternative to it ~ a i i ~ ~ o ~ u e ~ e ~ e v ~ s i o i ~ or
reducing or compressing this prohihilively high bit-rate signal. eotape), it ha\ been necessary 1
The drive to solve this problem has taken several decades and massive efforts in research, ment and s ~ a n d ~ ~ d ~ s ~ i ~ ~ ~ ~ n (and work sontinties to improve existing me~~iods aiid new coding paradigms). However, efhcient compression methods are now a firmly cstabl ished c o i ~ p o n e ~ t OS thc new digital niedia lcchnol~~gie~ such as digital ~ e ~ e v i ~ i o n and
eo. A ~ e ~ c o ~ n e side effect d these d e v e ~ o p r n ~ n ~ s is h a t video and image ression has enabled many novel visud communication applications
iously been possible. Some areas have taken off mire quickly
e x ~ ~ ~ ~ p ~ e , the long-~re~~icted boom in video c o ~ ~ e r e ~ i c ~ J i g has yet to appear), but there is no doubt that visual compression is here to stay. Every ncw
PC
has a number df e a ~ ~ r e s ~ ~ e ~ i ~ c a ~ ~ y to support arid accelerate video c o ~ n p ~ ~ s s i o ~ a l g o ~ ~ t ~ ~ m s . o p d nations have a timetable for s ~ o ~ ~ i f l ~ the transnii~sion of analogue television, after
leviwon receivers will rieed coraipressioii t
S videotapes are finally being replaced by
INTRODUCTION
DVD players or on PCs. The heart of all of these applications is the video compressor <and decompressor; or enCOderDECoder; or video GODEC.
DEC technology has jn the pas1 been something of a ‘black art’ known only to a unity of academics and technical experts, partly because of the lack of appro- achable, practical literature on the subject. One view of image and video coding is as a mathematical process. The video coding field poses a number of interesting mathematical problems and this means that much of the literature on the subject is, of necessity, highly mat~i~ina~ical. Such a treatment is important for developing the .fundamental concepts of
compression but can be bewildering far an engineer or developer who wants to put coinpression into praclice, The increasing prevalence of digital video applications has led to the ~ublica~jon of more approachable texts on the subject: unfortunately. some of these offer at best a superficial treatment of the issues, which can be equally ~iiihelpf~il.
This book aims to fill a gap in the market between theoretical and over-s~~plified texts on video coding. It is written pritnarily from a design and i~ipleincntation perspective. work has been done over the last two decades in developing a portfolio of practical t e c h n ~ ~ ~ ~ e s and approaches to video compression coding as well as a large body o f theoretical research. A grasp of these design techniques, trade-offs and performance issues is important to anyone who needs to design, specify 01 interface to video CODECs, This book emphasises these practical considerations rather than rigoroiis r n a ~ e m a t ~ c a ~ theory and c ~ ) n c ~ n t ~ ~ ~ e s 011
on ol’ video coding systems, enibodied presenting the practicalities of video CO
way it i s hoped that this book will help to demystify t h i s important ~echno~ogy.
The book i s organised in three main sections (Figure 1.1). We deal first with the fun~amental concep~s of digital video, image and video coinpressioii and the main ~ntema~ioiiai s ~ n d a r d s for video coding (Chapters 2-5). The second section (Chapters 6-9) covers the key con~po-
DEGs in some detail. Finally. Chapters 10-14 discuss system design issues and pr~sent some design case studieh.
igital Video’, explains the concepts of video capture, repres~ritation and s the way in which we perceive visual ~ n f a ~ ~ i i a t ~ o n ; com~ares methods for
rime a ~ p l ~ c ~ t i ~ ~ 1 ~ ~ of digital video. entals’, examines the require
onents of a ‘geneiic’ imag
ids discussing technical or standard-
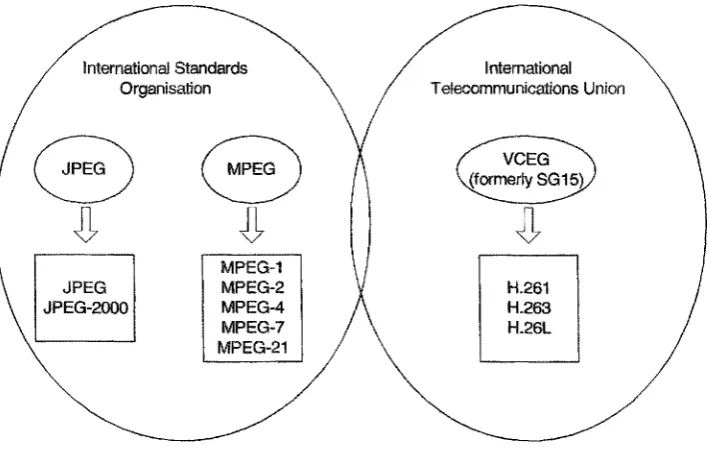
introduces the IS0
STRUCTURE OF THIS BOOK 3
I I I
Section 1: Fundamental Concepts
ecction 3: System Design
- Section 2: Component Design
2 6 3 and H.26L, explajns the concepts of the ZTU-T video coding 63 and the emerging H.26L. The chapter ends with a comparison of
sin image and video coding standards.
imation and Compensation’, deals with the ‘front end’ of a video
.
The requirements and goals of motios~-c(~mpe~sated prediction are explained and ter discusses a number of practical approaches to motion estimation in software or Iiardware designs.Chapter 7, ‘Tr~nsforni Codin , concentrates mainly on tlic popular discrete cosine tr~iiisfor~i~ The theory behind the CT is introduced and practical a9gorilhS for calculallng the forward and inverse scribed. The discrete wavelet transform (an ~ncreasingly popular alternative to th nd the process of quant~sation (closely linked to tra~~sfQrni coding) are discussed.
ntmpy Coding’, explains the statistical c o ~ ~ r e s s i o n process that forms the final step in a video oder; shows bow Huffnim code tables are designed and used; introduces arithmetic ng; and describes practical entropy encoder and decoder designs. Chapter 9, ‘ke- a $1-processing’
.
addresses the important issue of input and output processing; shovcs how pre-filtering can improve compression p e ~ ~ ~ r i ~ a n c e ~ and exarrGnes anumber of post-lillering techniques, from simple de-blocking filters to c o ~ i ~ ~ ~ i t a t ~ o ~ ~ ~ ~ ~ ~ ~
mplexity’, &scusses the relationships bet we^^ corn- utational complcxity in a ‘lossy’ video CBDEC; describes rate control ~ l ~ o r i ~ ~ m ~ for dif~ercnt transm
~ m e r ~ i i ~ g t~ChnkpeS of ~ a r i ~ b ~ c - ~ Q I ~ p ~ e x i t y codi c o ~ ~ i p u r a t ~ o ~ i a ~ complexity against visiial quality.
U€ Coded Video’, addresses the i ~ i ~ ~ e r ~ c ~ of ?he t r ~ ~ ~ m i 5 s i o ~ ~ C design; discusses the quality of service r e q u ~ r e ~ ~ by a video
cal transport sccnanos; and examines ways in which quality of service can be ‘matched’ between the C DEC and the rretwork to ~ i ~ x i I ~ ~ s c visual quality.
er 12, * ~ ~ a t f ~ ~ ~ s ~ ~ describes a Limber of altexnative latfmns for i ~ ~ ~ e ~ e n ~ i n g 1 video CODECs, ranging from general-purpose PC p essm s LO c ~ s ~ ~ ~ ~ ~ - d e s ~ g i ~ e d h ~ ~ r ~ w a r e platforms.
C ~ a p ~ e r 13, ‘Video C DEC Design’, brings together a number of the themes d ~ ~ c i ~ s s e d in preI1ious chapters and d w s e s how they iriflaience ilie design of video CODECh; exmines the interfaces between a vi DEC and olher system c o m p ~ i ~ e n ~ s ; and presents two
design studies, a software and a hardware CODEC.
Chapter 14, ‘Future s’, summarises mi le ofthe recent work in researcIi and e v ~ l ~ p ~ e n t that will influence the next generation of video C
Each chapter includes &ereiices to papers and websites that are relevant LO the topic. Thc
i b ~ ~ ~ ~ ~ r a p h ~ lists a number of books that may be iiseftil for further reading and a c o ~ i ~ ~ ~ ~ o n web site to the book may be found at:
Digital video is now an integsal part of many aspects of business, education and entertain- ment, from digital TV to web-based video news. Before examining methods for CoI~ipressing and transporting digital video, it is necessary to establish the concepts and terminology relating to video in the digital domain. Digital video is visual information represented in a discrete form, suitablc for digilal electronic storage and/or traismission. In this chapter we describe and define the concept of digital video: cssentially a sampled two-dimensional (2-D) version oE a continuous three-dimensional (343) scene. Dealing with colour vidco requires us to choose a colour space (a system for representing colour) and we discuss two widely used colour spaces, RGB and YGi-Cb. The goal of a video coding sj’stein i s to support video communications with an ‘acceptable’ visual quality: this depends on the viewer’s perception of visit& information, which in turn is governed by the behaviour of the human visual system. Measuring and quantify in^ visual quality is a difficult problem and we describe some alternative approaches, from time-consuming subjective tests to automatic objective tests (with varying degrees of accuracy).
e
A video image is a projection of a 3-D scene onto a 2-D plane (Figure 2.1). A 3- consisting of a number of objects each with depth, texture and illumination is projected onto a plane to form a 2-D representation of the scene. The 2-D representation contains varying texture and illumination but no depth information. A still image i s a ‘snapshot’ of the 2-’h) representation at a particular instant in time whereas a video sequence rcpresents the scene over a period of time.
---
---
.I Projection of 3-D scene onto a .ride0 image
Spatial aud temporal satnpliiig
images or frarneb sampled a1 regular intervals in time) as shown in Figure 2.2. Digital video is the representat~on of a spatio-teinpo~a~ly sampled video sccne in digital form. Each spado- temporal sample (described as a picture element or pixel) is ~ e p r e s e ~ i t ~ ~ digitally as OIIC or inore numbers chat describe the brightness (luminance) and colour of the sample.
A digital video systein is showii in Figure 2.3. At the input to the system, a 'red' visual scene is captured, typically with a camera and converted to a sampled digital representation.
Digital domain
/-
---\C ~ N CCAPTURE ~ ~ ~A N D , DISPTAY 7
This digital video signal may then be h
i n c ~ ~ d i ~ g processing, storage and ~ r a n s ~ ~ s s ~ o i i . At
signd is displayed to a viewer by reprod~icirig the 2-D display.
ed in the digital domain in a nunlber of ways, output of the system, the digital video video irnage (or video sequence) on a
Video is captured using a camera or a system of cameras. video, captured with a single camera. The came video scene onto a sensor, such as an array trf charge coup
[image:18.428.134.303.496.591.2]case of colo~ir image c each colour component (see Section 2.5) is filtered md p r o ~ ~ c ~ e d onto a sepslral
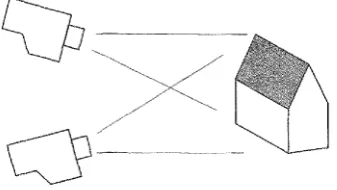
Figure 2.4 shows a two-camera system that captures two 2-2) projections of the scene, taken from different viewing angles. This provides a stereoscopic repr~sentation of the scene: the two images, when viewed in the left and right eye of the viewer, give an aractce of "depth' to the scene. There i s m increasing interest in the use of 3-D digital
, where the video signal i s represe~ited and processed in three ~imeiisions. This ~ e q ~ i ~ r e s the capture system to provide depth i ~ f o r ~ i a t i o n as well as brightness and colour, and this
may he obtained in a ~iu~nbes of ways. oscopic images can be processed to extract a p p r ~ x i I ~ a t e ~ ~ p t h ~ n f ~ ~ a t ~ o n and form a represen~a~i(~ii of the scene: other ine~hods of ~ b t a ~ n i n g depth i~~fornlation include processing of multiple images from a single canie~a (where either the camera OS the objects in the scene are nioving)
ing' to obtain depth maps. In this book we will c o ~ c e n ~ ~ t e on
~ ~ n e r a t i ~ ~ g a digital ~e~?r~sentation of a video scene can he considered in two stages: 'sition (converting a projection of the scene into an electrical signal, for exaniple via a array) and d i g i ~ i s ~ ~ ~ ~ ~ n (sampling the projection spatially and t e ~ p o ~ ~ l l y and convest-
ing each sample to a n u ~ b e ~ or set of numbers). Digitisation may be carried out using a separate device or board (e.g. a video capture card in a PC): increasingly, the digitisaiion process is becoming integrated with cameras so that the output of a camera is a signal in sampled digital form.
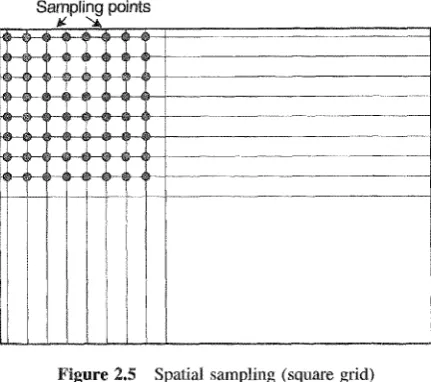
A digital image may be generated by sampling an aiialogue video signal (i.e. a varying electrical signal that presents a video image) at regular intervals. The result is a sampled
Figure 2.5 Spatial sampling (square grid)
version of the image: the sampled image is only defined at a series of regularly spaced sampling points. The most common format for a sampled image is a rectangle (often with width larger than height) with the sampling points positioned on a square grid (Figure 2.5). The visual quality of the image is influenced by the number of sampling points, More sampling points (a higher sampling resolution) give a ‘finer’ re~resentation of the image: however, more sampling poiiits require higher storage capacity. Table 2.1 lists some cominoiily used image resolutions and gives an approximately equivdent analogue video quality: VHS video, broadcast TV and high-definition TV.
[image:19.428.105.321.53.244.2]A moving video image is formed by scampling the video vignal temporally, taking a rectangular ‘snapshot’ of the signal at periodic time intervals. Playing back ihe series of frames produces the illusion of motion. A higher temporal sampling rate @ame rate) gives a ‘smoother’ appearance to motion in the video scene but requires more samples to be captured and stored (see Table 2.2). Frame rates below 10 frames per second are sometimes
Table 2.1 Typical video image resolutions
Jiiiage resolution Number of sampling points Analogue video ‘equivalent‘
352 x 288 101 376 VHS video
704 x 576 405 504 Broadcasl television
1440 x 1152 1313 280 ~ i ~ h - ~ e ~ n i ~ i o n television
2 Video frame rate%
Video frame rate Appearance
--
Below 10 frames pcr second10-20 frames per second 20-30 frames per second 50-60 frames per second
‘Jerky’, unnatural appearance to movement
Slow movemcnts appear OK. rapid movement is clearly ‘jerky’ Movement is reasonably smooth
Movement i s very smooth
CONCEPTS, CAPTURE AND DISPLAY
I
I
Complete frame
uscd for very low bit-ratc video c ~ ~ ~ ~ ~ i ~ ~ L ~ n i c a ~ o I i s (bemuse the ainorrnt OF data is relatively small): however, ~ o ~ i o 1 ~ is clemly je
er secovrd i s more typical for I second js standard far televisio
and u nn atu r ~~~ ai thih rate. t-rate video c o n i ~ ~ u ~ i c a t ~
(together with the use of ter'iacing, see below); 50 r Iii~h-~LiaIity video (at e x l ~ e ~ s e of a very Ixgh The visual appeamnce of a tetmrgaordly sampled video sequence can he improved by using
y used for ~ ~ ~ ) a ~ c ~ s t - q r r a ~ i t y ~ e ~ e v ~ s ~ o i i signals. Fox c x ~ ~ ~ l e , the ard operates at a brnporal frame ratc of 25 Hz (Le. 25 COI
er. in order CO improve the vimd ~ i ~ p e a ~ ~ ~ ~ c ~ without
ence i s composed offields at a rate of 50
the lines that make up a complete frame the odd- and e v ~ ~ - ~ u i ~ b ~ ~ e d lines from the frame on the left are pluccd in
i ~ ~half the ~ ~ f o r m a ~ ~ o n a i ~ ~ ~of a cornpkte franc. These fields ~ ~ ~ at ll50th of a second intervals and the result is an update rate o
the data rate of a signal ;at 25 Hz. Video that i s captured and displayed in this way is krrowri as interlaced video and geri~~ally has a more p l e a ~ i n ~ visual a p ~ e a r a ~ ~ e than: video ~ r a ~ ~ ~ i t ~ ~ d as complete frames ~ ~ ~ i ~ - ~ ~ t e r ~ a ~ e ~ or progressive video). ~ n ~ e r ~ a ~ e ~ video c'm, however, produce ~i~ipleasant visual artefacts iyhen displaying certain textures or types of moti 011.
DlClTAL VIDEO
Phosphor coating
i s ~ o r i ~ e ~ by scanning a r n o ~ u ~ a t ~ ~ be‘m of electrons across a p h ( ~ ~ p 1 i ~ ~ r e s c e ~ ~ t screen ( ~ i ~ u r e
e and reasombtbly cheap to produce. However, B CRT sclffers
rovide a ~ ~ ~ ~ ~ i e n t l y long path for the e l e c ~ o n bemi nt’ the vacuum tube. Liquid crystal
becoming a popular alternative to the CKF for computer app~icatjo1~~ other alter~ia~ives such as flat-panel plasma displays are b e ~ i I ~ n i n ~ to emerge b
~~~e (‘grey scale’) video image may be re r e s e n ~ e ~ using just one nuin ~ ~ o - t ~ ~ ~ ~ p o r a ~ sample.
iti on: cnnv enti cmally
s number indicates che ~ ~ ~ ~ I i ~ i ~ s s or lurnin larger number in~icates a b ~ i ~ h t e r sani
n bits, then a value of 0 Inay represent black and
s a ~ ~ p ~ e for ‘ g ~ ~ e ~ a ~ - p u ~ p o s e
ce of each sample
ions (such as digihing of X-ray slides),
systems for ~ e p r e s e n t ~ 1 ~ ~ colour, each o f which is known as a colour space.
trate colour spaces for digital irnagc and
tion: ( r e ~ g r e e ~ / ~ l u e ) and b ( l u r n i n ~ i ~ e / r ~ ~ c ~ o ~ n ~ ~ ~ ~ e / b l ~ e
~ ~ e s e n t ~ n ~ ~ 0 1 0 ~ ~ . rcquires multiple f l ~ b e ~ s per sample. There are several ~ ~ ~ e ~ ~ ~ a ~ v ~
COLOUR SPACES
In the s e ~ g r e e ~ b l ~ i e colour space, each pixd is represented by three numbers indicating the relative proportkms of red, green and blue. These are the three additive primary colours of light: any colour may be reproduced by combining varying proportions of red, green and ecause the three coniponents have roughly equal importance to the final colour, GB systems usually represent each component with the same precision (and hence the same number of bits). Using El bits per component is quite common: 3 x 8 = 24 bits are required to represent each pixel. Figure 2.8 shows an image (originally colour, but displayed here in monochrome!) and the brightness 'maps' of each of its three colour components. The gir1.s cap i s a bright pink colour: this appears bright in the red component and slightly less bright in the blue component.
1
cienr represen~a~ion o f colour. The liiainan visu ection 2.4) is less sensitive to colo
our space clocs not provide at] easy
an to lurminance ~ b ~ ~ ~ h ~ ~ e s s ) : however,
to take a d ~ a ~ t a ~ e of chis since the three colours arc e ~ u a ~ ~ ~ ~ n ~ ~ o i ~ a ~ i t and the ~ u n i i n a ~ ~ e is present in all three colour c o ~ i i ~ o i ~ e ~ ~ s . It
o represent a colour image inore efficiently by s ~ ~ a ~ a t i n ~ the luriiinaiicc from the
A ~ ~ p ~ ~ a r CQ~OIK space of this type is V: Cr. Cb.
COLOUR SPACES 13
where k are weighting Factors. The colour information can be rcpresented as rolnur d@erePzce or ehrominume components, where each chrominance component is the differ-
, G or B and the luminance Y
C r = R - Y C b z B - Y
C g = G - Y
The complete description is given by Y (the luminance component) and three colour differences Cr, Cb and Cg that represent the ‘variation’ between the colour intensity and the ‘background’ luminance of the image.
So far, this representation has little obvious merit: we now have four components rather than three. IFiOwever, ir turns out that the value of Cr
+
Cb+
Cg is a conslant. This means that only two of the three chrominance components need to be transmitted: the third c o ~ p o n e n t can always be found from the other two. In the Y: Cr : Cb space, only the luminance (Y) and red and blue chrominance (er, Cb) are transmitted. Figure 2.9 shows the effect of this operation on the colour image. The two chrominance components only have sigriificant values where there is a significant ‘preseuce’ or ‘absence’ of the appropriate colour (for example, the pink hat appears as an area of relative brightness in the red chro~~inance). image into the Y: Cr : Cb colour space and vice versa are given in Equaticms 2.1 and 2.2. Note that G can be extracted from the Y: Cr : Cb representation by subtracting Cr and Cb (iom Y.The equations for converting an RG
Y 0.299 R
+
0.587 G -t 0.1 14 l3Cr = 0.71 3 (R - U)
= Y
+
1.402CrG = Y - 0.344Cb - 0.714Cr
= Y
+
1.772ChThe key advantage of Y:Cr:Cb over RGB is that the Cr and Cb components may be represented with a lower resolution than Y because the HVS is less sensitive to colour than luminance. This reduces the amount of data required to represent the chrominance components without having an obvious effect on visual quality: to the casual observer, there is no apparent difference between an GB image and a Y : Cr : Ch image with reduced chrominance resolution.
1 DICTTAI. VIDEO
(a) Luininaiicc, (h) Cr, (c) Cb comporients
samples inIhe horizontal direction there are 2 Cr and 2 Cb samples) and the locations of llie samples illre shown in thc figure. 4 : 2 : 2 video is used for high-qi~ality colour- reprod~iction.
COIBIJR SPACES
0
0
0
0
0
0
0
0
0
0
0
0
O O O C )
4:4:4 4:2:2 4:2:0
0
Y sample Cr sampleCb sample
Chrominance subsampling patteins
particular sampling pattern. 4 : 2 : 0 sampling is popular in 'mass market' digital video applications such as video conferencing, digital television and DVD storage.
colour differ~~ice cornponelit contains a quarter of the samples of the Y conip video requires exactly half as many samples as 4 : 4 : 4 (or
K
: G :Image resolution: 720 x 576 pixels
Y resolution: 720 x 576 samples, each represented with 8 bits 4 : 4 : 4 Cr. Cb resolution: 720 x 576 samples, each 8 bits
Total nniiiber of bits: 720 x 576 x 8 x 3 = 9 953 280 bits 4 : 2 : 0 Cr, Cb resolution: 360 x 288 samples, each 8 bits
Total number of bits: (720 x 576 x 8) -I- (360 x 288 x 8 x 2 ) == 4 976 640 bits The 4 : 2 : 0 version requires half as many bits as the 4 : 4 : 4 version
To further confuse things, 4 : 2 1 0 sampling i s sometimes described as ' I2 bits per pixel'. The
reason for this cm be illustrated by examining a group of 4 pixels (Figure 2.1 I). The left- hand diagram shows 4 : 4 : 4 sampling: a total of 12 samples are required, 4 each of Y. Cr and Ch, requiring B total of 12 x 8 = 96 bits, i.e. an average of 9614 = 24 bits per pixel. The right-hand diagram shows 4 : 2 : 0 sampling: 6 samples are required, 4 Y and one each of Gr, Cb, requiring a total o f 6 x 8 = 48 bits, i.e. an average of 4814 = 12 bits per pixel.
0
0
0
1 DIGITAL VIDEO
brain
F i2.12 ~ HVS ~ components ~ ~
A critical design goal for a digital video system is that the visual iiiiages produced by the system should be ‘pleasing’ to the viewer. In order to achieve this goal it is necessary to take into account the response of the human visual 8ystem (HVS). The HVS is che ‘system’ by which a human observer views, interprets and responds to visual stimuli. The main components of the HVS are shown in Figure 2.12:
Eye: The irnage is focused by the lens onto the photodetecting area of the eye, the retina. Focusing and object tracking are achieved by the eye muscles and the iris controls the aperture of the lens and hence the mount of light entering the eye.
Retina: The retina consists of an array of cones- (photoreceptors sensitive to colour at high light levels) and rods (photoreceptors sensitive to luminance at low light levels). The morc sensitive cones are concentrated in a central region (the fovea) which means that high-resolution colour vision is only achieved over a small area at the centre of the field of view.
Optic nerve: This carries electrical signals from the retina to the brain.
Brain: The liuwdn brain processes and interprets visual i i ~ ~ o ~ a ~ i o n ~ based partly on the received inforniation (the image detected by the retina) and partly on prior learned responses (sucli as known object shapes).
The operation of the VS is a large and complex area of study. Some of the important features of the NVS that have implications for digital video system design are listed in Table 2.3.
7
,3 Features 13 the FlVS
-
Feature
The HVS i s inore sen5itive i o luminance detail
Implication for digital video qy5tcms
l__-.l_l~ll
Colour (01 chrommance) resolution tnay be reduced without significantly affecting image quality
Large changes in luminance (c,g. edges i n
an imagc) are particularly important 10 the appearance of the image
It may be possible to cornprms imagcs by discarding honie of the less important highcr frequencies (however, edge information should bc preserved) than to colour dciail
The FEVS i s more sensitive to high contrast (i.e. large &fference\ in luminance) than low contrast
The W S is more sensitivc to low spatial
frequencies (i.e. changes in luminance that occur over a large area) than high spatial frequencies {rapid changes that occur h a S l l l d ~ area)
that persist for a long duration
The illusion of ‘sniooth’ motion can be achieved by presenting a series o f images at a rate of 20-30 H L or more
individual
VS is more sensitive to image katuve5 It I:, important to minmise temporally penistent Video systems should aim for frame repetition
disturbances or artefacla in an image
rates of 20 Hz or more for ‘natural’ moving video
the quality of a video system
HVS responses vary from individual to Multiple observers should be used to assess
~ e a s L ~ r i n g visual quality u\ing objertive criteria gives accurate, repeatable results, but as yet there are no objective measurement systems that will completely reproduce the subjective experience of a hunian observer watching a video display.
~t procedures for subjective quality evaluation are defined i n ZTU- 500-10.’ One of the
quality scale (DSC
t popular of these quality measures is the method. An assessor is presented with a p short video sequenccs A and B, one after the other, arid is asked to give A an marking on a continuous line with five intervals. Figure 2.13 shows an exam form on which the assessor grades each sequence.
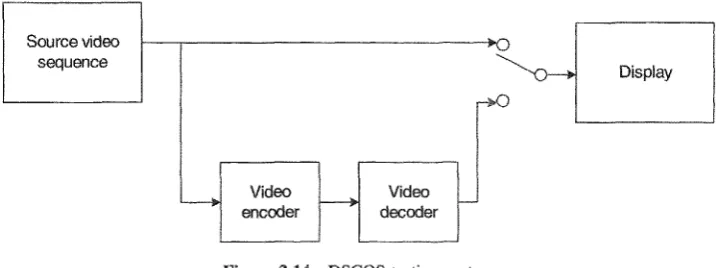
In a typical te ’on, the assessor is shown a series of sequence pairs and is asked to grade each pair. each pair of sequences, one is an unimpaired ‘reference’ sequence and the other is the same sequence, modified by a system or process under test. A typical example from the evaluation of video coding systems is shown in Figure 2.14: th
sequence is compared with the same sequence, encoded and decoded using a video
1
Source video
DIGITAL VIDEO
I
Test 1 lest 2 Test 3
A B A B A B
Excellent
Good
Fair
Poor
Bad
Figure 2.13 DSCQS rating form
The DSCQ§ lest i s generally accepted as a realistic measure of subjective visual quality. However, it suffers from practical problems. The results can vary significantly, depending on the assessor and also on the video sequence under test. This variation can be compensated for by repeating the test with several sequences and scveral assessors. An ‘expert’ assessor (e.g. one who i s f d l i a r with the nature of video compression distortions or ‘artefacts9) may give a hiased score and it is preferable to use ‘non-expert’ assessors. In practice this means that a large pool of assessors i s required because a non-expert assessor will quickly l e m to recognise characteristic artefacts in the video sequences. These factors make it expensive and time-consuming to carry out the DSCQS tests thoroughly.
A second problem is that this test is only really suitable for short sequences of video. It has been shown2 thnt the ‘recency effect’ nieans that the viewer’s opinion i s heavily biased towards the last few seconds of a video sequence: the quality of this last section will strongly influence the viewer’s rating for the whole of a longer sequence. Subjective tests are also i n ~ ~ e n c e d by the viewing conditions: a test carried out in a comfortable, relaxed environ- ment will earn a higher ratjng than the same test carried out in a less comfortable setting.
sequence
I
Video
[image:29.428.78.335.48.251.2] [image:29.428.35.397.468.602.2]encoder
VIDEO QUALITY 19
ec
ecause of the problems of subjective measurement, developers of digital video systems rely heavily on objective measures of visual quality. Objective measures have not yet replaced subjective testing: however, they are considerably easier to apply and are particularly useful during development and for comparison purposes.
Probably the most widely used ective measure i s peak signal to noise ratio (PS calculated using Equation 2.3. RS s measured on a logarithmic scale and is based on the mean squared error (MSE) between an original and an impaired image or video frame, relative to (2“ - 1)’ (the square of the highest possible signal value in the image).
(2” - 1jz MSE
can be calculated very easily and is therefore a very popular quality measure. It i s
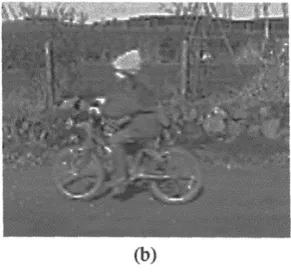
used as a method of comparing the ‘quality’ of compressed and decompressed video images. Figure 2.15 shows some examples: the first image (a) is the original and (b), (c) and (d) are compressed and decompressed versions o f the original image. The propessively poorer image quality is reflected by a c o ~ e s ~ o n d i ~ g drop in PSNR.
‘unimpaired’ original image for comparison: this may not be available in every case and it may not be easy to verify that an ‘original’ image has perfect fidelity. A more important limitation is that PSNR does not correlate well with subjective video quality measures such
The PSNR measure suffers from a number of limitations, however, PSM
iven image or image sequence, high PSNR indicates relatively indicates relatively low quality. However, a particular value of P does not necessarily equate to an ‘absolute’ subjective quality. For example, Figure 2.16 shows two impaired versi the original image from Figure 2.15. Image (a) (with a b ~ u ~ ~ d ~ a c k g r o ~ ~ d ) has a of 32.7 dB, whereas image (b) (with a blurred rore~ound)
ost viewers would rate ininge (b) as significantly poorer measure simply counts the mean squared pixel errors and d as ‘better’ than image (a). This example sl-rows that by this method image (
PSNR ratings do not necessarily ctmelate with ‘true’ subjective quality.
more sophisticated objective test that closely approaches subjective test results. different approaches have been proposed,3-’s but none of these has emerged as clear alternatives to subjective tests. With improvements in objective quality medsur~nient, however, some interesting applications become possible, such as proposals for ‘constant-
500- 10 (and more recently, P.910) describe standard methods for subjective quality evaluation: however, as yet there is no standardiwd, accurate system for objective (’automatic’) quality measurement that is suitable for digilall y coded video. In recogni- tion of this, the ITU-T Video Quality Experts Group (VQEG) arc developing a standard for objective video quality evaluation7.
me
first step in tiiis process was t o test and com- pare potential models for objective evaluation. In March 2000, VQEG reported on the first round of tests in which 1 0 competing systems were tested under identical conditions.Because of these problems, there has been a lot of work in recent years to try to dev
DIGITAL VIDEO
VIDEO QUALITY
re 2.15 (Continued)
DIGITAL VIDEO
STANDAKDS FOR R ~ P RDIGITAL ~ SVIDEO ~ ~ ~ 23
Fields per second 60 5 0
Lines per complete frame 525 625
Bits per mnple 8
x
Active lines per frame 480 576
Active samples per line (U) 720 720
Luminance samples per line 858 864
Chroniinance samples per line 429 432
Total bit rate 21GMbps 316Mbps
Active wnples per line (Cr. Cb) 360 360
~nf o rt un a te l ~, none of the 10 proposals was considered suitable for stand~disat~on. The problem OS accurate objective yuality rneasurenient is therefore likely to remain for some
time to come.
measure is widely used as an approximate objective measure for visual quality and so we will use this measure for quality coiiiparison in this book. However, it is worth rememl~ering the limitations of PSNR when compaiiiig different systenis and techniques.
for ciigitally coding video signals for lclevision production is ITU- 601-5“ (the lcnn ‘coding’ in this context means conversion to digital
compression). ‘The luminance component of the video signal i s
the chrominmce at 6.75 MHz to produce a 4 : 2 : 2 Y : e r : Cb ameters of the sampled digital signal depend on the video frame nd are shown in Table 2.4. It can be seen that the higher 30 Frame rate is compensated for by a lower spatial resolution so that the total bit rate is the same in each case (21 6 Mbps). The actual area shown on thc display, the acfive area, is smaller than the totd hecause it excludes horizmtal and vertical blanking intervals that exist ‘outside’ the edges o i the frame. Eaci sample has a possible range of 0-255: however. levels
of 0 aid 255 are reserved for synchronisation. The active lunrinance signal i s restricted to a range of 16 (black) to 235 (white).
For video codiiig applications, video is often converted to one of R nuniber of ‘intermediate formats’ prior to cornpression and transmission. A set of popular frame resolutions is based around the common intermediate format, CIF, in which each frame has a R e ~ o m ~ e n d a t i
format and does
Fomat Luminance resolution (horiz. x vert.) st1b-QC1F
Quarter CIF (QCIF) CIF
4CIF
24 DIGITAL VIDEO
4CIF 704 x 576
CIF 352 x 288
QClF 176 x 144
_I
igure 2.1’3 Intermediate formats (illustration)
resolution of 352 x 288 pixels. The resolutions of these formats are listed i n Ttihlc 2.5 and their relative d i ~ e n s i o ~ i s are illustrated in Figure 2.17.
The last decade has seen a rapid increase in applications for digital video technology and new, i n n o ~ ~ t ~ ~ ~ e ap p l ic at ~o i ~~ continue to emerge. A small selection is listed here:
Home video: Video camera recorders for professional atid home use are increasingly moving away from analogue tape to digital media (including digital storage on tape and on solid-state media). Affordable DVD video recorders will soon be available for the home.
Video sfomge: A variety of digikl formats are now used for storing video on disk, tape and coinpact disk or DVD for business and home use, both in c~)mpressed and uncompressed form.
Video conjkrencing: One of the earliest applications for video compression, video conferencing facilitates meetings between p ~ t i ~ ~ p a n t ~ in two or inore separate locations.
Video teleplzorzy: Often used interchangeably with video conferencing, this usually means a face-to-face discussion between two parties via a video ‘link’.
SUMMARY 5
video i s seen as an important component of this in the form of stored video material and video conferencing.
Remote mei.licirze: Medical support provided at a distance, or ‘telemcdicine’, is another potential growth area where digital video and images may be used together with other ~ ~ ( ~ n i t o ~ n g techniques to provide medical advice at a distance.
T‘kvision: Digital television is now widely available and many countries have a t h e -
table for ‘switching off” the existing analogue television service. Digital TV is one of the most important mass-market applications for video coding and compression.
Video procluction: Fully digital video storage, editing aiid production have been widely used in television studios for inany years. The requirement for high image tidelity often mealis that the popular ‘lossy’ compression methods described in this book are not an option.
Gunzes and erifer~~~in~ien~: The potential for ‘real’ video imagery in the computer gaining
market is just beginning to be realised with the convergence of 3-D graphics and ‘natural’ video.
.1
~ e v e ~ o p e r ~ are targeting an increasing range of platforms to run the ever-expanditi~ list of digital video applications.
~ e ~ i~ ? l ~ t ~ o r ~ ~ s ~ ~ iare designcd ~ e ~ to suppost a speciiic video application and no other. Examples include digiral video cameras. dedicated video conferencing systems, digital T V set-top boxes and DVD players. hi the early days, the high processing deimnds of digital video meant that dedicated platforms were the only practical design solution.
platforms will continue to be important for low-cost, mass-market syrtem increasingly being replaced by more flexible solutions.
The PC has emerged as a key platform for digital video. A continital. increase in PC processing capabilities (aided by hardware enhancements for media applications such as the instructions) means that it is now possible to support a wide range of video applications from video editing to real-time video con€erencing.
~~~e~~~~ pla~fuforms are an important new market for digital video techniques. For example, the personal communications market is now huge, driven mainly by users of mobile felephoiies. Video services for mobile devices (running on low-cost embedded processors) itre seen as a major potential growth area. This type of platform poses many
challenges for application developers due to the limited processing power, relatively poor wireless comm~nicatioti~ cliannel and the requirement to keep equipment and usage costs to a mlnimum.
Sampling of an analogue video signal, both spatially and temporally, produces a digital video signal. Representing a colour scene requires at least three separate ‘coinponents’ :
2 DIGITAL VIDF,O
of quality). The human observer’s response to visual i n ~ o ~ a t i o n affects the way we perceive video quality and this is notoriously difficult to quantify accurately. Subjective tests (involving ‘real’ observers) are time-consriming and expensive to run; objective tests range from the simplistic (but widely used) PSNR measure to complex models of the human visual system.
The digital video applications listed above have been made possible by the development of c o n ~ p ~ e s s ~ o n or coding technology. In the next chapter we introduce the basic concepts of video m d image compression.
1. ~ecominei~dation ITIJ-T BT.500-10, ‘Methodology for the subjective assessment o f the quality of
televiwn pictures’, ITU-T, 2000.
2. R Aldridge, J. Dawdoff, M. Ghanbari, D. Hands and D. Pearson, ‘Subjective assesrment of time- varying coding distortions’, Proc. PCS96, Melbourne, March 1996.
3. C. J. van den Branden Lambrecht and 0. Verscheure, ’Perceptual quality meawre using a spatio- temporal model of the Fluman Visuiil System’, Digztal Bdeo Uoniprei rcon Algorithnzs and Tcch-
iiol(y$ey, Pmc. S H E , Vol. 2668, San Jose, 1996.
4. IT. Wtt, Z. YLI, S. Winkler and T Chen, ‘Impairment rnetrics for ~ C / ~encoded P digital ~ ~ ~ - ~
video’, Proc. PCSOI, Seoul, April 2001.
5. K. T. Tm and M. Ghanbari, ‘A multi-mehnc objective picture c~~lality measurement model for MPBG
video’, IEEE Trurzr. CSVT IQ(?), October 2000.
6. A. Basw, 1. DalgiG, F. Tobagi and C. J. van den Branden Lambreeht, ‘A feedback control scheme for
low latency constant quality MPEG-2 video encoding’, Digitul Coriprpvusrion Zechnologies a i d
Systems for Video Cornmlmicntiorzc, Proc. SPfE, Vol. 2952, Berlin, 1996. I. h ~ t ~ : / / w ~ w . v q e g . o r ~ i [Video Quality Experts Groupl.
8. Recommendation ITU-R DT.601-5, ‘Studio encoding parameters of digital television for staiidard
~ e p r e s e n t ~ ~ ~ g video material in a digital form requires a large number of bits. The volume of data generated by digitising a video signal i s too large for most storage and ~~ansmission sysiems (despitc the contitiual increase in storage capaciky and transmission ‘balldwidth’). This means that compression is essential for most digital video applications.
The ITU-R 601 standard (described in Chapter 2) describes a digital fonnat for video that is roughly equivalent to analogue television, in terms of spatid resolution and frame rate. One channel ctf ITU-R 601 television, broadcast in uncompressed digital form, requires a trmsmission bit rate of 216Mbps. At this bit rate, a 4.7Gbyte DVD could store just 87 seconds of uncompressed video.
Table 3.1 shows the uncompressed bit rates of several popular video formats. Froin this table it caii be seen that even Q C F at 15 frames per second (i.e. relatively low-quality video. suitable for video telephony) requires 4.6 Mbps for tranmission or storage. Table 3.2 lists typical capacities of popular storagc media and transmission networks.
There is a clear gap between the high bit rates demanded by uncompressed video and the available capacity of current networks and storage media. The purpose of video compression (video coding) is to fill this gap. A video compression system aims to reduce the amount of data required to store or transmit video whilst maintaining an ‘acceptable’ level of video quality. Most of the practical systems and standards for video compression are ‘lossy’, i.e. the volume of data is reduced (compressed) at the expense of a loss of visual quality, The quality loss depends on many factors, but in general, higher compression results in a greater loss of quality.
.I Uncompressed bit rates
~ ____
Luminance Chroniinance Frarries per Bits per second
Foimat resolution resolution second ~ u n e o m ~ r e ~ s e ~ ~
ITU-R 001 8% Y 525 429 x 525 30 2 I6 Mbps
CIF 352 x 288 176 x 144 30 36.5 Mbps
88 x 72 15 4.6 Mbps
QCIP 176 x 144
asl
ble 3.2 Typical transinissioiil storage capacities
Media I network CaDllcitv
Ethernet LAN (10 Mbps) ADSI,
LSIIW-2
- _ _ _ - M ~ x . 10 Mbp\ I TypICd 1-2 Mbps
Typical 1-2 Mbps (downstream) 128 kbps
V.90 modem
DVD-5 4.7 Cbytes
CD-ROM 640 Mbytes
56 khps downstream / 33 kbps upstream
h bandwidths, compression caii support a much higher visual quality. For can store approximately 2 hours of imcoiiipressed Q C F video (at frames per second) or 2 hours of conipressecl ITU-R 601 video (at 30 frames per second). ost users would prefer to see ‘telcvision-qua~ity’ video with smooth. motion rather than ‘postage-stamp’ video with jerky motion.
Video compression and video CODECs will therefore remain a vital part o f the emerg- ing ~ n u l t i m e ~ a industry for the foreseeable future, allowing designers to make the most efficient use of available transmission or storage capacity. In this chaprer we introduce lhe basic components of an image or video compression system. We begin by defining the concept of an image or video encoder (compressor) and decoder (d eco~ p r~ ssor ). We tbcn describe the main functional blocks of an image encoder/decoder (CODEC) and a video
InTornnPrion-carrying signals may be compressed, i.e. converted to a representation or fonn that requires fewer bits than the original (uncompressc~) signal. A device or program that compresses a signal is an encoder and a device or program that decoinpresses a signal i s a
dec(i&r. An e r ~ ~ ~ d e r / ~ ~ ~ o d e r pair is a CODEC.
[image:39.428.29.399.57.131.2]IMAGE AND VIDEO COMPRESSTON 2
Decoded signal Original
signal
i g ~ r e 3.1 Source coder, channel coder, channel
General-purpose compression CEIDECs are available that are designed to encode and compress data containing stutistical redundancy. An i n f o ~ a t i ~ n " c a i ~ i n ~ signal usually contains redundancy, which means that it may (in theory) be represented in a more compact way. For example, characters within a lext file occur with varying frequencies: in English, the letters E, T and A occur more often than the letters Q, Z and X. This makes it possible to compress a text file by representing frequently occurring characters with short codes and infrequently occurring characters with longer codes (this principle is used in ~ u ~coding, a n
described in Chapter 8). Compression i s achieved by reducing the statistical re~Lindancy in the text file. This type o f general-purpose CODEC is known as an entropy CODEC.
Photographic images and sequences of video frames are not amenable to compression using general-purpose ~ O D ~ ~ s . Their contents (pixel values) tend to be highly correlated, i.e. neighbouring pi xels have similar values, whereas an entropy encoder performs best wit11 data values that have a certain degree of independence (decorrelated data). Figure 3.2 illuserates the poor performance of a general-purpose entropy encoder with image data. The original image (a) is compressed and decompressed using a ZJP program to prodiice
3 IMAGE AND VIDEO COMPRESSION FUNDAMENTALS
Original
image I video
Store I transmit
Decoded image I video
e 3.3 Image or video CODEC
image (b). This is identical to the original (lossless cornpression), but the compressed file is only 92% of the size of the original, i.e. there is very little compression. h a g e (c) is obtained by comprcssing and decompressing the original using the JPEG compression method. The compressed version is less than a quarter of the size of the original (over 4 x compression) and the decompressed iniage looks almost identical to the original. (It is in fact slightly ‘degraded’ due to the lossy compression process.)
ln this example, the JPEG method achieved good comprcssion ~erforinance by appl y ~ n g a source model to the image before compression. The source model attempts to exploit the properties of video or image data and to represent it in a form that can readily be compressed by CUI entropy encoder. Figure 3.3 shows the basic design of an image or video CO consisting of a source model and an entropy encoder/decoder.
Images and video signals have a number of properties that rnay be exploited by source models. ~ e i g h b o u ~ i i i ~ samples (pixels) within an image or a video frame tend to be highly correkzted and so there is significant spatial redundancy. Neighbouring regions within successive video frames also tend to be highly correlated (temporal redundancy). As well
as these ~ ~ a t i ~ t i c a ~ properties (statistical r e d u n d ~ c y ) , a source model may take ~ ~ v a ~ t a ~ e of subjec‘tiw redundancy, exploiting the sensitivity of the huinan visual system to various
c h ~ ~ c ~ e r i s ~ i c ~ OS imagcs and video. For example, the HVS is much more sensitive to low frequencies than to high ones and so it i s possible to compress an image by eliminating cerlain high-frequency components. Image (c) in Figure 3.2 was compressed by discarding certain sL~bjectively redundant components of the information: the decoded image is not identical to the original but the infonnation loss is not obvious to the hurnain viewer. Examples of image and video source models include the Following:
IMAGE AND VlDEO COMPRESSION 1
... ..-,
I %
, ,
... ~
1 Previous line of transmitted pixels
I >
, ,
________..-..___.
6 -.Current line of pixels
Pixel to be predicted Figure 3.4 DPCM
becomes inipossible to exactly reproduce the original values at the decoder. DPCM may be applied spatially (using adjacent pixels in tlic same frame) aiidlor temporally (using adjacent pixels in a previous frame to form the prediction) and gives modes1 compr~ssion with low complexity.
The image samples are transformed in to another domain (or representation) and are represented by trnnsfortii ccieljficienrs. In the ’spatial domain’ (i.e. the original foim of the image), samples are highly spdtially correlated. The aim of transform coding i s to reduce this correlation, ideally leaving a small number of visually significant transfornt coefficients (iniportant to the appearance of the original image) and a large number 01‘ insignificant coefficients (char niay be discarded without signi ticantl y afTecting the visual quality of the image), The transform process itself does not achieve compression: a lossy qi~antisation procesq i n which the insignificant coefficients are removed, leaving behind a small niiriiher of ~ i g n i f i c ~ i ~ ~ c~)efficie~ts, usually follows it. Transform coding (Figure 3.5) forms the basis
of most o f the popular image and video comprcssion systems and is described in more detail in this chapter and in Chapter 7.
lJsiiig a similar principle to DPCM, Lhc encoder forms a model of the current frame based on the samples of a previously transmitted frame. The encoder attempts to ‘ cornpensate’ for
motion in a video sequence by translating (moving) or warping the samples of the previously transmi~ted ‘reference’ frame. The resulting mo2.ion-co?nppnsnt~d predicted frame (the model of the current frame) i\ subtracted from the cuixtit frame to produce a residual ‘error’ frame (Figure 3.6). Further coding usually follows motion-compe~lsated pre~ict~on, e.g. transform coding of the residual frame.
32 IMAGE AND VIDEO COMPRESSION FUNDAMENTALS
Motion
Previous frame
~ ~ g u ~ e 3.6 Motion-compensated prediction
se
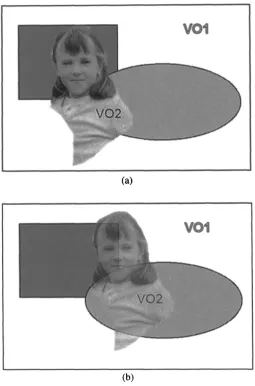
The encoder attempts to create a semantic model of the video scene. for e xmp lc by analysing and interpreting the content of the scene. An example is a ‘talking head’ model: the encoder aiialyses a scene containing a person9s head and shoulders (a typical video c o n ~e r e n c in ~ scene) and models the head as a 3-D object. The decoder maintains its own 3-D model of the head. Instead of transmitting information that describes the entire iniagc, the encoder sends only the animation parameters required to ‘move‘ the model, together with an error signal that compensates for the difference between the modelled scene and the actual video scene (Figure 3.7). Model-based coding has the potential for far greater
model parameters
I I
3-D model 3-D model
c ~ ~ i i i ~ r ~ ~ § ~ o n than the other source models described above: however, the ~ ~ ~ ~ ~ ~ u t ~ ~ ~ ~ ~ n ~ l c o ~ ~ ~ e ~ i t y ~ ~ q u i ~ g d to analyse and ~ y ~ ~ h ~ s ~ ~ e 3- models of a video scene in real time is
very high.
EC g ~ ~ o ~ e s and decod~s single images or incliv
3.8) and may consist of a t ~ u ~ ~ , ~ ~ ) ~ ~ i radr'ng stag
and entropy rodfag.
Encoder
lMAGE AND VIDEO COME’RESSION FUNDAMENTALS
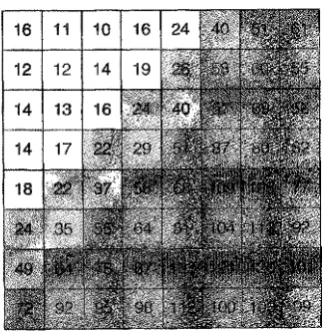
IMAGE CODEC
image samples (a) and the corresponding block of coefficients prodtced by the DCT (10). In the original block, the energy is distrib~ted across the 256 samples and the latter are clearly closely interre~a~ed (correlated). T i i thc coefficient block, the energy is c o n c e n ~ r a ~ ~ d into a few fiigiiificank coefficients (at the top left). The coefficients are decorrelated: this means that the siiialler-~alued coef~cients may be discarded (for example by quai~tisation) without s ~ g ~ ~ f i ~ a n t ~ y affecli~g the quality of the reconstructed image block at the decoder.
The IS x 16 array of coefficients shown in Figure 3.9 reprebent sputialfucquen~.ies in the original block. At the top left of the array are the low-frequency components, representing the ~ r ~ ~ ~ u a l changes of brightness (lum~iiance) in the original block. At the bottom right o f
the array are h ~ ~ ~ - f r e q ~ i e ~ ~ y coniponents and these represent rapid changes in brightness. These ~ r ~c ( ~ m p o n ~ i ~ t s ~ ~ ~are ~ n ~ o ~ o u s ~ ~ cto the components produced by ~ o ~ i r i e r y analysis of a tin~e-vary in^ signal (and in fact the DCT is closely related to the discrete Fourier transform) except that here the components are 2-
.
The example shown in Figure 3.9 is typical for a ~ h o ~ o ~ r a p h ~ c image: most of the coefficients pro~uced by thei i i s i g n i ~ c ~ ~ ~ and can be discarded~ Tliis makes the DCT a powerful tool for image and video c o ~ ~ ~ r e s s i ~ ~ ~
CT i s u s u a ~ ~ y applied to small, discrete blocks of an image, for rcaso~s o l p ~ d ~ t ~ c a l i ~ ~ , In contrast, an image truns$onri may be applied to a complete video image (or to a large ‘tile’
the image). The most popular t~ansforni of this type is the cli,sc.rete wuvelrt
~~~~~~~~~~.
wavelet trans~orm is applied to the original image in order to deco~ipose it into a series d filtered ‘sub-baid’ images (Figure 3.10). Image (a) is processed in a series of stages to ~ r ~ d ~ i c ~ the ‘wavelet ~ ~ c c o r n ~ ~ ) s i ~ i o n ’ image (b). This i s made up of a series of c ~ ) ~ ~ o n e n t s , each c o n ~ ~ i i i i n ~ a subset of the spatial f r e ~ ~ ~ e ~ ~ c i e ~ in the image. At the top left is a low-pass iiltered version of the original and moving to the bottom tight, each component contains vely li~gher-~~equency inrormatiori that adds the ‘detail’ of the image. It i s clear that r - f r e ~ u e n c ~ c ( ~ m p ~ ~ ~ l ~ ~ ~ t s are relatively ‘sparse” i.e. many of the valiies (or ‘coefficients’) in these c o ~ ~ p o n e ~ ~ ~ are zero or insignificant. The wavelet trdiPS~Qni1 i s tlius an ~ f f i ~ i ~ i i t way of ~ e ~ ~ ) i ~ e ~ a t ~ n g or coiicen~rating the important ~ n ~ o i ~ a t i o i i inro a few s i g n i ~ ~ a n t c ~ e ~ f i c i e n ~ s .
The wavelet trabnsfoi-ni i s particularly effective for still image compression and adopted as p a ~ ~ of the ~ ~standard and for ~ still -image ’texture’ coding in the ~ ~ 0 standard. ~ a v c l ~ ~ - b a s ~ ~ c ~ ~ p r ~ s s i o n is discussed further in Chapter 7.
Another image transform that has received much attention i s the so-called frcictal
~ r a ? z ~ ~ ~ ~ r r n . A fractal ~ a i i s f o ~ coder a ~ t e i ~ p t s to represent an image as a set of scaled and led a r ~ ~ i ~ a ~ ~ ‘basis patterns‘. ~racla~-based coding has not, however, shown suffi- ciently good p e ~ ~ ~ ~ ~ i i ~ i i c e 10 be iiicluded in any of the internatioiial slandards for video and image coding and so we will not discuss it i n detail.