AND ITS APPLICATION FOR STUDIES OF FLORAL
DEVELOPMENT
A thesis submitted for the degree of Doctor of Philosophy of the Australian National University
Sri Koerniati
Center for the Application of Molecular Biology to International Agriculture (CAMBIA)
Canberra, ACT, Australia And
Research School of Biological Sciences The Australian National University
Canberra, ACT, Australia
138
Chapter 7
LOSS-OF-FUNCTION PHENOTYPES OF TAFET LINES
7.1 INTRODUCTION
Although the purpose for development of the GAL4NP16 facilitated enhancer
trap population was not to induce gene disruption, lines with mutant phenotypes were
obtained in our experiment, presumably through random insertion of the T-DNA
constructs in the rice genome.
Loss of Function (LoF) mutations have been a major component of functional
genomic approaches and several different technologies using insertional mutagenesis
have been applied with different levels of success in Arabidopsis (Burns et al., 1994;
Pereira, 2000) and in rice (lzawa, 1997; Enoki et al., 1999; Greco et al., 2001 ). It is
clear that functional gene redundancy can limit the efficiency of technologies applied
for inducing mutations. For example, Qu et al. (2003) reported that seven
8owman-Birk inhibitor (881) genes that encode serine protease inhibitors from japonica rice were
in a single cluster on the distal end of the long arm of rice chromosome 1 and two of
those genes (RBBI2-3) had been identified having similar functions to protect rice from
the fungal pathogen Pyricu/aria oryzae. Many genes cloned from mutants belong to
the same gene families, for example the AGAMOUS and other MADS-box genes, and
yet display strong phenotypes (Bouche and Bouchez, 2001 ). Disruption of these genes
is not likely to lead to an easily recognisable phenotype (Burns et al., 1994; Springer,
2000; Bouche and Bouchez, 2001 ). The enhancer trap is one system which is based
upon gene expression, instead of induced mutagenesis, to overcome the ameliorating
The method used to deliver insertional sequence mutagenesis may also affect
the efficiency of gaining mutations (Alonso and Stepanova, 2003). Mutants can also be
induced from routine tissue culture; Palmer et al. (2000) and Peschke et al. (1987)
provided conclusive molecular evidence that transposable elements activation is
responsible for tissue culture-induced mutations in maize.
Hirochika et a/. (1996) found that the transposable element, retrotransposon
Tos17, was highly activated during tissue culture in rice. Retrotransposons are class I
elements that are functionally and structurally different from the DNA transposon
element (class II elements), such as Ac, Ds, Spm, etc. A mechanism of
retrotransposon activation is based on a replicative process, which leads to
proliferation of these elements in the genome, as the "master copy" of the
retrotransposon is not excised from its genome. This propagation is achieved through
an RNA intermediate (Girard and Freeling, 1999). Retrotransposons usually induce a
stable mutation, since they do not have excision capability. Retrotransposons carry
long terminal direct repeats (L TRs) at both ends and an internal domain encoding Gag
and Pol polyproteins. Enhancer-promoter sequences are present on the L TRs and
regulate the synthesis of both the RNA template for reverse transcription and mRNA
required for protein synthesis (Girard and Freeling, 1999). This unique feature of
Tos17 suggested that it could be used for transposon-tagging and reverse genetic
studies in rice.
The reverse genetic studies in rice are important, as a large number of cloned
genes with unknown function have been identified by large scale sequencing of eDNA
(Sasaki et al., 1994, Sasaki and Yamamoto, 1997), including a large set of full length
cDNAs (Kikuchi et al., 2003). In order to identify the insertion sites of transposable
elements or T-DNAs in the gene of interest, a transposable element segment or T-DNA
140
from a large population of mutants as a template (Lee et al., 2003b; Kolesnik et al.,
2004).
This chapter is a report of the mutant phenotypes observed in the TAFET lines
produced in this thesis and attempts to identify at the molecular level the floral
morphological changes observed in the pSKC66.1-8e line.
7.2 MATERIALS AND METHODS
7.2.1 MATERiALS
As described in chapter 3, I produced 1,000 TAFET lines. Of these, eight plants
from each of 270 lines were observed for any phenotypic change in the T1 generation.
Seeds of the pSKC66. 1-8e mutant line were grown and plants of this mutant were
observed in T1 , T2and T3generations.
7.2.2 METHODS
7 .2.2.1 Observation of TAFET lines
All plants of the T1 generation of TAFET lines were observed for any
morphological changes and/or phenotypic changes in vegetative and floral parts.
Flowers of pSKC66.1-8e mutant line were observed using a Leica Wild M8 microscope
or a Leitz Diaplan microscope with bright-or dark-field optics. Images were acquired
with a Nikon CooiPix Digital photo camera. Samples were also observed using a
7.2.2.2 Histological analysis
Histochemical detection of GUS (13-glucuronidase) was performed using fresh
floral parts of the mutant line as previously described (Jefferson et al., 1987). Samples
were viewed using a Leica Wild M8 microscope or a Leitz Diaplan microscope with
bright- or dark-field optics.
7.2.2.3 Southern Blot Hybridisation
Molecular analysis of the mutant lines was carried out using a Southern blot
hybridisation method on T0 , T 2 and T 3 plants. Two probes, the GAL4NP16 and Tos17
fragments, were hybridised to nylon filters with genomic DNA digested with EcoR I.
The procedure used was as previously described (Sambrook et al., 1989)
7.3 RESULTS
7.3.1 Phenotype and reporter gene expression of mutants in T1 generation
Eight plants each of 270 TAFET lines of the T1 generation were observed for any
chlorophyll-deficiency and/or any morphological change phenotypes (for details see
Appendix 4.1 ). These observations resulted in a number of lines with phenotypic
changes, mostly in leaf chlorophyll content and floral shape. Chlorophyll-deficient
mutations observed ranged from yellow-green (viridis), green with white stripe to
completely white (albino) (Figure7.1). The percentage of these phenotypes was 2%
(viridis), 3% (white stripes) and 5% (albino). Mutants with an albino phenotype died
after two weeks, whereas plants with white stripes or yellow-green colouration
-142
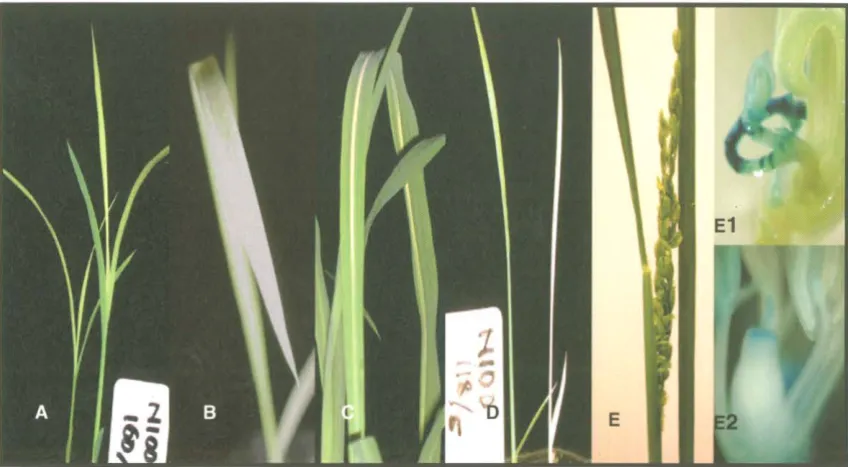
Figure 7.1. Chlorophyl mutation and ectopic phenotypes in spikelets
displayed in T1 TAFET lines. A. yellowish green (viridis), B. broad white stripe, C. narrow white stripe, D. albino, E. floral (spikelets) morphological changes, E1. flower (spikelet, blue colour) within flower (spikelet) and E2. abnormal style and stigma (blue colour). Blue colour is GUS reporter gene expression.
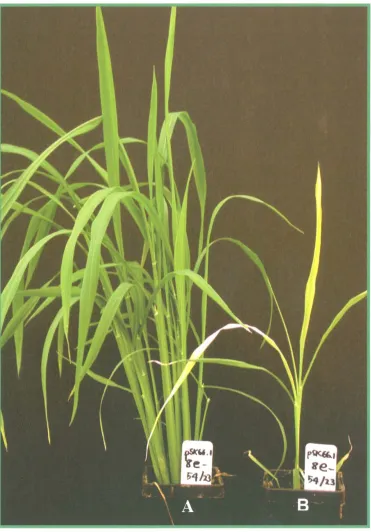
Dramatic changes in plant and floral morphology were observed in one of eight
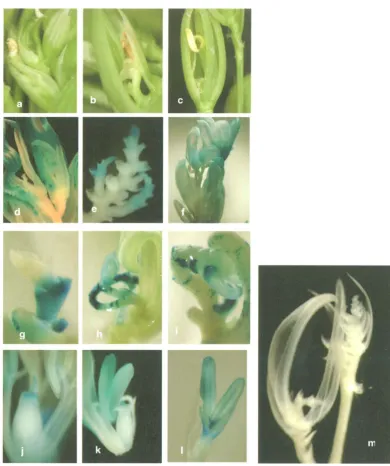
plants of pSKC66.1-8e (Fig. 7.2 and 7.3). Various spikelet morphology changes were
observed, such as 1) a spikelet within a spikelet (Fig. 7.3, A, B, H); 2) a spikelet with a
bud-like shape (Fig. 7.3, 1), 3) spikelets with leaves-like shape of palea and lemma (Fig.
7.3, 0 and F); 4) spikelet with abnormal carpel and a lesser numbers of anther than 6
(Fig. 7.3, C); 5) spikelets with abnormal style and stigma (Fig. 7.3,J-L) and 6) spikelet
with abnormal pedicle (Fig. 7.3, G). Interestingly, the changed floral tissues showed
blue GUS staining, while the wild type flowers showed GUS staining only in the anthers
and pollen. In addition, the mutant had only one culm instead of an average number of
-Figure 7.2. Phenotypes of mutant (B) and wild type (A) of pSKC66.1-8e
line.
[image:7.597.165.537.120.653.2]144
Figure 7.3. Ectopic expressions of pSKC66.1-8e line and its reporter
gene expression in various flower organs. a-c: range of flower
morphological changes, a & b. no sexual organs, c: have two anthers but no
female organ, d-f: leafy-or bud-like structure, g-i: spikelet-like structure inside
spikelet, j: no style and stigma, but small tissues in the middle-top of ovule
(carpel), k: style-like structure and small tissues in the middle-style, 1: style
and not fully developed stigma (philia) and m: spikelet-like structure inside
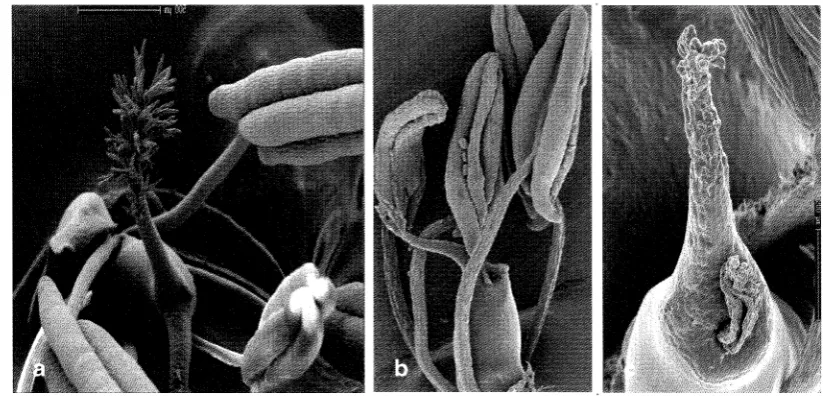
Moreover, flower pSKC66.1 was observed using Scanning
Microscope (SEM). This mutant plant was abnormal in anther, style and stigma tissues
development (Figure7.4).
Figure 7.4 Scanning electron microscopy of anther and stigma of the pSKC66.1-8e line. a. fully developed anther, style and stigma of wild type; b. not fully developed anther and stigma, c. Style and stigma were not developed at all, were observed in mutant flowers.
7.3.2 Genetic analysis
In order to establish the genetic basis of the pSKC66. i -8e mutant phenotypes, 63 T1 seeds were planted. Floral phenotype changes were observed in 10 of 63 T1 plants (Table7.1) and the mutants showed GUS staining in the floral tissues. Another 10 of 63 plants died during growth. By assuming that the 10 dead plants and 10 plants with floral mutant phenotypes were in the same class (group), plants in T1 appeared to
segregate in an approximate 3:1 ratio, between plants with normal phenotype (wild-type pheno(wild-type) and plants with mutant pheno(wild-type. Those 53 of 63 T1 plants were also
observed for GUS gene expression in the floral tissues. Plants showed an
[image:9.595.112.524.161.359.2]146
(36 of and those displaying no expression 17 of 53) 7.1). Gus gene
expression was expressed either in the anther wall and pollen of wild-type plants or in
the floral tissues showing morphology changes in the T1 generation. These results
suggested a link between mutant phenotypes in this line and TAFET T-DNA insertion.
This prompted the analysis of the T2 generation.
Nine T2 families were planted and at least 20 plants were observed for each
family (Table 7.1 ). A varying number of plants with mutant phenotypes were observed
within each family. As a result, plants within a family did not segregate in a 3:1 ratio
(wild type:mutant). In theory, about one quarter of plants should have a mutant
phenotype if the mutation is recessive. Interestingly, the GUS staining segregation
pattern was consistently shown by plants of families in the T2 and T3 generations,
except for plants of family 39-54 number 4 (39-59/4) which showed no GUS gene
expression (Table 7.1) (Figure7.3, F).
Southern blot analysis was carried out on T2 and T3 plants to identify and confirm
if T-DNA insertion is linked to the mutant phenotype. The GAL4/VP16 gene fragment
was used as a probe. Southern blot analysis of pSKC66.1-8e plant DNA in the T0
generation showed that four DNA fragments (3.6kb, 3.0kb, 1.6kb and 1.3kb in size)
containing TAFET T-DNA insertions (Figure 7.6, A, lane 15). The first two, 3.6kb and
3.0kb, were "fixed"in all plants, while the 1.6kb and 1.3kb fragments co-segregated
among plants within a family. Therefore, plants within families had either 4 fragments
or 2 fragments. In addition, there were families which had no T-DNA (Fig.7.6, A)
(Table 7.1 ). Interestingly, there were plants which had a different number of T-DNA
insertions, showing mutant phenotypes (Fig. 7.6 A. lane 14 and 15). In contrast, there
were plants which had a similar number of T-DNA insertions showing different
phenotypes, both wild type and mutant. For example, plant 6 (lane 6) showed mutant
No-/Family
r
plants yes No %with GUS - died Mutant one culm normal 0 2 --· .---·-4To pSKC66.1-8e 1 1
--- - - - - · · - - - -r--- ---~ --~--- ---f
-T1 39 63 36 17 68 10 10* 0 43 na na na
T2 39-7A 21 16 5 76.2 0 1*(2) 6 14 3 5 0
39-78 21 16 5 76.2 3 0 6 12 0 4 0
--r--- --- - - -
f---39-10 20 13 3 81.3 1 0 6 13 0 0 2
39-13 24 na na na 4 1 2 18 0 1 1
39-15 24 na na na 2 0 5 17 0 1 1
39-23 20 na na na 2 0 3 15 0 2 0
39-24 32 na na na 2 0 7 23 0 6 0
39-54 20 na na na 3 1 5 11 1 5 3
39-4 23 17 6 73.9 0 2*(2) 7 14 0 3 0
--- --~- - -
---T3 39-4/8, n 24 17 7 70.8 1 1*(2) 9 14 1 5 0
39-4/9, n 29 18 6 75.0 3 1* 13 12 0 5 0
39-63/3, s 24 10 5 66.7 1 1*(2) 4 18 --- 0 2 0
39-63/6, n 24 18 6 75.0 0 -· ---1* 5 18 0 3 0
--39-63/24, n 24 18 6 75.0 0 0 11 18 1 10 0
39-54/4, M 24 0 20 0 4 1**(0) 4 15 13 0 0 •
39-54/9, n 24 17 6 73.9 1 0 7 16 3 0 10
39-54/20, n __ ~- na 4 na 0 1 **(0) 6 20 10 0 0 I
-- - - r----· . -· · - - - -
~----··----39-54/23, r. 20 10 5 66.7 5 -~- 6 9 - 11 0 1 I
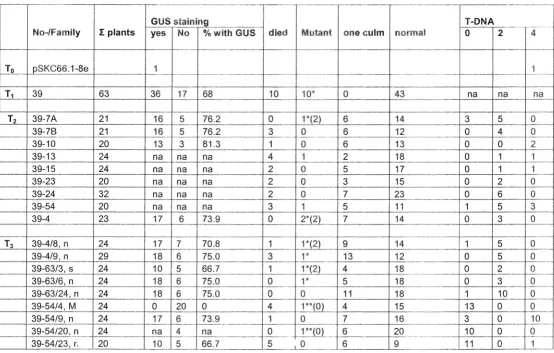
Table 7.1 Segregation of pSKC66.1 ~8e mutant line and their T -DNA copy numbers. *, mutant plants with staining; **, mutant plants without staining; ( ), T-DNA insertion within mutant plants; na, plants were not analysed.
[image:11.843.172.727.132.485.2]148
These results strongly suggested that the mutant were not linked to
the T-DNA insertion.
Further Southern analysis was carried out on several families in the T 3
generation. Analysis gave confirmation that the mutant phenotypes were most likely
not linked to the T-DNA insertion, as two plants of family 39-54 number 4 (39-59/4) and
family 39-54 number 20 (39-59/20) with a floral phenotype change (mutant) had
noT-DNA insertion (Tabel 7.1 ). In addition, these flowers did not show GUS staining
7.3.3 Testing the Tos17 status in T2 and T3 generations of line pSKC66.1-8e
We hybridised the same membranes previously hybridised with the GAL4/VP16
probe, with a Tos17 fragment as a probe after stripping. Southern blot analysis showed
that plant genomic DNA(s) that did not hybridise with the GAL4/VP16 probes (1, 2, 3, 5,
6, 7, 8, 9, 10, and 16) (Fig. 7.6, A), showed eight DNA fragments that appear to contain
Tos17 retrotransposon transposition (Figure 7.6 B). Another membrane blot also
showed that Tos17 probe hybridised the plant DNA(s) blots that did not hybridise with
GAL4/VP16 probe and also producing eight DNA fragments containing Tos17
transposition (Fig. 7.7, B).
Analysis showed a 3kb DNA fragment was only observed in plants with mutant
phenotypes. This may suggest that the mutant phenotype was linked to the
transposition of the Tos17 retrotransposon in the rice genome. However, as the
mutant plant contained eight DNA fragments hybridised to the Tos17 probe, cloning of
A
M M
L 1
2
J4
5
6 7
B 9
U) 11 12 13
1415
16h: H1
x
B
123456
8 9 1011 t213141516tx10x
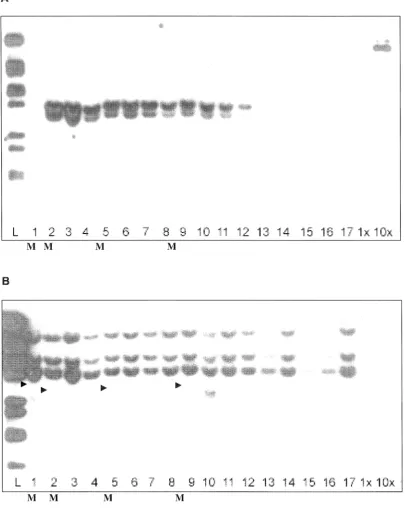
Figure 7.5 Southern blots of plants with mutant and normal phenotypes
hybridised with (A) GAL4NP16 fragment and (B) TOS17 fragment probes. 1-13
and 16: plants with wild type phenotype, 14-15: plants with mutant phenotypes. Arrow:
3.0kb DNA fragment containing Tos17 assumed to be linked to the mutant phenotypes.
l: A-DNA digested with BstE II restriction enzyme, 1 2, 2 3, 3 39-54/4-4, 4 39-54/4-6, 5 39-54/4-7, 6 39-54/4-8, 7 39-54/4-9, 8 39-54/4-13, 9 39-54/4-139-54/4-4, 10
54/4- i 5, 11 54/4-16, 12 54/3, 13 54/1' 14 54/2, 15 63/6-14, 16
[image:13.595.117.515.91.363.2]150
A
L
12
~~4l
,{::;6
..; """"'~ 8 ~) 10 1 12
"13
14M M M M
B
L
4
c;;; ~:l A 9 10 12
'13
14M M
Figure 7.6 Southern of plants with mutant and normal phenotypes hybridised with (A) GAL4NP16 fragment and (B) TOS17 fragment probes. 3, 4, 6-8, 10-17: plants with wild type phenotype, 1, 2, 5 and 9: plants with mutant phenotypes. arrow: 3.0kb DNA fragment containing Tos17 assumed to be linked to the mutant
phenotypes. 1 39-4/8-5, 2 39-4/9-10, 3 39-7 A/1 0, 4 39-7 A/13, 5 39-7 A/23, 6 39-78/i 1, 7
[image:14.595.114.520.88.608.2]DISCUSSION
Mutant phenotypes have been commonly used for plant functional genomic
investigations. Ethyl methane sulphonate (EMS) and gamma- or X-ray, are
conventional methods for mutagenesis. These have a higher efficiency in inducing
mutant phenotypes than from the less conventional method of insertional mutagenesis
(Koornneef et al., 1982). Insertional mutagenesis, however, is a preferred approach for
functional genomics, as it may generally tag genes (inducing mutant phenotypes).
DNA sequences adjacent to the insertion may be cloned using PCR (Maes et al.,
1999). However, it has been shown that not all genes can be uncovered through
application of insertional mutagenesis (Burns et al., 1994; Campisi et al., 1999;
Springer, 2000). Indeed, about two thirds of Drosophila's genes (equal to 8000 genes)
are predicted to show no obvious LoF phenotypes because of gene redundancy
(Miklos and Rubin, 1996). Added to this is the fact that mutations are not always linked
toT-DNA and this could be as high as about 60% in Arabidopsis and about 50% in rice
(McEiver et al .. 2001 ).
In my experiments, about 10% of TAFET lines showed various types of
chlorophyll-deficient mutations, and such mutations were often produced from tissue
culture application (Palmer et al., 2000). Such chlorophyll-deficient phenotypes were
also obtained from previous work using aT-DNA insertional sequences in rice, in about
similar percentage (Jean and An, 2001; Jung et al., 2003). One mutant line was
identified have a T-DNA insertion in the chlorina (OsCHLH) gene that is highly
homologous to XANTHA-F in barley and CHLH in Arabidopsis. Two other mutants with
chlorophyll-deficient phenotypes had a Tos-17 insertion in the OsCHLH gene (Jung et
Several genes involved in rice flower development have been identified. Those
1.52
(Nagasawa et al., and OsMADS3. A mutation of the OsMADS1 altered spikelets
rnnlrllr\n\1 to elongated leafy palea and lemma, two pairs of leafy palea-like and
lemma-like lodicules, decrease in a stamen number and an increase in the number of
carpels. Transgenics containing double-stranded RNA with the OsMADS16 eDNA
fragment were male sterile, and lodicules were converted into palea/lemma-like organs
and some stamens into carpels (Xiao et al., 2003). The carpels had been replaced by
stamen-like organs when OsMADS16 was ectopically expressed under the control of
the Maize Ubiquitin1 promoter (Lee et al., 2003a). Ectopic expression of OsMAD3 in
rice plant caused homeotic transformation of lodicule to stamens (Kyozuka and
Shimamoto, 2002). The homeotic mutation spw1 converted stamens and lodicules into
carpels and palea-like organs, respectively. Two spw1 alleles. spw1-1 and spw1-2,
show the same floral phenotype and did not affect vegetative development and SPW1
is a rice APETALA3 homolog, OsMADS16 (Nagasawa et al., 2003). In contrast, two
strong alleles of the dl locus, drooping superman1 (dl-sup1) and drooping
leaf-superman2 (d/-sup2), cause the complete transformation of the gynoecium into
stamens (Nagasawa et al., 2003). Moreover, the DL is regulated negatively by the
SPW1. as stamens were converted into carpels in spw1 mutants and carpels were
converted into stamens in df mutants (Yamaguchi et al.. 2004 ).
The pSKC66. 1-Se mutant line had dramatic floral tissue changes. such as
spikelets with leaf-like organs of palea and lemma (Fig. 7.3, D and F), a spikelet within
a spikelet (Fig. 7.3, A, B, H), a spikelet with bud-like organs (Fig. 7.3, 1), and spikelet
with a lesser numbers of anthers and abnormal carpel (Fig. 7.3, C, J-L). With
reference to the results above, ectopic phenotypes of the pSKC66.1-8e mutant might
be related to a disruption of a MADs-box family gene.
In addition, this mutant phenotype was one example of the phenomenon that a
segregation between plants with wild type and plants with mutant phenotype was
observed in the T1 generation (Fig 7.3 and However, observation in
the T 2 generation showed that mutant phenotypes did not segregate among plants in a
3:1 Mendelian fashion as expected (Table 7.1 ). Indeed, plants of the pSKD66.1-8e
families were segregated in 3:1 segregation ratio between plants with GUS gene
expression and that of without GUS expression in the T2 generation.
Southern blot analysis showed that the presence of DNA fragments which
hybridised with the GAL4NP16 fragment as a probe varied among families in T2 and T3
generations. These suggested that there was no link between the mutant phenotype
and the T-DNA insertion and it was reconfirmed by Southern blot in the T3 generation.
where some of mutant plants did not have any T-DNA insertion (Table 7.1 ).
Further attempts were made to determine whether the mutant phenotype was
due to Tos17 transposition, as Tos17 transposition has been known to be related to a
tissue culture-induced mutation (Hirochika et al., 1996; Jung et al., 2003). Results
showed that plant DNA blots with mutant and normal phenotypes had different
numbers of DNA fragments when the membranes were hybridised with the Tos17
fragment as a probe. Eight fragments containing Tos17 transposition were produced
by plants with mutant phenotypes, whereas plants with normal phenotype had only 7
DNA fragments (Fig. 7.68). The 3.0kb DNA fragment containing the Tos17
transposition could be responsible for the mutant phenotype. Very few plants with
mutant phenotype were observed in T2and T3families. The most likely explanation of
this segregation distortion is lethality of Tos17 insertion when in double dose and
sub-lethality in a single dose. The high level of sterility and seedling death observed in
154
Several mutants induced Tos17 transposition have been identified. For
example Osaba1, a strong viviparous mutant that displayed low abscisic acid level and
almost no further increase in its levels upon drought, and OsTATC, a mutant with weak
phenotype, exhibited the pale green phenotype and slight increase in abscisic acid
levels upon drought (Agrawal et al., 2001 ). Other examples are a chlorophyll-deficient
phenotype due to a disruption of the OSCHLH gene (Jung et al., 2003) and phyA
mutants which showed insensitivity to far-red light (Taka no et al., 2001).
1,5 CONClUSION
There are three conclusions that can be drawn from the experiments.
• First, the mutant phenotypes with dramatic changes in plant and floral
morphology of pSKC66.1-8e were not related to T AFET T -DNA insertion;
instead they might be linked to the transposition of the Tos17 retrotransposon in
to a 3kb EcoR I fragment of rice DNA.
* Second, the Tos17 retrotransposon could be used to identify mutant phenotypes in transgenic rice, as previously described by Hirochika (2001 ).
" Third, the low frequency of mutations may suggest that Loss-of-Function (LoF)
phenotypes are not easily induced using insertional sequence mutagenesis,
due to a gene redundancy phenomenon, and there is a need to develop other
mutational systems for Gain-of-Function (GoF) for which the Transcriptional
Chapter 8
CONCLUSION AND FUTURE WORK
8.1 RESUlTS IN PERSPECTIVE
In this thesis five major areas have been studied, as follow:
1. The development and testing of GAL4/VP16 transactivator-facilitated enhancer
trap (TAFET) constructs in rice.
2. The stability and inheritance of patterns induced by TAFET constructs.
3. Validation of the GAL4/VP16 system to see whether it works in the same way
as the mechanism of the GAL4 system in Drosophila (Brand and Dormand,
1995) and Arabidopsis (Haseloff. 2002).
4. Validation of the GAL4/VP16 system to see whether it is able to direct
expression of a gene fused to the UASGAL4 , inducing a phenotypic change
(ectopic expression) and producing of a Gain of Function (GoF) phenotype.
5. Identification of a mutant line observed among TAFET lines and testing whether
the phenotypes were linked toT-DNA insertion.
Transactivator constructs developed and tested in the experiments had the
following components: two !3-glucuronidase reporter genes cassettes (GUS and
GUSPius); two different transactivator cassettes (with and without the cata/ase-1 intron
upstream of the GAL4/VP16) and two different relative distances between the UASGAL4
and the CaMV 35S promoter driving a hygromycin gene (1.6 kb and 7 kb).
The results presented in this thesis showed the GAL4/VP16 transcriptional
156
tissue specificity (spatial) expression patterns in the roots, leaves or flowers of rice ..
About 95% of the TAFET lines showed gene expression in the roots, leaves or floral
tissues, which was higher than previously reported by Wu et al. (2003) (about 70%)
using a similar type of construct. A higher percentage of expression may be due to the
constructs used to generate the transgenics. In contrast, the deletion lines have
T-DNA insertions, but do not display any gene expression. Results showed that the
percentage of lines with expression in the floral tissues was 55%, which was higher
than previously reported by Campisi et al. (31%) (Campisi et al., 1999), but comparable
to that previously reported by Sundaresan et al. (Sundaresan et al., 1995b). About
17.3% of lines showed tissue-specific expression in the flower, higher than previously
found in rice (1.9%) (Jean et al., 2000a). The percentage of lines showing expression
in the ovule was only about 0.5% and it was also reported as the least frequent
expression in rice flowers by Wu et al (2003). These patterns may become invaluable
sources for the study of rice floral tissue development, as previously described (Kiegle
et aL, 2000; Geisler et al., 2002).
Indeed, one construct used by Wu et al. (2003) to generate rice enhancer trap
line was containing similar elements as the eight constructs used in generation of
T AFET lines presented in this thesis, since it was part of the Rice Transgenomic
project of CAMBIA. However, as we mentioned about transactivator constructs were
developed and tested, the eight different construct induced different levels of intensity
and also complexity of expression patterns. In our analysis, it is indicated that the use
of different reporter genes and intron upstream GAL4/VP16 TAFET in combinations
had some effect on the patterns produced. It is also apparent that 35S enhancer used
affected the expression patterns in a number of lines. However, patterns are likely
representing primarily the effect of endogenous enhancer and of complex interaction
between rice genomic enhancer and those from the T-DNA. Beside that, our analysis
and with complexity of patterns, produced more patterns and a greater spread of
pattern distribution than GUS constructs. It supports efforts devoted for developing a
better and more sensitive of reporter gene (Jefferson et al., 1987; Haseloff et al.. 1997)
The work also proved that patterns produced were due to the GAL4NP16
activation of reporter gene fused to the UASGAL4 in rice, as previously reported in plant
cells (Schwechheimer et al., 1998) and Arabidopsis (Kiegle et al.. 2000).
As patterns of the transactivator-based enhancer trap lines were mimicking
endogenous rice enhancers, enhancer trap lines are equally valuable materials for
plant development studies in rice, as those previously reported in Arabidopsis (Kiegle
et al., 2000; Haseloff, 2002) and Drosophila (Brand and Perrimon, 1993: Rorth, 1998).
In my experiments, the observation was focused on reporter gene expression in
the floral tissues, and it resulted in 17.3% of T AFET lines showing tissue-specific
expression patterns in floral parts. Overall, 2.1% had expression only in a single
tissue, 10.5% had expression in two tissues, and 4.8%, had expression in three
tissues. These GAL4NP16 enhancer trap lines could be useful for floral tissue-specific
development studies, using a similar approach as described above. For example, lines
that had expression in the ovule (0.5%) of the pattern lines developed could be crossed
with UAS lines (a target gene or a random target), and any gene lying next to the UAS
would be activated in the ovule, producing lines with phenotypic changes in the ovule
tissues. Screening of such materials might lead to identification of genes involved in
ovule development. Ovule development is an important subject as it is related to the
apomixis phenomenon that is a subject of very active research (Koltunow, 1993; Moore
et al., 1997; Chaudhury et al., 1998; Grossniklaus and Schneitz, 1998; Grossniklaus et
160
SOME REMAINING ISSUES
Attempts to generate an obvious phenotypic change in a rice tissue under
investigation through ectopic expression of maize AGAMOUS-like ZAG1 gene, using
the GAL4/VP16 system, have not been successful. Other genes should be tested
using this system to evaluate its performance.
As varying levels of specificity of expression patterns were observed in TAFET
lines, and these could aid the identification of regulatory proteins involved in cells or
tissue development in rice. Screening of those lines under various conditions would be
very useful. Field screening would be particularly valuable, as the performance of
transactivator in normal growing conditions for rice is essential for potential practical
applications of the system. Unfortunately field screening of transgenic material in
Australia is very difficult to carry out because of current regulations.
8.3 CONCLUSIONS
Experimental results presented in this thesis allow the conclusion as follows.
.. The GAL4/VP16 transcriptional activator-facilitated enhancer trap (TAFET)
system is functional. Gene expression patterns are revealed by a reporter
gene, both in ubiquitous and cells- or tissue-specific manner, mimicking
endogenous enhancers.
.. These patterns were inherited in a Mendelian fashion and stably expressed
over three generations in rice. The implication of these observations is that
selection of GAL4/VP16 enhancer-trap lines can be carried out in the To
® The 6 system was able to direct expression of a "target" gene
fused to the UASGAL4 , in a cell or tissue rice, in which the GAL4/VP16 was
active (reflection of the site where an enhancer and regulatory proteins were
active). This ablility has a potential use for inducing Gain-of-Function (GoF)
mutations. The GAL4/VP16 TAFET system is therefore a prospective system
and a novel tool for rice gene discovery and rice functional genomics
investigations.
• The TAFET-GUSPius constructs induced more complex patterns and greater
diversity of patterns than GUS constructs in rice enhancer trap lines. It was
confirmed that GUSPius is a more sensitive reporter gene than GUS (Nguyen,
2002).
8.4 FUTURE WORK
Crossing between GAL4/VP16 lines and target lines containing genes other than
ZAG1 to produce Fi plants with phenotypic changes needs to be conducted. This will
confirm wether the GAL4/VP16 system is able to direct expression of a target gene
(gene under study or random insertion) fused to UAS in the cell- or tissue-specific
Appendix 4.1 TAFET lines were investigated for patterns of expression in three generations and
x
2 test in T2 generation.
chi-No. Constructs Lines G T-DNA No F Cl C2 El E2 Expression patterns - squared P<O.OS (3.84) status
-- ---~-- ---
·---To 2 anther wall, strong
I pSKC76.1 56[ T, anther wall, strong
T- I 2 16 6 16.5 5.5 anther wall, strong: pollen, weak 0.06 accept hypothesis heterozygote 2 3 23 0 17.25 5.75 anther wall, strong: pollen, weak 7.67 reject hypothesis homozygote 3 6 15 8 17.25 5.75 anther wall, strong:pollen, weak - - - - 1.17 accept hypothesis heterozygote
2 anther wall cells
2 pSMRJI8(0) 3la To anther wall cells
T, 4 2 17 7 18 6 anther wall cells 0.22 accept hypothesis heterozygote T, 5 3 24 0 18 6 anther wall cells 8.00 reject hypothesis homozygote 6 6 21 I 17.25 5.75 anther wall cells 4.74 rejec~ hypothesis homozygote
To I Midrib palea&lemma, anther wall, (stigma and style, weak) --3 pSMRJ18R 3a T, midrib palea & lemma, anther wall
T· 7 I 14
r-- - -·!---· 0 10.5 3.5 midrib palea & lemma, anther wall (stigma and style, weak) 4.67 reject hypothesis homozygote
8 7 0 8 6 2 pollen 24 reject hypothesis Background
9 8 9 2 9.75 3.25 anther wall 0.55 accept hypothesis heterozygote
To Not observed
4 pSMRJ18 (50) 506 T, anther wall cells
r--
---T, 10 - 5 24 0 18 6 anther wall cells 8.00 reject hypothesis homozygote
II 6 24 0 18 6 anther wall cells 8.00 reject hypothesis homozygote 12 8 24 0 18 6 anther wall cells -- 8.00 reject hypothesis homozygote
I-- ·1-·--~-1-- --- pollen
---5 pSMRJ18 103c T, pollen
T, 13 2 -16 7 17.25 5.75 pollen 0 .. 36 accept hypothesis heterozygote 14 4 13 7 15 5 pollen 1.07 ace~ hypothesis heterozygote 15 5 15 5 15 5 pollen 0 accept hypothesis heterozygote
- - · · · - .
---·--6 pSKC66.1 8e To 5
1-- Anther wall, pollen T,
- anther wall, pollen (5/8) and 3/8 morphological changes *
T, 16 54 14 3 12.75 4.25 anther wall, pollen:pollen 0.49 accept hypothesis heterozygote 17 52 15 16 23.25 7.75 anther wall, pollen:pollen 11.71 reject hypothesis uncertain 18 55 10 9 14.25 4.75 anther wall, pollen: pollen 5.07 reject hypothesis uncertain
7 pSMRJI8 3a To Palea &lemma, pollen, base of style T, base of style, middle part of carpel
T, 19 I 13 8 16.5 5.5 base of st~le, anther wall: anther wall 1.88 accept hypothesis heterozygote 20 2 17 6 17.25 5.75 anther wall:pollen 0.01 acce_pt hypothesis heterozygote 21 3 16 8 18 6 base of style, anther wall: anther wall 0.89 accept hypothesis heterozygote
8 pSMRJI7R 301 To 4 anther, base of style T,
- anther, base of style, medium-strong
T, 22 5 17 6 17.25 5.75 base ofst~le, strong:Qollen, S!1:le weak O.oJ accept hypothesis heterozygote 23 7 12 7 14.25 4.75 base of style: pollen 1.42 accept hypothesis heterozygote 24 8 22 I 17.25 5.75 base of style, strong: pollen 5.23 reject hypothesis homozygote
9 pSMRJ 18(50) 22a To Filament, anther, pollen
--
-T, Anther wall, (stigma, style, ovule, weak)
T, 26 4 18 6 18 6 anther wall cells : pollen 0 accept hypothesis heterozygote 27 8 0 24 16 8 Pollen 48.00 reject hypothesis background 28 7 18 6 18 6 anther wall cells : pollen 0 accept hypothesis heterozygote
10 pSMRJI8R -1/2 9a To 3 tip ofpalea, lemma (weak), anther, stigma, style T, midrib ofpalea, lemma, anther, stigma, style
T, 29 I 18 6 18 6 anther, style, stigma: anther 0 accept hypothesis heterozygote
-30 4 19 5 18 6 anther, style, stigma: anther 0.22 accept hypothesis heterozygote
- -
~-31 6 18 6 18 6 anther, style, stigma: anther 0 accept hypothesis heterozygote
---II pSMRJ18 (50) 770-1 To Not observed
T, Lodicule, anther wall, pollen, (base of style )
T, 32 2 16 8 18 6 Lodicule, anther wall,_pollen :_lJOllen 0.89 accept hypothesis heterozygote 33 4 20 0 15 5 anther wall cells , pollen 6.67 reject hypothesis homozygote 34 6 16 4 15 5 anther wall cells, pollen : pollen 2.67 accept hypothesis heterozygote
-
chi-No. Constructs Lines G T-DNA No F Cl C2 El E2 Expression patterns squared P<0.05 (3.84) status
12 pSMRJ 18R(50) 881-1 To Vascular bundle ofpalea/lemma, anther, pollen Vascular bundle, whole, tip palea/lemma, lodicule vessel,
T, anther wall, (base of style)
T, 35 2 16 0 12 4 Midrib, vascular bundle palea/lemma, anther wall, pollen 5.33 reject hypothesis homozygote 36 3 16 0 12
- 4 Midrib, vascular bundle palea/lemma, anther wall, pollen 5.33 reject hypothesis homozygote
13 pSMRJ18 5a To -- - -- - - - · not observed
-~--- - -f
-T, Midrib,lodicule ,anther, base of style, stgma
T, 37 4 19 5 18 6 Midrib, lodicule, anther, (stigma, some), base of style: pollen 0.22 accept hypothesis heterozygote 1-- 38 6 18 6 18 6 Midrib. lodicule, anther, stigma, base of style: pollen 0 accept hypothesis heterozygote 39 7 17 7 18 6 Midrib, lodicule, anther, base of style: pollen 0.22 accept hypothesis heterozygote
f-- --- - - --- · - - - - ---·---
---14 pSMRJ17R 204 To - not observed
T, Anther, base of style
T, 40 4 14 9 17.25 5.75 Anther, base of style : pollen 2.45 accept hypothesis heterozygote 41 5 14 5 14.25 4.75 Anther, base of style. (lodicule, palea. some): pollen 0.01 accept hypothesis heterozygote 42 8 11 7 14.25 4.75 Anther, base of style: pollen 1.81 accept hypothesis heterozygote
r--
-15 pSMRJ18 100 To lodicule, anther
T, - lodicule, anther
1-T' 43 2 18 6 18 6 lodicule, anther : pollen - - - - 0 accept hypothesis heterozygote 44 5 17 -4 15.75 5.75 lodicule. anther : pollen -- 0.63 accept hypothesis heterozygote 45 8 20 4 18 6 lodicule, anther : pollen 0.89 accept hypothesis heterozygote
-·-- ....
16 pSMRJ17 806 To not observed
T, lodicule --
---T, - 46 5 19 5 18 6 pollen 0.22 accept hypothesis heterozygote
--47 6 II 9 15 5 lodicule, anther: pollen 4.27 reject hypothesis
-
---48 7 _.l.L 5 17.25 j,75 lodicule, anther : pollen 0.13 accept hypothesis heterozygote
--
-17 pSMRJ18R 610 To
1--- - - - -- - · not observed
---T, Trichoma, strong
T, 49 2 8 0 6 2 Trichome, palea/lemma, anther wall - 2.67 accept hypothesis heterozygote 50 3 11 0 8.25 2.75 Trichome, paleallemma, anther wall 3.67 accept hypothesis heterozygote
17 pSMRJI8R 610 T, 51 8 0 17 12.75 4.25 pollen, very weak 51.00 reject hypothesis
-·- ·---
·--·---·-18 pSMRJI7 !Ole To - - not observed
·-T, end of filament, lodicule
T, 52 7 10 8 13.5 4.5 end of filament, base of stvle : pollen 3.63 accept hypothesis heterozygote 53 3 12 6 13.5 4.5 end of filament, lodicule, base of style 0.67 accept hypothesis heterozygote 54 17 7 18 6 end of filament, lodicule, base of style 0.22 accept hypothesis heterozygote
-- - - ---·
19 pSMRJI7R lOa Tn anther
T, whole, trichoma, anther wall, stigma
T, 55 I 16 8 18 6 whole, trichoma, anther wall, stigma 0.89 accept hypothesis heterozygote 56 2 18 4 17.5 5.5 whole, trichoma, anther wall, stigma 0.42 accept hypothesis heterozygote 57 3 18 4 17.5 5.5 whole, trichoma, anther wall, stigma 0.423377 accept hypothesis heterozygote
--20 pSKC 059.2 14d To I midrib palea/lemma, lodicule, anther T, midrib palea/lemma, lodicule, anther
T, 58 3 12 9 15.25 5.75 midrib palea/lemma, lodicule, anther: pollen ---- 2.53 accept hypothesis heterozygote f----· 59 4 18 6 18 (i midrib palea/lemma. lodicule, anther: pollen · - - - 0 accept hypothesis heterozygote
60 5 18 6 18 6 midrib palea/lemma, lodicule, anther: pollen 0 accept hypothesis heterozygote
21 pSMRJI8R 25g To 4 Palea/lemma, anther
. -T,
- t - - - - t - - Palea/lemma, lodicule, anther, stigma, style
T, 61 I 21 3 18 6 trichoma+anther:non 2.00 accept hypothesis heterozygote t--- 62 6 16 4 15 5 Palea/lemma,trichoma, anther non 0.27 accept hypothesis heterozygote
22 pSMRJI8 (50) 505-1 To 5 anther, stigma T,
- anther wall cells, strong ..
1--- - -~--To - - - 63 1--.2___ 15 0 11.25 rJ-25 anther wall cells ---~---~5 reject h othesis ___ 1
-1---· 64 5 14 4 13.5 4.5 anther wall cells : non 0.\.17 accept hypothesis heterozygote
67 4 10 3 -- 9.75 3.25 anther wall cells : non O.Q3
--- accept hypothesis heterozygote
23 pSMRJI8 20 To I - - -... -- ... anther, base of style --- --·-··---·----·-
f---L _ . . . _ _ _ - - T, ---·---·-- -------·-·- ·---·-·--·-- -- - - - base of style, anther ·---·-·--·-·---·---·- _____ ---·-···--- - - - ·
chi-No. Constructs Lines G T-DNA No F Cl C2 El E2 Expression patterns squared P<0.05 (3.84) status
23 pSMRJ18 20 T, 68 I 17 3 15 5 base of style, anther .. 1.07 accept hypothesis heterozygote 69 7 15 2 12.75 4.25 bas~~fstyle, anther 1.59 accep~othesis heterozygote
- ·
- - - - · · ... ---·---~----
----24 pSMRJI8 21 To .. anther, bas~ of style
T, base of style
T, 70 2 12 --0 9 3 anther wall, strong 4.00 reject hypothesis homozygote 71 6 11 3 10.5 3.5 anther wall, strong 0.10 accept hypothesis heterozygote ·- 72 7 15 2 12.75 4.25 anther wall, strong_ - 1.59 accept hypothesis heterozygote
.
25 pSMRJI8 (50) 23b To not observed
T, anther wall
T, 73 3 24 0 18 6 anther wall 8.00 reject hypothesis homozygote
-· -· - - - - ---
-26 pSMRJ 18R(O) 47a To Whole, vascular bundle or midribpalea/lemma, anther _
-T, Palea/lemma, anther
T, 74 I 17 6 17.25 5.75 Whole/vascular bundle/midrib palea/lemma, anther wall:pollen 0.01 accept hypothesis heterozygote 75 4 16 6 16.5 5.5 Whole/vascular bundle/midrib palea/lemma, anther wall:pollen 0.06 accept hypothesis heterozygote
- -r--·
76 6 18 __ 6 18 6 Whole/vascular bundle/midrih palea/lemma, anther wall:pollen 0 accept hypothesis heterozygote . ··-r---f---·
,---·
-27 pSMRJI7R 25a To not observed
-f--· T~_ r--- whole palea/lemma,trichome
-___I;_ 77 I 20 3 17.25 5.75 whole palea/lemma,trichome : non 1.75 accept hypothesis heterozygote
- -
-78 2 18 6 18 6 whole palea/lemma,trichome : non 0 accept hypothesis heterozygote
--r---· . .
79 5 17 5 16.5 5.5 whole palea/lemma,trichome :non 0.06 accept hypothesis heterozygote
·
-
---28 pSKC76.1 2 To ·---- not observed -
-T, stigma, style
To 80 4 14 10 15 5 stigma, style:pollen 5.07 reject hypothesis uncertain
- - -~ -- ..
81 6 15 9 18 6 stigma, style:pollen 2.00 accept hypothesis heterozygote
----82 8 0 21 __ _ _15.75 5.25 anther wall and or pollen 63.00 reject hypothesis ... background
r---•.. r--29 pSMRJ17R 37d To __
-· - ----r---- ___ ,. ___
--1 - - - · - - - ·
---' - - - · . -- .. !l.. - - - -- · · · · ---·· ... '--·-·- - - pollen, stigma
T, 83 4 16 7 17.25 5.75 anther wall, stigma, style: pollen 0.36 heterozygote 84 6 24 0 18 6_ .J'aleallemma, anther, stigma, style 8.00 homozygote 85 8 0 24 18 6 pol_~~--- 72.00 reje<:!_ hypothesis background
··-
-30 pSMRJ17R 78a To - Midribpaleallemma, stigma, style
-Tr Midrib paleallemma, stigma, style
T, 86 I 14 7 16.5 5.5 Midrib, anther wall, stigma, style --- 0.79 othesis heterozygote 87 6 16 0 12 4 ··- . Midrib, anther wall, stigma, style --- 5.33 reject h homozygote 88 7 24 0 28 6 Midrib, anther wall, stigma, style 6.57 reject h homozygote
-31 pSMRJ 18R(50) ll2d To ---1---- not observed
~
---·-Tr pollen
---T, 89 1 ··-r - - -17 I 13.5 4.5 pollen: non 3.62 accept hypothesis heterozygote
!--·
-·-90 5 -16 I 12.75 4.25 - pollen: non - - - - 3.31 acce t hypothesis heterozygote 91 8 19 I 15 5 pollen: non 4.27 rejec_!Jlypothesis homozygote
- --- --· - - - - ---
-32 pSMRJ 18R(?..QL 132a To not observed
Tr
-- · whole palea/lemma, anther wall and or ]JOlle~-- - - ·
T, 92 4 17 7 18 6 whole paleallemma, anther wall:pollen 0.22 accept hypothesis heterozygote 93 6 24 0 18 6 __ _::vhole paleallemma, anther wall 8.00 re·ect h othesis homoz ote 94 5 __ _ 24 0 18 6 whole paleallemma, anther wall · - - - - 8.00 reject hypo!_hesis homozygote
- . - --
---~--33 pSMRJI8R(I/2) 6d T,, vascular bundle palea/lemma, trichome, anther wall Tr - - vascular bundle palea/lemma, trichome. anther wall
- · · - - ·
---T, 95 6 15 9 18 6 vascular bundle, midrib or whole, anther wall:pollen 2.00 accept h~thesis
96 7 0 24 18 6 anther wall, pollen 72.00
·-- - - ·
97 3 22 2 18 6 vasc11lar bundle, midrib or whole, anth~r wall:poll~ 3.56
--- - - - · - · - - --- 1----·- -- - - - ---·- ---···-·---
-34 pSMRJ18R 2e T,,
- -r-- r-· not observed - - -
---- T, · 1 - - - vascular bundle palea/lemma, anther ~---
-T, 98 1 19 5 18 6 midrib, va~cu1ar bundle, anther, stigma:pollen 0.22 accept h othesis heterozygote 99 3 __ Q_ r· II 7.5 2.5 pollen ____ 36.40 ~ct hypothesis ... background
r--- - - · ---
--~--- --~--- --~--- --- 100 5 __ c__II__L__ 7 18 6 midrib, vascular bundle, anther,stigma:polle!!_ ______________ ---0.22 _accept -~the~-- heterozygote
---
chi-No. Constructs Lines G T-DNA No F Cl C2 Et E2 Expression patterns - squared P<O.OS (3.84) status
-
--35 pSKDI5.2 Ie To no expression
----~-·
r, - - - --- - - - -1 - - - no e'!Pressi_~---- ---- --- ---·~ .. --·-··
-·-r, 2 101 2 24 0 16 8 no ex£l:ession ___ 12.00 reject _hypothes!s homozygote
--- -- --- ·--·
102 3 24 0 16 8 no expression 12.00 reject hypothesis homozygote 103 6 24 0 16 8 no expression 12.00 reject hypothesis homozygote
-
---"~-
-36 pCI201 Tn - --.._ ____ not observed
- - -
---control r, whole flower, strong
----r, 104 I 20 4 16 8 whole flower, strong 3.00 accept hypothesis heterozygote ----·-·
105 3 17 7 16 8 whole flower, strong 0.18 accept hypothesis heterozygote
--
---106 7 15 5 15 5 whole flower, strong 0 accept hypothesis heterozygote
---· ~--- --- --- - - - ---
~---G: generation, F: family, C1& C2: actual number of plants for each class of observation and E1 & E2: expectated number of plants of each class.
This thesis contains no material which has been previously submitted for an academic record at this university or any other university and is the original work of the author,
except where acknowledged.
m
Acknowledgements
While writing the final paragraph of this thesis, I would like to thank the people who helped me over the years. First and foremost Dr. Andrzej Kilian, my principal supervisor for his constant dedication, guidance and advice during the course of my PhD in Center for Application of Molecular Biology to the International Agriculture (CAMBIA). Many thanks also to Professor Murray Badger and DL Dean for their generous helps and suggestions, both in science and administrative issues.
I would like to thank Dr. Richard Jefferson, my supervisor. Chairman and the CEO of CAMBIA for his welcome and supports during the course of my stay in CAMBIA.
Thanks also to Dr. Salvameena Rajagopal for teaching me to do rrice transformation, Emma Hely and Andriane Machado for supply of rice calli, Roslyn Henderson and Lorna Fitzpatrick for helping me with some media preparations. Mazz Plane for extraction of rice plant DNA. Kelli Gowland and Lijun Tian for keeping my plant alive in the greenhouse and taking samples and Liz Deaves for quick response to all my lab supplies needs.
I am very grateful for the friendliness, helpfulness and supports of all other colleagues, who already left or still in CAMBIA: Leon Smith, Vanessa Caig, Heidi Mitchell, Brent Thomson, Sujin Patarapuwadol, Margaret Evers, Helen Kilborn, Brian Weir, Jason Carling, Wim Broothaerts, Thach Tran, Peter Wenzl, Wei Yang, Damian Jaccoud, Paul Freeland, Xiqin Fu, Satya Nugroho, Nenita Desaremo. Bharat Char. Popeye Schnippenkoeter. Subhu Putcha. Kaiman Peng, Kasia and Grzegorz, Carolina Roa, Oanh Hoang and Tuan Nguyen ..
My thanks to my best friends, who shared laughs and tears during my stay in Canberra, Karina Arifin, Yulita kusumadewi, Mazz Plane and M einolf Klemens.
Thanks to my colleagues, Yuni and Seswita who helping me with any
administration issues during my absence.
I would like to thank Dr. Pasril Wahid, Dr. Azmi Dhalimi and Dr. Nurliani
Bermawie, Centre Research for Spice and Medicinal Crops (BALITTRO) for allowing
me to pursue my PhD and for all the supports.
During my stay in Canberra I was supported by the AusAid and CAMBIA, for
which I am truly grateful. In relation to that, I would like to thank Lynn Toohey for all the
AusAid administrations and to thank Chris Pratt for the arrangement and
The development of a system for the discovery of rice genes and their function is a
high priority. Two different [3-glucuronidase reporter gene cassettes (GUS and
GUSPius) and two GAL4/VP16 transactivator cassettes (with and without the
catalase-1 intron upstream of the GAL4/VPcatalase-16) as well as their relative position (catalase-1.6 kb and 7 kb
relative distances between the upstream activating sequence (UASGAL4) and the
CaMV35S promoter driving a hygromycin gene) within T -DNA were tested for their
performance in the Transcriptional Activator-Facilitated Enhancer trap (TAFET)
constructs to induce cell- or tissue-specific expression patterns in rice. A total of 10
T AFET constructs, including two negative controls, were developed and introduced into
the rice genome of varieties Millin and Nipponbare using Agrobacterium-mediated
transformation and about 1,000 rice TAFET lines were produced and investigated.
The GAL4/VP16 TAFET system was able to reveal varying levels of tissue
specific expression patterns in rice in the vegetative and generative tissues, and the
expression patterns were proven to be due to the activity of the GAL4/VP 16
transcriptional activator,
Most of the TAFET lines examined showed reporter gene expression in many
tissues. Patterns shown often in the vascular bundle, pericycle layer of cells in the root
suggest that the CaMV35S enhancers affected the expression patterns in numbers of
lines. However, the observed patterns are likely to be primarily due to a complex
interaction between rice genomic endogenous enhancers and elements within T-DNAs.
Most patterns observed in TAFET lines (91.7%) were inherited by the next
generations (T1 and T2 ) and segregated in Mendelian fashion. T-DNA inserts
lines contained a single T-DNA insertion and the average number of T-DNAs in the
whole TAFET population was 2.0.
The crossing experiments between selected GUS-TAFET lines and selected
Enhancer Green Fluorescence protein (EGFP) target lines proved that the GAL4NP16
TAFET system is capable of activating a gene (a reporter gene) adjacent to UAS. The
most likely mechanism of activation is through the GAL4 DNA binding domain
recognising the UASGAL4 , and the VP16 activating domain promoting transcription of a
gene linked to the UASGAL4· Expression patterns of EGFP reporter gene in F1 plants
were in general consistent with GUSPius patterns observed in parental GUS-TAFET
lines.
Attempts to generate phenotypic changes in floral tissues by induced ectopic
expression of the ZAG1 target gene from maize did not fully succeed, as the changes
were only limited to some spikelets. The positive control in these experiments, 35S
promoter driven over-expression of ZAG1, produced limited phenotypic consequences
(increased sterility in some plants), suggesting that the inability of the TAFET system to
induce clearly observable changes in floral development were due to poor expression
of the ZAG1 gene.
A number of TAFET lines showed phenotypic changes that segregated in T1
and T2 generations. An attempt to clone a gene responsible for a dramatic change in
floral development in line pSKC66. 1-8e failed due to the lack of a link between T -DNA
insertion and mutant phenotypes. Tos17 retrotransposon mobility during tissue culture
was determined to be the most likely cause of floral development change observed in
In general, good performance of the GAL4/VP16-based TAFET system was
determined both through observations of T AFET lines in several generations and
through sexual crossing with TARGET EGFP lines. The implication of this research is
that the system can be used to direct the expression of any gene under study (a target)
in specific tissue types to generate ectopic expressions and possibly also
Gain-of-Function (GoF) phenotypes. The TAFET system therefore can be applied in rice
functional genomics studies and could possibly contribute to the generation of a novel
Literature cited
Agrawal, G.K., Yamazaki, M., Kobayashi, M., Hirochika, R., Miyao, A., and Hirochika, H. (2001 ). Screening of the rice viviparous mutants generated by
endogenous retrotransposon Tos17 insertion. Tagging of a zeaxanthin epoxidase gene and a novel OsTATCgene. Plant Physiol125, 1248-1257.
Ahn, S., and Tanksley, S.D. (1993). Comparative linkage maps of the rice and maize
genomes. Proc Natl Acad Sci U S A 90, 7980-7984.
Ahn, S., Anderson, J.A., Sorrells, M.E., and Tanksley, S.D. (1993). Homoeologous
relationships of rice, wheat and maize chromosomes. Mol Gen Genet 241, 483-490.
Ainley, W.M., and Key, J.L. (1990). Development of a heat shock inducible expression
cassette for plants: characterization of parameters for its use in transient expression assays. Plant Mol Biol14, 949-967.
Alberts, B., Bray, D., Lewis, J., Raff, M., Roberts, K., and Watson, J.D. (1994).
Molecular Biology of the cell. Garland Publishing, Inc. New York & London.
Alonso, J.M., and Stepanova, A.N. (2003). T-DNA mutagenesis in Arabidopsis.
Methods Mol Bioi 236, 177-188.
Ambros, P., Matzke, AJM., Matzke, MA. (1986). Localization of Agrobacterium
rhizogenes T-DNA in plant chromosomes by in situ hybridisation. EMBO J 5, 2073-2077.
Angenent, G.C., Franken, J., Busscher, M., van Dijken, A., van Went, J.L., Dons, H.J., and van Tunen, A.J. 1995. A novel calss of MADS box genes is involved
in ovule development in petunia. Plant Cell 7(1 0), 1569-82.
Aoyama, T., and Chau, N.H. (1997). A glucocorticoid-mediated transcriptional
induction system in transgenic plants. Plant J 11, 605-612.
Aoyama, T., Dong, C.H., Wu, Y., Carabelli, M., Sessa, G., Ruberti, 1., Morelli, G., and Chua, N.H. (1995). Ectopic expression of the Arabidopsis transcriptional
activator Athb-1 alters leaf cell fate in tobacco. Plant Cell7, 1773-1785.
Babu, P.R., Sekhar, A.C., lthal, N., Markandeya, G., and Reddy, A.R. (2002).
Annotation and BAG/PAC localization of nonredundant ESTs from drought-stressed seedlings of an indica rice. J Genet. 81, 25-44.
Balasubramanian, S., and Schneitz, K. (2000). NOZZLE regulates proximal-distal
pattern formation, cell proliferation and early sporogenesis during ovule development in Arabidopsis thaliana. Development 127, 4227-4238.
Bancroft, 1., and Dean, C. (1993). Transposition pattern of the maize element-ds in
Arabidopsis thaliana. Genetics 134, 1221-1229.
Barakat, A., Carels, N., and Bernardi, G. (1997). The distribution of genes in the
170
Barakat, A., Gallois, P., Raynal, M., Mestre-Ortega, D., Sallaud, C., Guiderdoni, E., Delseny, M., and Bernardi, G. (2000). The distribution of T-DNA in the
genomes of transgenic Arabidopsis and rice. FEBS Lett 471 (2-3) 161-164.
Battraw, M.J., and Hall, T.C. (1990). Histochemical analysis of CaMV 35S
promoter-beta-glucuronidase gene expression in transgenic rice plants. Plant Mol Bioi 15, 527-538.
Baulcombe, D.C. (1999). Fast forward genetics based on virus-induced gene silencing.
Curr. Opin. Plant Bioi. 2, 109-113.
Bellen, H.J. {1999). Ten years of enhancer detection: Lessons from the fly. Plant Cell
11' 2271-2281.
Bellen, H.J., O'Kane, C.J., Wilson, C., Grossniklaus, U., Pearson, R.K., and Gehring, W.J. {1989). P-element-mediated enhancer detection:A versatile
method to study development in Drosophila. Genes Dev 3, 1288-1300.
Benfey, P.N., L. Ren, and Chua., N.-H. (1989). The CaMV enhancer contains at least
two domains which can confer different developmental and tissue specific expression patterns. EMBO J. 8, 2195-2202.
Benfey, P.N., Ren, L., and Chua, N.H. {1990). Combinatorial and synergistic
properties of CaMV 35S enhancer subdomains. EMBO J 9, 1685-1696.
Bennetzen, J. (2002). The rice genome - Opening the door to comparative plant
biology. Science 296, 5.
Bennetzen, J.L., and Freeling, M. (1993). Grasses as a single genetic system
-genome composition, collinearity and compatibility. Trends Genet. 9, 259-261.
Berens, C. and Hillen, W. {2003). Gene regulation by tetracyclines: Constrains of
resistance regulation in bacteria shape TetR for application in eukaryotes. Eur.
J. Biochem. 270, 3109-3121.
Biswass, K., Neumann, R., Haga, K., Yatoh, 0., and Lino, M. (2003).
Photomorphogenesis of rice seedlings: a mutant impaired in phytochrome-mediated inhibition of coleoptile growth. Plant Cell Physiol 44.
Bohmann, D., Keller, W., Dale, T., Scholer, H.R., Tebb, G., and Mattaj, I.W. (1987).
A transcription factor which binds to the enhancers of SV40, immunoglobulin heavy chain and U2 snRNA genes. Nature 325, 268-272.
Bohner, S., Lenk, 1.1., Rieping, M., Herold, M., and Gatz, C. (1999). Technical
advance: transcriptional activator TGV mediates dexamethasone-inducible and tetracycline-inactivatable gene expression. Plant
J
19, 87-95.Bonifer, C. {2000). Developmental regulation of eukaryotic gene loci: which
cis-regulatory information is required? Trends Genet 16, 310-315.
Borevitz, J.O., Xia, Y., Blount, J., Dixon, R.A., and Lamb, C. (2000). Activation
tagging identifies a conserved MYB regulator of phenylpropanoid biosynthesis. Plant Cell 12, 2383-2394.
Bouche, N., and Bouchez, D. (2001 ). Arabidopsis gene knockout: phenotypes wanted.
Brand, A.H., and Perrimon, N. (1993). Targeted gene expression as a means of
altering cell fates and generating dominant phenotypes. Development 118, 401-415.
Brand, A.H., and Dormand, E.L. (1995). The GAL4 system as a tool for unravelling
the mysteries of the Drosophila nervous system. Curr Opin Neurobiol 5, 572-578.
Breyne, P., Gheysen, G., Jacobs, A., Van Montagu, M., and Depicker, A. (1992).
Effect of T-DNA configuration on transgene expression. Mol Gen Genet 235, 389-396.
Briza, J., Carroll, B.J., Klimyuk, V.I., Thomas, C.M., Jones, D.A., and Jones, J.D.
(1995). Distribution of unlinked transpositions of a Ds element from a T-DNA locus on tomato chromosome 4. Genetics 141, 383-390.
Burns, N., Grimwade, B., Ross-Macdonald, P.B., Choi, E.Y., Finberg, K., Roeder, G.S., and Snyder, M. (1994). Large-scale analysis of gene expression, protein
localization, and gene disruption in Saccharomyces cerevisiae. Genes Dev. 8, 1087-1105.
Cadigan, K.M., Grossniklaus, U., and Gehring, W.J. (1994). Functional
redundancy-the respective roles of redundancy-the two sloppy paired genes in drosophila segmentation. Proc Natl Acad Sci U S A 91 , 6324-6328.
Campisi, L., Yang, Y.Z., Vi, Y., Heilig, E., Herman, B., Cassista, A.J., Allen, D.W., Xiang, H.J., and Jack, T. (1999). Generation of enhancer trap lines in
Arabidopsis and characterization of expression patterns in the inflorescence. Plant J. 17, 699-707.
Casadaban, M.J., and Cohen, S.N. (1979). Lactose genes fused to exogenous
promoters in one step using a Mu-lac bacteriophage: in vivo probe for transcriptional control sequences. Proc Natl Acad Sci U S A 76, 4530-4533.
Castelli-Gair, J., Greig, S., Micklem, G., and Akam, M. (1994). Dissecting the
temporal requirements for homeotic gene function. Development 120, 1983-1995.
Chaudhury, A.M., Craig, S., Dennis, E., and Peacock, W. (1998). Ovule and embryo
development, apomixis and fertilization. Curr. Opin. Plant Bioi. 1, 26-31.
Chin, H.G., M. S. Choe, S-H. Lee, S. H. Park, S. H. Park, J. C. Koo, N. Y. Kim, J. J. Lee, B. G. Oh, G. H. Vi, S. C. Kim, H. C. Choi, M. J. Cho, and C-d. Han.
(1999). Molecular analysis of rice plant harboring an Ac/Ds transposable element mediated gene-trapping system. Plant J. 19, 1-9.
Christou, P. (1997). Rice transformation: bombardment. Plant Mol. Bioi. 35, 197-203.
Chung, Y.Y., Kim, S.R., Finkel, D., Yanofsky, M.F., and An, G. (1994). Early
flowering and reduced apical dominance result from ectopic expression of a rice MADS box gene. Plant Mol. Bioi. 26, 657-665.
Chung, Y.Y., Kim, S.R., Kang, H.G., Noh, Y.S., Park, M.C., Finkel, D., and An, G.