Published By:
Abstract: Nowadays, data generation is huge in nature and there is a need for analysis, visualization and prediction. Data scientists find many difficulties in processing the data at once due to its massive nature, unstructured or raw. Thus, feature extraction plays a vital role in many applications of machine learning algorithms. The process of decreasing the dimensions of the feature space by considering the prime features is defined as the dimensionality reduction. It is understood that with the dimensionality reduction techniques, redundancy could be removed and the computation time is decreased. This work gives a detailed comparison of the existing dimension reduction techniques and in addition, the importance of Principal Component Analysis is also investigated by implementing on the animal classification. In the present work, as the first phase the important features are extracted and then the logistic regression (LR) is implemented to classify the animals.
Index Terms: Dimensionality Reduction, Feature Extractiion, Classification, Logistic Regression, PCA.
I. INTRODUCTION
Recent developments in technologies have been experienced tremendous insurrection in various fields such as medicine, agriculture, astronomy and commercial applications[1-2]. With the emergence of the big data, dimensionality reduction techniques are used for handling the complex nonlinear data. Hence, to perform these dimensionality reduction techniques, conventional classification techniques need a huge amount of memory and CPU resource. For example, consider the database of emails and in order to classify whether the email is spam or not, many machine learning algorithms could be applied. There are several approaches that could be categorized as feature extraction and selection as referred in [3-4]. In the case of real world dimensionality reduction problems, feature extraction approaches perform well rather than feature selection approaches. The objective of these algorithms is to project the
high dimensional data into a lower dimensional space with the help of algebraic transformations. Dealing with a huge dimensional data becomes more complex and hence the account of the variables that are given as input could be
Revised Manuscript Received on August 05, 2019.
Sumathi Doraikannan, CSE, VIT-AP University, Amaravathi, India.
Prabha Selvaraj, CSE, VIT-AP University, Amaravathi , India.
Vijay Kumar Burugari, CSE, KoneruLakshmaiah Education Foundation, Guntur, India.
reduced yet before the data mining algorithms are applied.The dimensionality reduction could be deployed in two special ways:
Feature selection technique is implemented in which the frequent and suitable attributes could be maintained in the dataset.
The redundancy of the input data could be used and in addition, a group might comprise of new variables and the variables that represent the same information could be joined together
Several methods could be applied statistically or mathematic ally to decrease the count of the variables. This technique could be referred as Dimensionality reduction. Dimensionality reduction often exploits the cutback of the issue of maintaining and modifying huge data sets. For this purpose, there are various related techniques which can be divided broadly into two categories.
A.Need For Dimension Reduction
Sensors deployed in various fields are used to collect the data. For example, the sensors deployed in the internet channel are used to collect the information about the traffic on a website directly from each web server. Regular collection of data is done which is used for analysis and interpretation. This process might lead to redundancy. The data that is collected by the sensor is raw and it is termed as event data and this is similar to the log files that are recorded in the web server. Let us take an example of racing competitions. In the competition, the position of a motor bike rider is monitored with a GPS sensor. His movement on the bike is used to measure through gyro meters. Multiple video feeds and his smart watch provide additional details. But due to various type of errors in recording, the data may not be the exact same way as one required for analysis. However, this leads to little extra information on position gained by using these additional sources. If the analyzer would like to predict the strategy of the biker the analyzer requires a lot of data in order to analyze.
This problem arose due to high unwanted dimensions and needs a treatment of dimension reduction. Hence, the utilization of more variables leads to many issues like time complexity, accuracy and space complexity. In order to avoid these issues, dimension reduction techniques come into the picture. Several benefits of dimension reduction techniques are described as given below
Customer relationship management „
Principal Component Analysis For
Dimensionality Reduction For Animal
Classification Based On LR
Text mining „
Image retrieval „
Microarray data analysis
B.Dimensionality Reduction Techniques
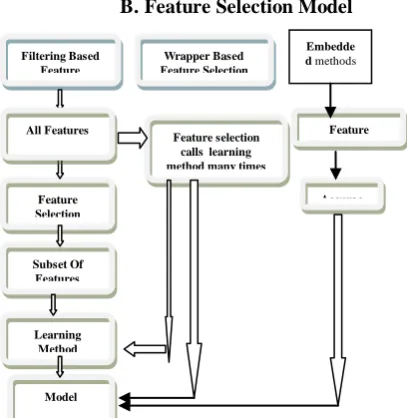
Dimensionality reduction techniques could be categorized as feature selection and feature extraction. Feature selection process could be deployed in three ways whereas feature extraction also could be implemented in three ways and it is depicted in the below figure 1.
Fig. 1: Techniques of Dimension Reduction
A.Feature Selection Techniques: Feature selection is also named as variable selection otherwise attributes selection. Regular choosing of the attributes is done in this method. Selection depends on the relevancy of the predictive modeling problem that the analysts would be working on. In this technique, the subset of pertinent features is chosen for the construction of the model and the same is displayed in the figure 2. It is enviable to have less attributes since it results in the less complexity of the model. In addition, the model might be very simple to be aware of and also looks easy for explanation.
(i)
Forward Selection: It is a method which is iterative in nature. At the initial stage, there are no features in this model. At the later stages, features are added so that the model could be improved until the inclusion of the new variable does not create an impact on the performance of the model. [image:2.595.59.263.592.801.2]B.Feature Selection Model
Fig. 2: Feature Selection Model
(ii)
Backward Elimination: Least Significant feature would be extracted at each iteration and therefore the performance of the model is analyzed. This method is efficient for discarding the small subset of features and it uses hill climbing approach.[5](iii)
Recursive Feature Elimination: The notion of thistechnique is to identify the best feature subset. The model is created repeatedly by considering the preeminent or the feature which does not produce proper results at each phase. The model checks with all features. As a result of this trial and error process, the ranking of the features stand on the order of their elimination is done.
C.Feature Reduction Techniques
It could be categorized into Linear and Non-Linear Techniques. Linear techniques could be categorized as
1. Linear Discriminant Analysis (LDA)
2. Latent Semantic Indexing (LSI)
3. Principal Component Analysis (PCA)
4. Partial Least Squares (PLS)
5. Canonical Correlation Analysis (CCA)
Non Linear techniques could be categorized as 1. Nonlinear feature reduction using kernels 2. Manifold learning
Linear Discriminant Analysis:
The objective of this technique is to decrease the dimensions of a x-dimensional dataset into a y-dimensional subspace where ( y< x).
1. The x-dimensional mean vectors for the different classes from the dataset has to be computed.
2. Scatter matrices has to be calculated.
3. (e1,e2,….ek) and (λ1, λ2, λ3 ,….. λk) - Eigen vectors and
eigen values must be computed.
4. The eigen vectors are arranged as per the decreasing order ot the eigen values and the eigen vectors with the largest eigen value is chosen so that a matrix could be formed of order x*y.
5. Using these values the samples are transformed onto the new subspace.
II. LITERATUREREVIEW
Maximum class separability is achieved through this Linear Discriminant Analysis (LDA) .In this technique, the features are transformed into a low dimension space and thus it leads to the maximization of the ratio between the class variance to the within class variance. LDA is used in several applications like face
recognition, speech
recognition, brain tissue Filtering Based
Feature Selection
Learning Method Feature Selection
Subset Of Features
Wrapper Based Feature Selection
Model All Features
Feature selection callslearning method many times
Embedde d methods
Feature Selection
Published By:
analysis and text classification. The input to the LDA is the group of high dimensional features that could be mapped into the lower dimensional space. Maximum discrimination could be acquired by decreasing the distance inside the class and increasing the distance between the class.
Quanquan Gu, Zhenhui Li, and Jiawei Han’s[6] objective is to determine the subset of features based on the learnt linear transformation through LDA that maximizes the fisher criterion. Since LDA considers all the features, it is very difficult to interpret the decision based on the features. Therefore, fisher score could be implemented for selecting the features to form a subset from the original features. The combination of fisher score and LDA could be performed so that both the techniques could be mutually enhanced. Fisher score is performed in the first stage and LDA is done in the second stage. But the entire process is found to be suboptimal due to the execution of the two approaches individually at two stages. Hence, the authors proposed the unified framework by integrating the Linear Discriminant Dimensionality Reduction (LDDR) with fisher score and LDA. LDDR does the process of feature selection and subspace learning concurrently based on the fisher criterion. Due to the combination, it is observed that the irrelevant features have been discarded and the relevant features could be transformed.
A.Canonical Correlation Analysis (CCA)
The linear relationship between two multidimensional variables is measured. The objective of CCA is to determine the association among the pair of data sets. Haim Avron et al [7]proposed a fast algorithm for close accuracy of Canonical Correlation Analysis (CCA). The proposed algorithm is deployed on the pair of thin-and-tall matrices. As the first phase, the size of the input matrices is reduced and CCA algorithm is applied to the new pair of matrices. This algorithm is found to be proved guarantee for an approximation CCA as it requires asymptotically less operations rather than the innovative algorithms algorithms. Thus, the author’s aim is to achieve the dimensionality reduction technique to hasten the CCA.
B.Latent Semantic Indexing
Singular Value Decomposition (SVD) is used to determine the latent semantic space and it is considered as a influential process since the rectangular matrix is simplified and converted into a product of three distinct components. The objective of the SVD is to extract the sufficient information in such a way that the structure must be pertinent and should spans the original term-document matrix. Chelsea Boling and Kumar Das [8] implemented SVD with the help of Latent Semantic Analysis (LSA) in order to determine the relations with client’s queries in a sample of documents. The suitable aspect for a reduced representation is appropriate to
denote the original latent space. The objective of SVD is to surmount the issues that occurred due to the unsatisfaction that is obtained with the indexed results which is used to determine the associations among the terms and documents.In this work, the term frequency-inverse document frequency weighting on the matrix is not computed and polysemy was not focused since the corpus did not have the same terms.
C.Independent Component Analysis
Independent Component Analysis (ICA) is an example for statistical data analysis since it is mainly used to lessen the dimensions of multivariate data set by verifying the “interesting projections” as per the projection index. ICA seems to find out all the components and also the directions in which the projected components are found to be the” most independent” in order to compute the independence. From the work done by M. Lennon et al, it is observed that the authors have derived a model for ICA and the same is given below:
x= As -- (1)
x : Vector of observed signals
A : Scalar matrix of mixing coefficients s : Vector of source signals
This technique needs 2 hypothesis. They are H1 and H2. H1 : si of s components are statistically independent .
H2 : si of s components have non Gaussian distribution.
The issues in ICA could be described as follows:
1. The variances (energies) of the independent components si
could not be identified.
2. The order of the independent components could not be resolved.
Jing Wang and Chein-I Chang (2006) [9] utilized Independent Component Analysis (ICA) approach to Dimensionality Reduction (DR) which is known as ICA-DR. This approach makes use of the mutual information as a constraint so that the data statistical independency that surpasses the second order statistics is measured. Therefore this is used to capture the information which could not be preserved by the second-order statistics based DR techniques. In addition, the Virtual Dimensionality (VR) is used to quantify the dimensions that are needed to be maintained as in contrast to the energy percentage used by the Principal Component Analysis-DR (PCA-DR) and Maximum Noise Fraction-DR(MNF-DR) to identify the energy supplied by signal sources and noise. Further, constraints and algorithms were developed so that the importance of the information embedded in the ICA-generated components for the prioritization of the components has been measured. Elena Shchurenkova [10] utilized the ICA in order to resolve the issues that arise due to the selection of the fewer components with the squared Euclidean norm from the original dimension of the data that estimates the original dataset without the previous knowledge. The quid pro-quo among the number of independent components maintained in the model and the information loss is investigated. The work is been carried out on the
D.Principal Component Analysis (PCA)
It is a linear technique [11, 12,13] which is used or dimensionality reduction by implanting the data into a linear subspace of low dimension. The objective of the PCA is to obtain the data that has the highest variance. New features are created through the linear grouping of the preliminary features. The instance of the data set is mapped in the x dimensional space to ydimensional subspace such that x < y. The set of y- new dimensions generated are called the Principal Components (PC). The principal component is bounded towards the maximum variance that gets excluded since it has been considered in all its preceding components. Consequently, the initial module covers the largest variance and then each module that trails might cover up the minimum value of variance. The Principal Components can be represented as the following where PCi — Principal
Component ‘i’; Xj — original feature ‘j’; aj— numerical
coefficient for Xj. PCi = a1X1 + a2X2 + · · · + adXd [1].
A modified version of PCA has been devised by S. Brauckhoff et al. (2009)[14]. It makes the utilization of the data that could be correlated across the several metrics. Certain problems that occurs during the implementation of PCA are
the temporal correlation in the data.
the non-stationary of the data
complexity in identifying the proper number of
components
The author addressed the problem of the temporal correlation by the proposed solution and from the experimental results, a significant improvement is shown.
D.NON-LINEAR TECHNIQUES
A. Kernel PCA
To capture the non linear relationships, kernel PCA is used. From various studies, it has been identified that the PCA computation is done by the eigenvalue decomposition of the input covariance matrix.
Cx= 1/N X Xt .
A. LLE (Locally Linear Embedding)
This is another method which is used to resolve the problem of nonlinear dimensionality reduction. Fox example when a dataset of dimension ‘n is considered for mapping into a single global coordinate system so that the relationship among the various neighboring points are conserved [15]. An approach which is near to LLE is the use of Laplacian eigen Method(LEM). This approach initiates the process by creating the weighted graph of ‘t’ nodes and set of edge connecting the nodes through the edges. The neighborhood graph could be created by identifying the ‘k’ nearest neighbors or by selecting all points that are located within the fixed radius[15].
[image:4.595.317.532.288.610.2]Traditional Algorithm Steps:
Fig. 3 PCA process
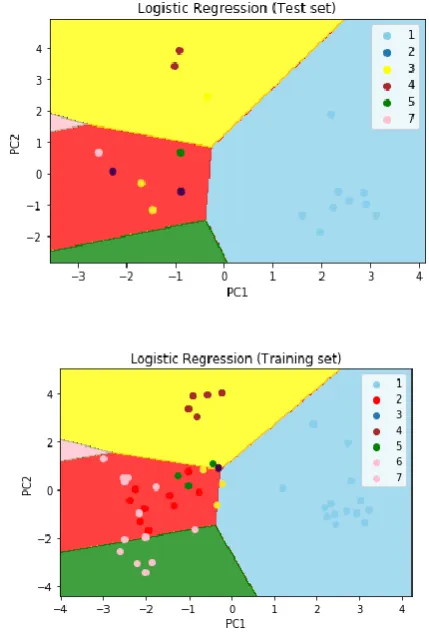
PCA could be applied in various real time implementations like face recognition system, image processing. The proposed work is implemented on the zoo dataset and the process of identification of the key attributes is shown. The process of the PCA is shown in the above figure 3. The dataset comprises of 35 attributes such as name, egg, milk, feather, hair and so on. This dataset consists of 46 records. From the given set of attributes, the selection of the attributes is complex and hence PCA is implemented in order to choose the most important attributes. In this implementation, dataset is divided into training dataset and test dataset. Training set consists of 80 records with 2 attributes for X-axis and one attribute for Y-axis. Test dataset comprises of 10 records for both X and Y axis with one attribute. The algorithm is implemented and the results is shown in the below figure 4.
Figure 4. Zoo animal classification
[image:4.595.55.285.698.777.2][image:5.595.55.284.67.349.2]
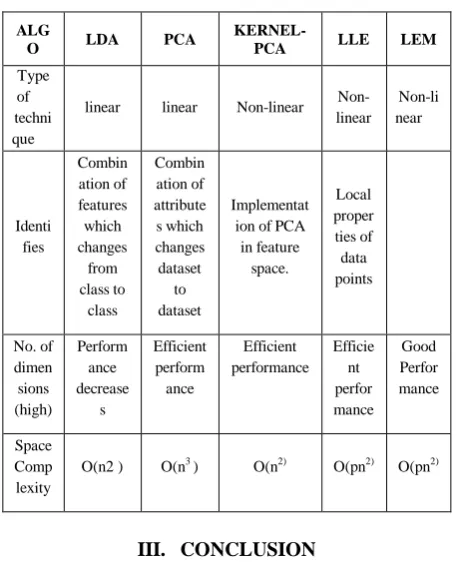
Published By: Table 1: Comparison of Various Algorithms
ALG
O LDA PCA
KERNEL-PCA LLE LEM
Type of techni que
linear linear Non-linear Non- linear Non-li near Identi fies Combin ation of features which changes from class to class Combin ation of attribute s which changes dataset to dataset Implementat ion of PCA in feature space. Local proper ties of data points No. of dimen sions (high) Perform ance decrease s Efficient perform ance Efficient performance Efficie nt perfor mance Good Perfor mance Space Comp lexity
O(n2 ) O(n3 ) O(n2) O(pn2) O(pn2)
III. CONCLUSION
Dimensionality reduction is not restricted to one application or one area. It can be applied to many fields with machine learning algorithms. Using PCA techniques it becomes easy to differentiate between different categories of same class. It helps to achieve better results within short span of time with little efforts. Through the PCA, the features of animal are extracted and thus with the help of logistic regression, the animal classification is done. From the investigations, it has been understood that the accuracy has been proved to be 90% and the classes have been distinguished.
REFERENCES
1. Available: http://www.halcyon.com/pub/journals/21ps03-vidmar 2. B.-Y. Ricardo and R.-N. Berthier, Modern Information Retrieval. Addison
Wesley Longman, 1999.
3. M. Spitters, “Comparing Feature Sets for Learning Text Categorization,” Proc. Int’l Conf. Computer-Assisted Information Retrieval, pp. 233-251, 2000.
4. D.D. Lewis, “Feature Selection and Feature Extraction for Text Categorization,” Proc. Workshop Speech and Natural Language, pp. 212-217, 1992.
5. H. Li, T. Jiang, and K. Zhang, “Efficient and Robust Feature Extraction by Maximum Margin Criterion,” Proc. Conf. Advances in Neural Information Processing Systems, pp. 97-104, 2004.
6. Jović , K. Brkić and N. Bogunović, “A review of feature selection methods with applications”, https://bib.irb.hr/datoteka/763354.MIPRO_2015_JovicBrkicBogunovic. pdf
7. Quanquan Gu, Zhenhui Li and Jiawei Han, Linear Discriminant Dimensionality Reduction, in Proc of the 21st European Conference on Machine Learning and Principles and Practice of Knowledge Discovery in Databases (ECML/PKDD’11), Athens, Greece, pp.549-564, 2011. 8. Haim Avron, Christos Boutsidis, Sivan Toledo, Anastasios Zouzias:
Efficient Dimensionality Reduction for Canonical Correlation Analysis. SIAM J. Scientific Computing 36(5) (2014).
9. Chelsea Boling, Kumar Das , “Reducing Dimensionality of Text Documents using Latent Semantic Analysis”, International Journal of Computer Applications (0975 – 8887) Volume 112 – No. 5, February 2015.
10.Person, K. (1901) On Lines and Planes of Closest Fit to System of Points in Space. Philiosophical Magazine, 2, 559-572. http://dx.doi.org/10.1080/14786440109462720
11.Jing Wang, Chein-I Chang,” Independent Component Analysis-Based Dimensionality Reduction With Applications in Hyperspectral Image
Analysis”, IEEE TRANSACTIONS ON GEOSCIENCE AND REMOTE SENSING, VOL. 44, NO. 6, JUNE 2006.
12.Elena Shchurenkova, “Dimension reduction using Independent Component Analysis with an application in business psychology”, https://open.library.ubc.ca › Browse Collections › UBC Theses and Dissertations.
13.Jenkins, O.C. and Mataric, M.J. (2002) Deriving Acion and Behavior Primitives from Human Motion Data. International Conference n Robots and Systems, 3, 2551-2556.
14.Jain, A.K. and Dubes, R.C. (1962) Algorithms for Clastering Data. Prentice Hall, Upper Saddle River.
15.Fukunaga, K. (1982) Intrinsic Dimensionality Extraction, in Classification, Pattern Recognition and Reduction of Dimensionality, Vol. 2 of Handbook of Statistics, North Holland, 347-362.
16.Daniela Brauckhoff, Kavé Salamatian, Martin May. Applying PCA for Traffic Anomaly Detection: Problems and Solutions. Proceeding of IEEE INFOCOM 2009„ Apr 2009, Rio de Janeiro, Brazil. pp.2866-2870, ff10.1109/INFCOM.2009.5062248ff. ffhal-00620090
17. Ghodsi, Ali. (2006). Dimensionality Reduction A Short Tutorial. 18.Y. Li, L. Xu, J. Morphett, and R. Jacobs, “An Integrated Algorithm of
Incremental and Robust PCA,” Proc. Int’l Conf. Image Processing, pp. 245-248, 2003.
19.Ringberg, H., et al., 2007. Sensitivity of PCA for traffic anomaly detection. ACM SIGMETRICS Perform. Eval. Rev. 35 (1). http://www.unb.ca/research/iscx/dataset/iscx-IDS-dataset.html (18.02.16) Issariyapat, C., Kensuke, F., 2009. Anomaly detection in IP networks with Principal Component Analysis. In: Communications and Information Technology, IEEE. http://kdd.ics.uci.edu/databases/kddcup99/kddcup99.html
20.Daniela Brauckhoff, Kavé Salamatian, Martin May. Applying PCA for Traffic Anomaly Detection: Problems and Solutions. Proceeding of IEEE INFOCOM 2009„ Apr 2009, Rio de Janeiro, Brazil. pp.2866-2870, ff10.1109/INFCOM.2009.5062248ff. ffhal-00620090f
21.Sam T. Roweis and Lawrence K. Saul,” Nonlinear Dimensionality Reduction by Locally Linear Embedding”, http://www.robots.ox.ac.uk/~az/lectures/ml/lle.pdf.
AUTHORSPROFILE
Dr.D.Sumathi is presently working as a Associate Professor, School of Computer Science and Engineering, at VIT-AP University, Andhra Pradesh. She received the B.E Computer science and Engineering degree from Bharathiar University in 1994 and M.E Computer Science and Engineering degree from Sathyabama University in 2006, Chennai and completed her doctorate degree in Anna University, Chennai. She has secured 9th rank in the university. She has overall experience of 16 years out of which 6 years in industry, 10 years in teaching field. Her Research interests include Cloud computing, Network Security, Data Mining and Theoretical Foundations of computer science. She has published papers in International journal and conference. She has organized many international conferences and also acted as Technical Chair and tutorial presenter. She is a life member of ISTE. She has published few chapters in books under Wiley and IGI Global publications.
Dr. Prabha Selvaraj is working as a Assistant Professor in School of CSE in VIT-AP University, Andhra Pradesh. She has completed her B.E CSE, M.E CSE and PhD in Anna University, Chennai and has 20+ years of experience in teaching and industry. Her research interests include Data Mining, Recommendation System, Query Processing, Security, Wireless Sebsor Network, IoT and Information Retrieval System. She has published 25 papers in various national and International journals and conferences and four book chapters in IGI and Wiley in the area AR, Big data analytics, IoT and WBAN. She has published a patent titled “Rear view optimized Safety Helmet”. She has received Top 25 award best faculty in CSE.
Dr Vijay Kumar Burugari Vijay Kumar Burugari, is working as a Associate Professor, Department of Computer Science and Engineering in K L University Vadeeswaram, Andrpradesh. He has completed his B.Tech. (Computer Science and Engineering) from Tirumala