Abstract: Currently, the automatic lung cancer classification remains a challenging issue for the researchers, due to noisy gene expression data, high dimensional data, and the small sample size. To address these problems, an enhanced gene selection algorithm and multiclass classifier are developed. In this research, the lung cancer-related genes (GEO IDs: GSE10245, GSE19804, GSE7670, GSE10072, and GSE6044) were collected from Gene Expression Omnibus (GEO) dataset. After acquiring the lung cancer-related genes, gene selection was carried out by using enhanced reliefF algorithm for selecting the optimal genes. In enhanced reliefF gene selection algorithm, earthmover distance measure and firefly optimizer were used instead of Manhattan distance measure for identifying the nearest miss and nearest hit instances, which significantly lessens the “curse of dimensionality” issue. These optimal genes were given as the input for Multiclass Support Vector Machine (MSVM) classifier for classifying the sub-classes of lung cancer. The experimental section showed that the proposed system improved the classification accuracy up to 3-10% related to the existing systems in light of accuracy, False Positive Rate (FPR), error rate, and True Positive Rate (TPR).
Index Terms: Enhanced reliefF algorithm, firefly optimizer, gene selection, microarray gene expression, multiclass support vector machine.
I. BACKGROUND
In present decades, lung cancer is the common cause of death among people. So, the early recognition of lung cancer increases the chance of survival rate [1-2]. Presently, gene- level treatment is a promising technique, which effectively identifies the normal and abnormal patients [3]. The available microarray gene expression data are noisier, high dimensional and small sample size, whereas only some genes plays a crucial role in the detection of lung cancer [4]. In present scenario, several methods are developed for gene level lung cancer detection, which is majorly sub-divided into two categories such as, filtering and wrapper methods [5]. Generally, the filtering methodologies are feature ranking methodologies, which works on the basis of gene selection. Some of the common methods used for gene selection are adaptive genetic algorithm [6], Bayesian lasso quantile regression [7], learning automata-based genetic algorithm [8], reliefF algorithm [9], etc. Similarly, the wrapper methods find effective gene subsets on the basis of classifier like
Revised Manuscript Received on August 02, 2019.
Ashok K Patil, School of Computing and Information Technology, Reva University, Bangalore, India.
Siddanagoda S Patil, Agril Statistics, Applied Mathematics & Computer Science, University of Agricultural Sciences, Bangalore, India.
M Prabhakar, School of Computing and Information Technology, Reva University, Bangalore, India.
random forest [10], nearest neighbour classifier [11], etc. Though, the above-mentioned methods have their own limitations such as, consumes more processing time, unable to solve complex technological and scientific problems, etc. In order to overcome these problems, an efficient system is developed to determine lung cancer in an early stage. In this research paper, a new automated system has been developed for improving the performance of lung cancer detection. Initially, the input data were collected from GEO dataset (GEO IDs: GSE10245, GSE19804, GSE7670, GSE10072, and GSE6044). After collecting the input data, gene selection was carried out using enhanced reliefF algorithm on individual GEO IDs. In enhanced reliefF, earthmover distance was used instead of Manhattan distance measure for identifying the nearest miss and nearest hit instances. Here, earthmover distance measure uses only a limited number of genes for representing the data that effectively reduces the “curse of dimensionality” issue. Additionally, firefly optimizer was included in conventional reliefF algorithm to select the user defined parameter. Since, firefly optimization algorithm requires only a minimum number of iterations to select the user defined parameter, so the computational complexity was very low compared to other optimization algorithms. Then, the output of gene selection was given as the input for MSVM classifier for classifying the sub-classes of lung cancer such as, normal, small cell lung cancer, adenocarcinoma, and squamous cell carcinoma. At last, the proposed system performance was compared with the existing systems in light of accuracy, FPR, error rate, and TPR. This research paper is pre-arranged as follows. In section II, numerous research papers on gene level lung cancer detection are evaluated. Explanation about the proposed system is given in section III. Section IV illustrates the quantitative analysis of the proposed system. The conclusion is made in section V.
II. RELATED WORK
In recent decades, several methods by the researchers in lung cancer detection using microarray data. In this segment, some major contributions to the earlier research papers are presented. S. Wu, H. Jiang, H. Shen, and Z. Yang, [12] developed a new methodology for gene selection named as L1/2 logistic regression model. In this research work, the developed method uses new univariate half thresholding for updating the estimated coefficients.
Optimal Classification of Lung Cancer Related
Genes using Enhanced reliefF Algorithm and
Multiclass Support Vector Machine
In experimental phase, the developed system was tested on three online available datasets such as, GSE10072, GSE19804, and GSE4115. The developed system outperformed the existing methods (L1 and LEN) by means of classification accuracy. The developed system was not advisable to use gene selection algorithms for analytical issues, because the developed system consumes more time to find the solutions with a few computational steps.
H. Azzawi, J. Hou, R. Alanni, Y. Xiang, R. Abdu-Aljabar and A. Azzawi, [13] utilized a new Gene selection programming (GSP) methodology for selecting the appropriate genes for effective lung cancer classification. The GSP method comprises of three main phases such as, recombination mechanism, defining fitness function and improved mutation. After selecting the appropriate genes, classification was carried out by using SVM classifier. In this research work, the experimental result was tested on ten microarray datasets. The comparison valuation states that the developed methodology performed well related to the existing methods in light of computational cost, number of selected genes and classification accuracy. The developed method consumes more processing time, which was considered as one of the major issues.
M. Sun, K. Liu, Q. Wu, Q. Hong, B. Wang and H. Zhang, [14] developed a binary decomposition method and Gene Expression Programming (GEP) system for determining the lung cancer genes from microarray data. The prediction performance of the developed system was compared with three traditional classifiers; nearest neighbour, SVM and C4.5 on a real microarray lung cancer dataset. The experimental outcome showed that the developed system outperformed the existing classifiers by means of standard deviation, and accuracy. Since, the developed method was unable to solve complex problems in both technically and scientifically.
R. Al-Anni, J. Hou, R.D.A Abdu-aljabar and Y. Xiang, [15] utilized GEP method for detecting the non-small cell lung carcinoma. The developed method chooses the informative genes to construct an effective prediction model in order to achieve higher accuracy. The developed method was validated on two microarray datasets (GSE 68465, and GSE 8894) in order to show the effectiveness of developed system. In this research work, all the genes were treated equally, so the necessary genes were varied in dissimilar biological activities, which was considered as one of the major problems in the developed methodology.
H. Azzawi, J. Hou, Y. Xiang, and R. Alanni, [16] developed a new GEP model for detecting the lung cancer from microarray data. In this research, two gene selection algorithms were utilized to extract the lung cancer related genes. Here, the performance of the developed system was compared with three traditional classifiers; multi-layer perceptron, SVM and radial basis function neural network on a real micro-array lung cancer dataset (GSE10245). The experimental result showed that the developed system outperformed the existing classifiers by means of accuracy, sensitivity and specificity. The developed algorithm imposes a greater computational demand that leads to longer training times.
In order to overcome the above-mentioned problems, a new enhanced gene selection algorithm is developed for
improving the performance of lung cancer classification.
III. PROPOSEDMETHODOLOGY
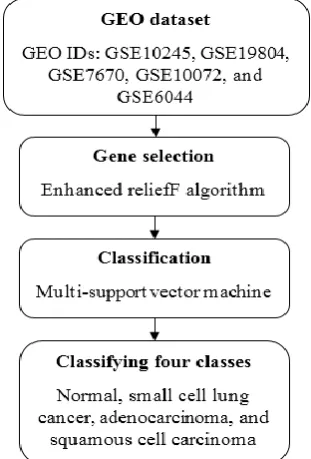
[image:2.595.358.514.281.511.2]In present scenario, microarray dataset is an emerging tool for representing the cell state at the molecular level. Usually, the available microarray databases are larger in size compared to other datasets, which leads to curse of dimensionality issues. So, optimal gene selection is a promising technique to address this problem and also it plays a crucial role in the development of effective classification. In addition, gene selection and classification address several issues such as, choosing the most relevant genes to improve the classification outcome, and eliminate the noisy and irrelevant genes. In this research paper, the proposed system comprises of three phases; data collection, gene selection and optimization, and classification. Fig. 1 represents the working procedure of proposed system. The detailed explanation about the proposed system is given below.
Fig. 1. Working procedure of proposed system A. Data collection
In this paper, GEO dataset is undertaken to assess the performance of proposed system in lung cancer detection. GEO dataset is an online available dataset that comprises of original submitter supplied records like sample, series and platform. A few series related to lung cancer are considered in this research work such as GSE10245, GSE10072, GSE6044, GSE7670, and GSE19804.
GSE10245 ID: It contains more than 54675 genes and 58 lung cancer cases. Among these cases, 40 patients are lung cancer patients and the remaining 18 patients are healthy patients.
GSE6044 ID: It comprises of 8793 genes, 47 samples and 4 classes (ten adenocarcinoma patients, five squamous cell carcinoma patients, five normal patients and nine small cell lung cancer patients).
GSE7670 ID: It contains 22283 genes and 62 adjacent normal-tumour matched lung cancer (adenocarcinoma) samples.
GSE19804 ID: It contains 54676 genes and120 lung cancer cases. Among these cases, 60 are female smoker samples and the remaining 60 are non-smoker female samples.
B. Gene selection using enhanced reliefF algorithm After collecting the data, enhanced reliefF algorithm is utilized to choose the optimal genes, which are effective to perform better classification. In conventional reliefF algorithm, Manhattan distance measure is used to identify the nearest hit and miss values. In most of the circumstances, conventional reliefF algorithm is very effective. While using large datasets, reliefF algorithm leads to “curse of dimensionality” problem. In order to address this issue, a minor modification is done in the conventional reliefF algorithm. In this research, earthmover distance and firefly optimization algorithm are utilized instead of using. Manhattan distance for identifying the nearest miss and
nearest hit instances. The major benefit of earthmover distance measure is that it needs only limited time for deciding the distances between the instancesIi. Although,
earthmover distance measure utilizes only limited number of genes to represent the data that is enough to attain accurate neighborhood selection and better prediction and also it completely reduces the “curse of dimensionality” problem.
At first, reliefF gene selection algorithm randomly chooses the instances Ii and then searches for k nearest neighbor in
the same class is named as nearest hit hj and in the
dissimilar classes is named as nearest miss mj . Here,
earthmover distance measure is utilized to identify the nearest missmj and nearest hit hj instances. Then, update
the quality estimation Q a
for all the attributes a thatmainly depends on the values ofI h and mi, j j. If the instances
j
h andIi have similar values, then the attribute a is
separated into two instances with the similar classes that minimizes the quality estimationQ a . Correspondingly, if
the instances hj and Ii have dissimilar values, then the
attribute a is separated into two instances with the dissimilar classes that maximizes the quality estimationQ a . The entire mechanism is repeated for M times, whereM is denoted as user defined parameter. In this research work, the user defined parameter is fixed by using firefly optimization algorithm. Since, the firefly optimization algorithm has good efficiency for certain issues and also it needs only a minimum number of iterations. In enhanced reliefF algorithm, the quality estimation Q a
is updated using the Eq. (1), (2), and(3).
Q a Q a hm (1)
Where,
1
, , /
k
i j j
h d a I h k
(2)
1 , ,
1
P C k
m C cl I j d a I mi j C k
i P Ii
(3)
Where,C is denoted as total number of classes, d is specified as distance between the selected instancesI P Ci,
is denoted as prior class, and cl I
i is stated as class of theth
i sample.
1) Firefly optimization algorithm
Firefly optimization algorithm is very superior in dealing with multimodal and global optimization concerns. The fire-fly optimization algorithm comprises of three idealized rules; attractiveness, unisex and brightness. Usually, all fire-fly insects are unisex, so it is attracted to other fire-flies on the basis of their sex. Brightness of the fire-flies are evaluated by the land-scape of the objective function. For a maximization issue, the brightness is directly proportional to the objective function. In addition, attractiveness is directly proportional to the brightness of a fire-fly, whereas the less bright fire-flies are attracted by the brighter fire-flies.
In addition, attractiveness between the two fire-flies are automatically decreased, if the distance between the two fire-flies are increased. The two major issues in fire-fly optimization algorithm are formulating the amount of absorbency and the difference in light intensity. For simplicity purpose, consider fire-fly absorbency with
luminosity that depends on the target functions. Since, fire-fly absorbency is proportional to the light intensity of adjacent fire-fly. The absorbency from fire-fly is
mathematically defined in the Eq. (4).
20
r
r e
(4)
Where, 0 is denoted as attractiveness at r0and is
represented as coefficients of light absorption at the source. The distance between the fire-flies j and i in the points xj
and xi is evaluated using the Eq. (5) on the basis of Cartesian
distance measure.
2, ,
1
d
ij i j i k j k
k
r x x x x
(5)Where,xi and xj are represented as spatial coordinates
of the fire-fliesi and j, and xi k, is denoted as k portion of
spatial coordination xi of fire-fly i in the two dimensional
state, which is mathematically rewritten in the Eq. (6).
2
2ij i j i j
In addition, the firefly movement and absorption of j
moves luminously determined in the Eq. (7).
2
1
0 2
r ij
x x e xi xj rand
i i
(7)
Where, the second term 2
0
r ij e
is denoted as attractiveness,
third term 1
2
rand
is indicated as randomization with a
parameter
, and r and is specified as random number generator, which ranges from 0,1 interval.In most of the cases,
0
is equal to one and 0,1 . The
parameter determines the variations in attractiveness and also its objective function value is essential in evaluating the speed of convergences and fire-fly optimization algorithm behavior. Ideally, the parameteris evaluated on the basis of
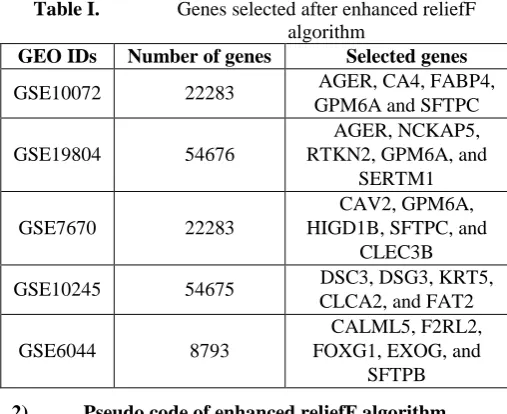
[image:4.595.41.295.329.536.2]absorbency changes that ranges within 0, . Table 1 details about the number of genes exists in the GEO IDs and the number of genes selected after employing enhanced reliefF algorithm. The pseudo code of enhanced reliefF gene selection algorithm is described below.
Table I. Genes selected after enhanced reliefF algorithm
GEO IDs Number of genes Selected genes
GSE10072 22283 AGER, CA4, FABP4,
GPM6A and SFTPC
GSE19804 54676
AGER, NCKAP5, RTKN2, GPM6A, and
SERTM1
GSE7670 22283
CAV2, GPM6A, HIGD1B, SFTPC, and
CLEC3B
GSE10245 54675 DSC3, DSG3, KRT5,
CLCA2, and FAT2
GSE6044 8793
CALML5, F2RL2, FOXG1, EXOG, and
SFTPB
2) Pseudo code of enhanced reliefF algorithm Input: Vector of class values and attribute values are assigned to each training instances.
Output: Quality estimationQof the attributes. 1. Assign all weights Q a
: 0, 0;2. For i1 to M do begin
3. Randomly choose the instancesIi
4. Identify k nearest hits hj; using earthmover
distance measure
5. For every class Cclass Ii
do6. From class identify the k nearest missesm C
j ;
using earthmover distance measure 7. Fora:1
8.
, , / 1 , , 1 1 kQ a Q a d a I hi j k
j
k P C
d a I m C
C cl Ii i j
P cl Ii j
9. User defined parameter is assigned using firefly optimization algorithm.
10. End
C. Classification using non-linear MSVM classifier After obtaining the optimal genes, classification is carried-out using MSVM classifier. Usually, binary SVM is a two-class classification method. Hence, it is essential to concentrate on the multi binary classification issues for extending the normal SVM classifier to multi-class SVM classifier. In SVM classification method, the multi-class classification is rehabilitated into th
n two class and th i
two-class issues, where class i is distinct from the remaining classes. The two important methodologies in SVM classifier are One-Against-All (1-a-a) and One-Against-One (1-a-1). In this scenario, 1-a-a method gives solution to create a binary classifier for every class that helps to separate the objects in the same classes. In nth class, 1-a-a method generates nth
binary classifiers, and the th
i classifier is trained with the data samples in ithclass with the positive labels and the residual
data samples are trained with the negative labels. The result of nth class in 1-a-a method relates with the 1-a-1 method for obtaining the highest output value. In addition, the 1-a-1 method is the resultant of previous researches on two class classifier.
The MSVM classifier generates all possible two class classifiers from the training sets of nth classes, and it trains only two out of nth classes that results in n
n 1 / 2
classifiers. In MSVM, decision function is an active way to moderate the multi-class problems that is constructed by assuming all the th
n classes. The M-SVM classification technique is an extension of SVM, which is mathematically represented in the Eq. (8), (9), and (10).
1 1
min , 1 2 .
i
k l
m
m m m y i
m i
w w w c
(8)Subjected to,
w xyi. i
byi
w xyi. i
bm 2 im (9)
0, 1, 2, 3... , m, yi 1, 2, 3... ,
m
i i l k m yi
(10)
Where, m
i
is specified as slack variables, is represented as training data point, is denoted as user’s positive constant, yi
is indicated as class of training data vectors , and k is identified as number of classes. At last, the decision function is represented in Eq. (11).
arg max
i.
i , 1, 2, 3..IV. EXPERIMENTALRESULTANDDISCUSSION In this research work, MATLAB (version 2018a) was used for experimental simulation with i5 processor and 3.2 GHz. In order to estimate the effectiveness of proposed system, the performance of proposed system was compared with a few existing systems such as, sparse logistic regression with L1/2 regularization [12], GEP multi classification using decomposition schemes [14], and GEP models [16] on GEO dataset. The proposed system performance was evaluated by means of TPR, accuracy, FPR and error rate.
A. Performance measure
Performance measure is determined as the measurement of experimental outcome that develops reliable information about the effectiveness of proposed system. The relationship between the input values and output values of the proposed system was understood by utilizing the performance measures such as TPR, accuracy, FPR and error rate. The formula to evaluate TPR, accuracy, FPR and error rate are given in the Eq. (12), (13), (14), and (15).
100
TP TPR
TP FN
(12)
100
TP TN Accuracy
TP TN FP FN
(13)
100
FP FPR
FP TN
(14)
100
Error rateaccuracy (15)
Where,FP is stated as false positive,TN is specified as true negative, TP is indicated as true positive, and FN is denoted as false negative.
B. Quantitative analysis
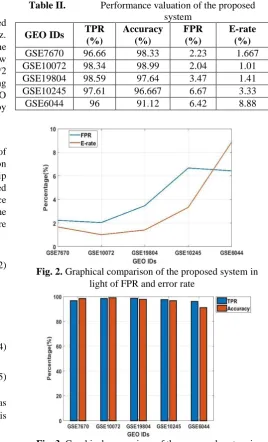
In this research work, GEO dataset is used for assessing the performance of proposed system in order classify the sub-stages of lung cancer genes such as, squamous cell carcinoma, small cell lung cancer, normal and adenocarcinoma. In this work, 70% data is used for training and 30% data is used for testing. Table 2 validates the performance of proposed system in light of TPR, accuracy, FPR and error rate. In GEO ID: GSE7670, the proposed system achieved 96.66% of TPR, 98.33% of accuracy, 2.33% of FPR and 1.667% of error rate. Correspondingly, the proposed system attains 98.34% of TPR, 98.99% of accuracy, 2.04% of FPR, and 1.01% of error rate in GEO ID: GSE10072. In addition, the TPR, accuracy, FPR and error rate of the proposed system is 98.59%, 97.64%, 3.47% and 1.41% for GEO ID: GSE19804. In GEO ID: GSE10245, the proposed system achieved 97.61% of TPR, 96.667% of accuracy, 6.67% of FPR and 3.33% of error rate. Similarly, the proposed system attains 96% of TPR, 91.12% of accuracy, 6.42% of FPR, and 8.88% of error rate in GEO ID: GSE6044. The graphical depiction of the proposed system is denoted in the Fig. 2 and 3.
Table II. Performance valuation of the proposed system
GEO IDs TPR
(%)
Accuracy (%)
FPR (%)
E-rate (%)
GSE7670 96.66 98.33 2.23 1.667
GSE10072 98.34 98.99 2.04 1.01
GSE19804 98.59 97.64 3.47 1.41
GSE10245 97.61 96.667 6.67 3.33
GSE6044 96 91.12 6.42 8.88
[image:5.595.284.553.51.494.2]Fig. 2. Graphical comparison of the proposed system in light of FPR and error rate
Fig. 3. Graphical comparison of the proposed system in light of TPR and accuracy
Table 3 and Fig. 4 represents the performance of the proposed system with enhanced reliefF and conventional reliefF algorithm for gene selection. In this scenario, the efficiency of gene selection is analyzed with GEO IDs:
GSE7670, GSE10072, GSE19804, GSE10245, and
Table III. Performance valuation of the proposed system using gene selection algorithms GEO IDs Gene selection Classifier Accuracy (%)
GSE7670
ReliefF
MSVM
91.667 Enhanced
ReliefF 98.34
GSE10072
ReliefF 97.43
Enhanced
ReliefF 98.99
GSE19804
ReliefF 96.23
Enhanced
ReliefF 8.59
GSE10245
ReliefF 90.78
Enhanced
ReliefF 96.667
GSE6044
ReliefF 84.474
Enhanced
ReliefF 91.12
In table 4, the performance of proposed system was
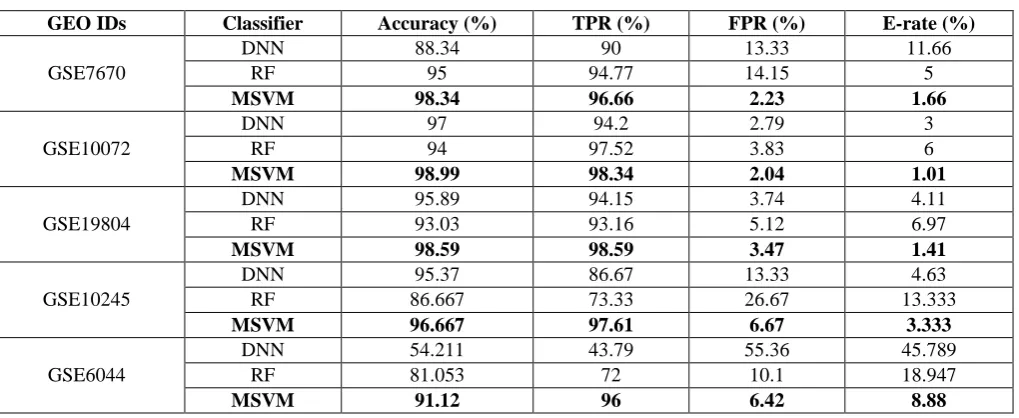
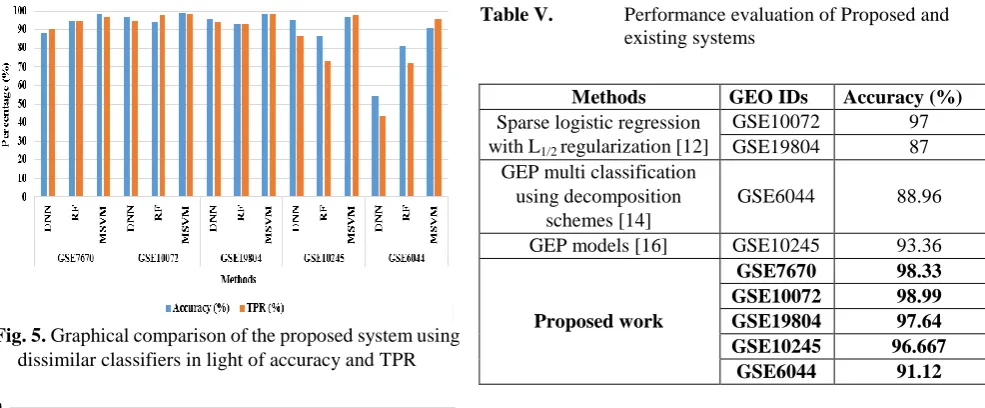
validated with dissimilar classifiers in light of TPR, accuracy, FPR and error rate. The average accuracy of MSVM classifier is 96.74% and the comparative classification methodologies: Deep Neural Network (DNN) and Random Forest (RF) delivers 86.16% and 89.95% of average accuracy. The average TPR value of MSVM classifier is 97.44% and the comparative classification methods attains 81.76% and 86.15% of average TPR value. Similarly, the average FPR value of MSVM classifier is 4.16% and the comparative classification methods delivers 17.71% and 11.97% of average FPR value. In addition, the average error rate of MSVM classifier is 3.25% and the existing classification methods: DNN and RF delivers 13.83% and 10.05% of average error rate. Tables 2, 3 and 4 clearly shows that the enhanced reliefF algorithm with MSVM classifier performs effectively compared to other existing gene selection and classification algorithms on GEO dataset. The graphical depiction of the proposed system is denoted in the
Fig. 5 and 6.
[image:6.595.187.410.295.434.2]Fig. 4. Graphical comparison of the proposed system using gene selection algorithms Table IV. Performance analysis of the proposed system using dissimilar classifiers
GEO IDs Classifier Accuracy (%) TPR (%) FPR (%) E-rate (%)
GSE7670
DNN 88.34 90 13.33 11.66
RF 95 94.77 14.15 5
MSVM 98.34 96.66 2.23 1.66
GSE10072
DNN 97 94.2 2.79 3
RF 94 97.52 3.83 6
MSVM 98.99 98.34 2.04 1.01
GSE19804
DNN 95.89 94.15 3.74 4.11
RF 93.03 93.16 5.12 6.97
MSVM 98.59 98.59 3.47 1.41
GSE10245
DNN 95.37 86.67 13.33 4.63
RF 86.667 73.33 26.67 13.333
MSVM 96.667 97.61 6.67 3.333
GSE6044
DNN 54.211 43.79 55.36 45.789
RF 81.053 72 10.1 18.947
[image:6.595.47.557.471.680.2]Fig. 5. Graphical comparison of the proposed system using dissimilar classifiers in light of accuracy and TPR
Fig. 6. Graphical comparison of the proposed system using dissimilar classifiers in light of FPR and error rate
Table 5 analysis the performance of proposed and existing systems. S. Wu, H. Jiang, H. Shen, and Z. Yang, [12] developed a new methodology (L1/2 regularized logistic regression) to select the optimal genes for classification. In this research, GEO dataset (GEO IDs: GSE10072 and GSE19804) is utilized to evaluate the performance of the developed system. From the experimental phase, the developed system almost attained 97% and 87% of classification accuracy in GSE10072 and GSE19804. Similarly, M. Sun, K. Liu, Q. Wu, Q. Hong, B. Wang and H. Zhang, [14] used GEP method for achieving better performance in the gene classification. In this paper, GEO ID: GSE6044 is used as a benchmark dataset. From this work, the developed system attained 88.96% of classification accuracy.
H. Azzawi, J. Hou, Y. Xiang, and R. Alanni, [16] developed GEP method to detect the lung cancer from microarray data (GEO ID: GSE10245). Here, the developed system achieved 93.36% of accuracy in gene classification. Compared to these existing papers, the proposed system achieved better performance in light of classification accuracy. In this research work, feature selection is a major part that effectively optimizes the genes, which is appropriate for better classification.
Table V. Performance evaluation of Proposed and existing systems
Methods GEO IDs Accuracy (%)
Sparse logistic regression with L1/2 regularization [12]
GSE10072 97
GSE19804 87
GEP multi classification using decomposition
schemes [14]
GSE6044 88.96
GEP models [16] GSE10245 93.36
Proposed work
GSE7670 98.33
GSE10072 98.99
GSE19804 97.64
GSE10245 96.667
GSE6044 91.12
V. CONCLUSION
In this research, a new feature selection algorithm is proposed (enhanced reliefF algorithm) to select the informative genes for lung cancer classification. The enhanced reliefF algorithm effectively eliminates the several irrelevant genes in the high dimensional gene data. Then, the selected optimal genes are classified by using a multiclass classifier: MSVM. The MSVM classifier reduces the size of resulting dual issue by developing a relaxed classification error bound. In addition, it quickly speed up’s training process by maintaining a competitive classification accuracy. Related to other existing systems, the proposed system delivered an effective performance by means of TPR, accuracy, FPR and error rate. From the experimental analysis, the proposed system improved the classification accuracy upto 3-10% compared to the existing papers. In the future, a new dimensionality reduction technique can be developed for further enhancing the performance of lung cancer classification.
REFERENCES
1. Y. Liang, C. Liu, X.Z. Luan, K.S. Leung, T.M. Chan, Z.B. Xu, and H.
Zhang. (2013). Sparse logistic regression with a L1/2 penalty for gene selection in cancer classification. BMC bioinformatics, 14(1), pp. 198. 2. S. Sayed, M. Nassef, A. Badr and I. Farag. (2019). A Nested Genetic
Algorithm for feature selection in high-dimensional cancer Microarray datasets. Expert Systems with Applications, 121, pp. 233-243.
3. P. He, B. Fan, X. Xu, J. Ding, Y. Liang, Y. Lou, Z. Zhang, and X. Chang.
(2019). Group K-SVD for the classification of gene expression data.
Computers & Electrical Engineering, 76, pp. 143-153.
4. H. Salem, G. Attiya, and N. El-Fishawy. (2017). Classification of human
cancer diseases by gene expression profiles. Applied Soft Computing,
50, pp. 124-134, 2017.
5. L. Gao, M. Ye, X. Lu, and D. Huang. (2017). Hybrid method based on
information gain and support vector machine for gene selection in cancer classification. Genomics, proteomics & bioinformatics, 15(6), pp. 389-395, 2017.
6. A. K. Shukla, P. Singh, and M. Vardhan. (2018). A two-stage gene selection method for biomarker discovery from microarray data for cancer classification. Chemometrics and Intelligent Laboratory Systems, 183, pp. 47-58.
7. Z. Y. Algamal, R. Alhamzawi, and H. T. M. Ali. (2018). Gene selection
[image:7.595.48.287.248.417.2]8. H. Motieghader, A. Najafi, B. Sadeghi, and A. Masoudi-Nejad. (2017). A hybrid gene selection algorithm for microarray cancer classification
using genetic algorithm and learning automata. Informatics in Medicine
Unlocked, 9, pp. 246-254.
9. Y. He, J. Zhou, Y. Lin, and T. Zhu. (2019). A class imbalance-aware Relief algorithm for the classification of tumors using microarray gene
expression data. Computational Biology and Chemistry.
10. C. Arunkumar, and S. Ramakrishnan. (2018). Attribute selection using
fuzzy roughset based customized similarity measure for lung cancer microarray gene expression data. Future Computing and Informatics Journal, 3(1), pp. 131-142.
11. R. Alanni, J. Hou, H. Azzawi and Y. Xiang. A novel gene selection algorithm for cancer classification using microarray datasets. BMC medical genomics, 12(1), pp. 10.
12. S. Wu, H. Jiang, H. Shen, and Z. Yang. (2018). Gene Selection in Cancer
Classification Using Sparse Logistic Regression with L1/2 Regularization. Applied Sciences, 8(9), pp. 1569, 2018.
13. H. Azzawi, J. Hou, R. Alanni, Y. Xiang, R. Abdu-Aljabar and A. Azzawi. (2017). Multiclass lung cancer diagnosis by gene expression programming and microarray datasets, In InternationalConference on Advanced Data Mining and Applications, pp. 541-553, 2017.
14. M. Sun, K. Liu, Q. Wu, Q. Hong, B. Wang and H. Zhang. (2017). A
novel ECOC algorithm for multiclass microarray data classification based on data complexity analysis. Pattern Recognition, 90, pp. 346-362.
15. R. Al-Anni, J. Hou, R. D. A Abdu-aljabar and Y. Xiang. (2017).
Prediction of NSCLC recurrence from microarray data with GEP”, IET
systems biology, 11(3), pp. 77-85.
16. H. Azzawi, J. Hou, Y. Xiang, and R. Alanni. (2016). Lung cancer
prediction from microarray data by gene expression programming. IET
systems biology, 10(5), pp. 168-178.
AUTHORSPROFILE
Prof Ashok K Patil, completed his Under Graduate Degree in Computer Science & Engg from Karnataka University Dharwad, Karnataka, Master Degree in Computer Science & Engg from Dr M.G.R University Chennai and Pursuing Ph.D in Computer & Information Technology from REVA University, Bangalore. He has 21 years of teaching experience, teaching various subjects for bother UG and PG Programs under various Colleges. He has few years work experience in Abroad.
He has guided more than 20 Projects for both UG and PG students. His interested area of research is Computer Networks and Bio-Informatics. He carried out his Ph. D. research in “Devising a data mining algorithm to construct efficient pattern for Biological Network of Lung Cancer”. He has published over 12 papers in National and International Journals and 2 papers in National and International journals.
He has organized & attended many Faculty Development Programs and Workshops in Computer Science & Engineering field. He has done 2 Additional Course in Mastering Microsoft ® Visual Basic 6.0 Developing at N.I.I.T. & Implementing a Database on Microsoft ® SQL Server 7.0 in N.I.I.T. He is a Life Member of Indian Society for Technical Education (LMISTE), India.
Qualification: B.E., M. Tech., (Ph. D).
Prof. S. S. Patil, Professor of Computer Science, Head and University Head, Dept of Agril Statistics, Applied Mathematics & Computer Science, University of Agricultural Sciences, Bangalore. He obtained his Doctoral degree in Computer Science. He is currently Professor and leading a research team in the Dept. of Computer Science.
Dr. M. Prabhakar, completed his Master Degree & Ph. D. in Computer Engineering from Anna University, Chennai. He has 21 years of teaching experience, teaching various subjects for bother UG and PG Programs under various Universities. He has few years work experience in Abroad. He is currently working as Professor in School of Computing & Information Technology, REVA University, Bangalore, India. He has guided more than 50 Projects for both UG and PG students. His interested area of research is Adhoc Networks. He carried out his Ph. D. research in Vehicular Adhoc Network and published various research articles in National and International Journals.
He is involved in research in the areas: Adhoc Networks, Wireless Sensor Networks, Cluster Computing, & Image Processing. He has published over 25 papers in National and International Journals and 8 papers in National and International journals.
He presented papers at various International Conferences in India and Abroad such as Thailand and Pataya. He is playing the role of reviewer for about six International & National reputed Journals. He has been reviewer, session chair and program committee member for many conferences. He has delivered periodically guest lectures on “IoT” at Border Security Force Officers Training Centre, Bangalore, India.
He has organized many Faculty Development Programs and Workshops in Computer Science & Engineering field. At present, he is guiding six research scholars in REVA University.
He is a life member of CSI and member of ACM – India.