International Journal of Innovative Technology and Exploring Engineering (IJITEE) ISSN: 2278-3075,Volume-8, Issue-12, October 2019
Abstract: Data need to be analyzed so as to produce good result. Using the result decision can be taken. For example recommendation system, ranking of the page, demand fore casting, prediction of purchase of the product. There are some leading companies where the review of the customer plays a great role to analyze the factor which influences the review rating. We have used exploratory data analysis (EDA) where data interpretations can be done in row and column format. We have used python for data analysis. it is object oriented ,interpreted and interactive programming language. it is open source with rich sets of libraries like pandas, MATplotlib, seaborn etc. We have used different types of charts and various types of parameter to analyze Amazon review data sets which contains the reviews of electronic data items. We have used python programming for the data analysis.
Keywords: Exploratory Data Analysis (EDA); MATPplotlib; Seaborn, Visualization; Pandas; Jupyter Notebook
I. INTRODUCTION
Data are growing very faster in today’s world. It is not so easy to process the data manually. Data analysis and visualization programs allow for reaching even deeper understanding. The programming language Python, with its English commands and easy-to-follow syntax, offers an amazingly powerful (and free!) open-source alternative to traditional techniques and applications.
Data analytics allow businesses to understand their efficiency and performance, and ultimately helps the business make more informed decisions. For example, an e-commerce company might be interested in analyzing customer attributes in order to display targeted ads for improving sales. Data analysis can be applied to almost any aspect of a business if one understands the tools available to process information. The ecommerce companies are analyzing the reviews of customer by using proper visualization method. Exploratory Data Analysis (EDA) is an approach to summarize the data by taking their main characteristics and visualize it with proper representations. EDA focuses more narrowly on checking assumptions required for model fitting and hypothesis testing, and handling missing values and making transformations of variables as needed. EDA encompasses IDA.
EDA quickly describes the data sets number of rows/columns, missing data, data types and preview. Clean corrupted data; handle missing data, invalid data types and
Revised Manuscript Received on October 05, 2019 * Corresponding Author
Kabita Sahoo*, Asst. Professor, Dept. of Computer Science, MITS school of Biotechnology, Utkal University, Bhubaneswar, India.
Abhaya Kumar Samal, Professor, Dept. of Comp. Sc. & Engg., Trident Academy of Technology, Bhubaneswar, India.
Jitendra Pramanik, Asst. Professor, Centurion University of Technology and Management, Odisha, India.
Subhendu Kumar Pani, Associate Professor, Orissa Engineering College, Bhubaneswar, India.
incorrect values.
EDA visualize data distributions; bar charts, histograms, box plots. Calculate and visualize correlations (relationships) between variables; heat map.
Rest of the paper is organized as follows: Section II presents a brief review of literature and Section III presents a discussion on various techniques for the exploratory data analysis. Section IV discusses how to conduct exploratory data analysis using python while Section V presents how to work with data sets to conduct exploratory data analysis. Finally, Section VI presents the concluding remarks.
II. LITERATURE SURVEY
Aindrila Ghosha et al. [1] have examined the different data exploration tool for exploratory analysis. They have described some of the data exploration tool.
Author John T. Behrens [2] has described about the difference between classical data analysis and exploratory data analysis using different visualization method.
Chokey Wangmo [3] has done an exploratory study on bank lending to SME sector in Bhutan.
Matthew Ntow-Gyamfi et al. [4] has done an exploratory study on Credit risk and loan default among Ghanaian banks
X.Francis Jency et al. [5] have done exploratory data analysis for loan prediction depending upon the nature of the client .they have used machine learning techniques for predictive data analysis.
K. Ulaga Priya1 et al. [6] has done exploratory analysis on prediction of loan privilege for customers using random forest. They have used R programming for exploratory data analysis.
Bogumil M. Konopka et al. [7] has done exploratory data analysis of a clinical study group. Development of a procedure for exploring multidimensional data.
III. TECHNIQUES FOR EDA
A. Exploratory Data Analysis (EDA)
Primarily, exploratory data analysis is an approach to see what the data can communicate us away from the formal modeling or hypothesis testing task. EDA helps to analyze the data sets to summarize their statistical characteristics focusing on four key aspects, like, measures of central tendency (comprising of the mean, the mode and the median), measures of spread (comprising of standard deviation and variance), the shape of the distribution and the existence of outliers. In the following paragraphs, we have presented a description of these key aspects of EDA. As shown in Figure 1, at every step of machine learning process, data analysis and visualization techniques are extensively being used. These techniques are discussed in as below:
I. Data Exploration
Exploratory Data Analysis using Python
It is the first stage of data analysis. Here we can know about the content of the data set and characteristic of data set. It tells about the size of the data. We can find the missing value of data. We can find the possible relationship among data. Data visualization is done by the use of tabular data and understanding the characteristics.
Figure-1: Steps of Machine Learning Process
II. Data Cleaning
It is process of detecting the corrupt data, removing the irrelevant parts of the data and replacing the correct data. The actual process of data cleaning is to remove the error and validating the data. Data can be cross checked to remove the error. Issue can be resolved by validating the data.
III. Model Building
We use the statistical model or machine learning model to describe the variable and working of the variable. Model can be supervised or unsupervised model. We can use classification, regression model to get the output. We can visualize the result by the use of model. After that we have to evaluate the model.
IV. Present Result
We can visualize large amount of complex data by the use of chart, graph and tables. Human brain can process information using chart, graphs. It is an easy way to convey the concept. It can identify the area which needs improvement. It can clarify the factor very well.
B. Graphical EDA
Fundamentally, graphical exploratory data analysis is nothing but the graphical counterpart of the traditional non-graphical EDA that analyzes the data sets to help summarize their statistical characteristics focusing on the same four key aspects, like, measures of central tendency, measures of spread, the shape of the distribution and the existence of outliers. Further, we have categorized GEDA into: Univariate GEDA, Bivariate GEDA and Multivariate GEDA. In the following paragraphs, we have discussed these key varieties and aspects of GEDA.
Univariate Graphical EDA
Univariate GEDA provides statistical summary for each field in the raw data set or the summary only on one variable. Example of these types of GEDA includes cumulative distribution function (CDF), probability density function (PDF), Box plot and Violin plot. Few of them are discussed below:
I. Histograms
We can represent the distribution of numerical data by the use of histogram. Histogram can relate to one variable rather than two variables. Here the entire range of value can be divided in to series of interval. Histograms are mainly used for continuous data. Histogram can be represented as frequency distribution by means of rectangle where a width represents the class interval and area proportional to corresponding frequencies. Height represents the average frequency density. Tonal distribution of digital image is a graphical representation which is called as image histogram.
II. Stem Plots
It is otherwise called as leaf plot. Here the data is spitted in to two parts. The largest digit represents the stems and the smallest digit represents the leaves. A little more information is represented by stem plot over histogram. It is also used for visualization purpose. Comparing the data is much easier here. The numbers are arranged by place value. They are basically used for highlighting the mode .they are used for small data sets
III. Box plots
A good graphical image of the concentration of data can be represented by the use of box plot. It shows the central tendency, symmetry, skew and outlier. It can be constructed from five values: the minimum, the first quartile, the median, the third quartile and the maximum value. These values are compared to show how close other data values are to them. Bivariate Graphical EDA
Bivariate GEDA is accomplished to understand the connections between each variable in the dataset and the target variable of interest or using two variables and finding connection among them. Example of these types of GEDA includes Box plot and Violin plot.
Multivariate Graphical EDA
Multivariate GEDA is accomplished to understand the connections between different fields in the dataset or finding the connections between more than two variables. Example of these types of GEDA includes Pair plot and 3D Scatter plot. BARGRAPH plot is the most commonly used graphical technique. Nowadays Box plot is used to show the relationship between two values. In some cases Pair plot is used to show the view of all variable and their relationship. I. Side-by-Side Box plots
For comparing the levels of all possible values we use side by side box plot.it is used to compare two data sets. it basically summarize the data for each instant of categorical variable. II. Scatter plots
It is a type of plot where Cartesian coordinate is used to display the values between two variables for a set of data. We can draw it by taking the variable value in X axis and Y axis. The data are displayed as a collection of points. The value of X axis and y axis gives the value of the variable.
International Journal of Innovative Technology and Exploring Engineering (IJITEE) ISSN: 2278-3075,Volume-8, Issue-12, October 2019
Feature variables are taken as row and column header and the variable versus itself on the diagonal. It is very useful to visualize the relationship between variables in high dimensional space.
IV. EDA IN PYTHON
We are using python for exploratory data analysis. It is simple to learn. It has rich sets of libraries. Data handling capacity are much higher. It is used as open source language. It has the capacity to with all the third party language .it can run on any platform. It can transfer the process from one platform to another. It is easy to read. The developer can understand the code .it offers a variety of libraries and some of them uses great visualization tool. Visualization process can make it easier to create the clear report.
Pandas
It is the most powerful package for data analysis. We can clean, transform and analyze the data. Data can be stored in CSV format in computer. Cleaning, visualizing and storing the data can be done. It is built on the top of the NumPy package. Plotting functions from Matplotlib and machine learning algorithm in Scikit-learn.
Jupiter Notebook
It gives ability to execute the code in a particular cell. It gives the console based approach for computing. It provides web based application process. It includes input and output of the computation. It gives rich media representation of the object. Applications of EDA
1. Mistakes and anomalies can be detected using EDA 2. We can gain new insight in to various types of data 3. Outliers in data can be detected
4. We can test assumption using EDA.
5. Important factors can be Identified using it.
6. We can understand the relationship among various data. 7. Data can speak for itself using visualization process.
V. WORKING WITH THE DATA SETS It’s time to explore the data and find about it. The data we are using belongs to Amazon review data set. We are going to analyse the data with possible set of options.
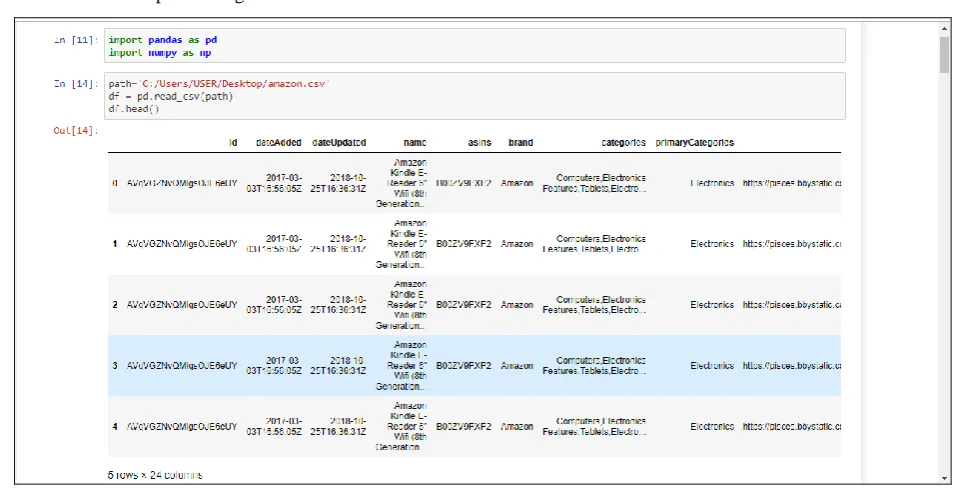
1. In the first step we have imported the Pandas libraries. numpy packages.
2. After that we have imported fairly large amazon CSV file as a data frame df. It gives the data sets in the form of rows and column. In our CSV file 5 rows and 20 columns are there. We have used head( ) method to return top 5 rows of the data frame or series. This is shown in Figure 2 below. 3. We have to choose the right visualization method. When visualizing individual variables, it is important to first understand what type of variable we are dealing with. This will help us find the right visualization method for that variable .for this we have imported Matplot lib, seaborn library packages. We have used df.dtypes to list the data for each column. This is shown in Figure 3 below. As shown in the figure, reviews.doRecommend is Boolean data type. Reviews.id is float64 data type. Reviews.numhelpful, reviews.rating is int64 data type and all other are object data types.
[image:3.595.56.536.473.717.2]4. We have used df.corr( ) to find the pair wise correlations of all column in data frame. It gives the following correlations between reviews.id, reviews.doRecommened, reviews.numHelpful and reviews.rating. This pair wise correlations is shown in Figure 4 below.
Figure 2: Importing pandas library and head functions showing top 5 rows of the data frame
5. We have done the scatter plot between reviews.id and reviews.rating to get the following output. This scatter plot between reviews.id and reviews.rating is shown in
Figure 5 below.
reviews.rating and form the scatter plot between them. This correlation between reviews.id and reviews.rating is shown by the scatter plot presented in Figure 6 below. 7. Box Plot: We have used categorical variable which takes a
fixed number of possible values .it describes the characteristics of a data unit. It is represented by box plot. We have done the box plot between:
1. Manufacturers no and reviews ratings. 2. Manufacturer and reviews ratings
This shown by the box plot between manufacturer Number and reviews.rating presented in the Figure-7.
8. Count Plot: We have used count plot to count the no of observations. It can be taught as a histogram across a categorical variable. It is identical to those for bar plot. We have made the count plot between manufacturer and reviews.id and got the following output. This shown by the box plot between manufacturer Number and reviews.rating in the data frame presented in the Figure-8.
Figure-3: Showing data types for each column of the data frame
Figure-4: Showing pair wise correlations of the data frame
9. Descriptive Statistical Analysis: We have used descriptive statistical analysis which is used to describe the entire data sets with a single value or metric. The describe function automatically computes basic statistics for all continuous variables. Here NaN values are automatically skipped in these statistics. Here the mean value is calculated by taking the sum of all the values in the data set divided by total number of data sets. here we have found out the count of that variable the mean the standard deviation (std) the minimum value the IQR (Interquartile Range: 25%, 50% and 75%) the maximum value .we have found all these factor for reviews.id, reviews. numHelpful and reviews rating .we have used describe function and got the following output.
This is shown by the count plot between Amazon manufacturer and reviews.id as presented in the Figure-9.
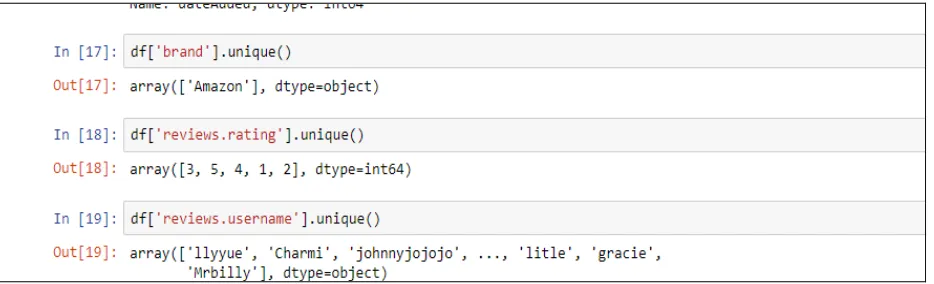
10. Counts: We have used count function that returns the number of occurrences. It tells about how many units of each characteristic/ variable we have. We got number of brand value and the different categories electronic products.
This is shown by the output for describe function presented in the Figure-10. We have applied method "describe" on the variables of type 'object' and got the result.
11. Basic of Grouping: We have used "group by" method that groups data by different categories. The data is grouped based on one or several variables and analysis is performed on the individual groups. This is shown by the describe method on the variable type object as presented in the Figure-11 below.
International Journal of Innovative Technology and Exploring Engineering (IJITEE) ISSN: 2278-3075,Volume-8, Issue-12, October 2019
method to know all types of unique values in the column is returned. This is presented in the Figure-12 showing
implementation of value count function.
Figure-5: Shows reg plot and scatter plot between reviews.id and reviews.rating
Figure-7: Showing box plot between manufacturer Number and reviews.rating
International Journal of Innovative Technology and Exploring Engineering (IJITEE) ISSN: 2278-3075,Volume-8, Issue-12, October 2019
Figure-9: Showing count plot between Amazon manufacturer and reviews.id
Figure-10: Showing the output for describe function
Figure-11: Shows the describe method on the variable type object
Figure 13: Shows implementations of unique function
VI. CONCLUSION
In this article we have explained the detail about explorative data analysis. We have used the language python programming language for implementation. We have used jupyter note book for detail analysis. We have implemented different library packages of python. We got the required result taking different parameter. In future we will use more data sets and other functions to get the clear idea related to exploratory dat analysis.
REFERENCES
1. Aindrila Ghosh, Mona Nashaat, James Miller, Shaikh Quader, and Chad Marston, “A Comprehensive Review of Tools for Exploratory Analysis of Tabular Industrial Datasets,” Visual Informatics, Volume 2, Issue 4, December 2018, pp. 235-253.
2. John T. Behrens, “Principles and Procedures of Exploratory Data Analysis,” Psychological Methods, 1997, Vol. 2, No. 2, pp.131-160. 3. Chokey Wangmo, “An Exploratory Study On Bank Lending To SME
Sector In Bhutan,” International Journal of Scientific & Technology Research, volume 6, issue 11, November 2017, pp. 47-51.
4. Matthew Ntow-Gyamfi and Sarah Serwaa Boateng, “Credit Risk and Loan Default among Ghanaian Banks: An Exploratory Study,” Management Science Letters, Vol. 3, 2013, pp.753–762.
5. X. Francis Jency, V. P. Sumathi, Janani Shiva Sri, “An Exploratory Data Analysis for Loan Prediction Based on Nature of the Clients,” International Journal of Recent Technology and Engineering (IJRTE), Volume-7 Issue-4S, November 2018, pp.176-179.
6. K. Ulaga Priya, S. Pushp, K. Kalaivani, A. Sartiha, “Exploratory Analysis on Prediction of Loan Privilege for Customers using Random Forest,” International Journal of Engineering & Technology, Vol. 7, Issue 2.21, 2018, pp. 339-341.
7. Bogumil M. Konopka, Felicja Lwow, Magdalena Owczarz, Łukasz Łaczmański, “Exploratory Data Analysis of a Clinical Study Group: Development of a Procedure for Exploring Multidimensional Data,” PLOS ONE, [Online] https://www.ncbi.nlm.nih.gov/pmc/articles/ PMC6107146/pdf/pone.0201950.pdf, August23, 2018, pp. 1-21. 8. Introduction To Machine Learning using Python [Online], Available:
https://www.geeksforgeeks.org/introduction-machine-learning-using-p ython/
9. Exploratory data analysis – From Wikipedia, the free encyclopedia [Online], Available: https://en.wikipedia.org/wiki/Exploratory_data_ analysis
AUTHORS PROFILE
Ms Kabita Sahoo completed her B.Tech. degree in Information Technology from Jagannath Institute of Technology and Management (JITM), Paralakhemundi in the year 2005 and M.Tech. degree in Computer Science & Engineering (CSE) from BPUT, Odisha in the year 2010. She qualified UGC NET Exam in November, 2017 and at present, she is pursuing PhD degree under BPUT, Odisha. She worked as an Asst. Prof. in CSE at DRIEMS during Sep 2006 to June 2012 and as Asst. Prof. in CSE at Centurion University of Technology and Management (CUTM), Bhubaneswar during June 2012 to August 2017. From August 16, 2016, she has been working as an Asst. Professor in Computer Science at MITS School of Biotechnology, Bhubaneswar. She has been teaching Advanced Computer Architecture, Computer Organization, Microprocessor, Operating Systems, Computer Graphics, Unified Modeling Language, VB, PHP and MIS to undergraduate classes. She has guided many academic projects at B. Tech. and M. Tech. level. She has published many research articles in articles in National and International Journals and Conference Proceedings; participated in many skill and technical workshops and presented papers in National level seminar.
Dr. Abhaya Kumar Samal did his M.Sc. in Electronics from Sambalpur University, MCA and M.E.(CSE) from NIT, Rourkela, MBA with specialization in Marketing and Systems from Utkal University and PhD in Computer Science Engineering from Sambalpur University. His service experience includes around 17+ years of working in industry (SAIL, RSP and OSEDC, Govt. of Odisha) and around 18+ years of experience in the field of Academics and Research during working with many Technical Institutions. Currently Dr. Samal is working with Trident Academy of Technology, Bhubaneswar as Dean(Project & Consultancy) and Professor in Computer Science & Engineering. Dr. Samal’s primary domains of research and academic interest includes: RT Systems, Fault-Tolerant Computing, Embedded Systems, Soft Computing, AI, ML, DL, IoT, WSN, Computer Networking, Software Engineering and System Software and interest on Trans-disciplinary of Research that includes Design of IoT based Solutions for Safety and Ambient Monitoring for both Underground and Opencast Mines. Dr. Samal has published 25+ papers in reputed National and International journals and conferences proceedings, published three Book Chapters and one Book in the engineering domain; supervising six PhD scholars under BPUT and registered four Patents. Attended many short-term professional courses from reputed Institutions and has chaired many sessions in international conference, delivered many invited talks in upcoming and key areas of technology, delivered few Keynote Addresses in National and International Conferences on IoT and guided many M.Tech. dissertations. Dr. Samal is a Fellow of Institute of Engineers (India) – (IEI), Fellow of Institution of Electronics and Telecommunication Engineers (IETS), Life Member of Indian Society for Technical Education (ISTE), Life Member of Computer Society of India (CSI), Life Member of Odisha IT Society (OITS) and Member of IEEE.
Mr. Jitendra Pramanik has completed his B.Tech. degree in Electronics and Communication Engineering from BPUT, Odisha in the year 2012 and M.Tech. degree in Communication
International Journal of Innovative Technology and Exploring Engineering (IJITEE) ISSN: 2278-3075,Volume-8, Issue-12, October 2019
of Technology and Management (CUTM), Odisha, India in the year 2015. Mr. Pramanik has worked as a lecturer in the Department of ECE at OCEM, Bhubaneswar during Aug 2013 to May 2014 and now he is continuing as an Asst. Professor at CUTM since 2017. He has published many papers in reputed National and International Journals and conference proceedings and published one Book in the engineering domain to his credit. His area of teaching interest includes Microprocessor & Microcontroller, Digital Electronics, Programming in C, C++, Java and Python, Programming in Matlab, System Programming, WSN and IoT. Mr. Pramanik’s area of research and academic interest includes: Embedded Systems, Soft Computing, Artificial Intelligence, Internet of Things, Wireless Sensor Network, Machine Learning, Deep Learning and interest on Trans-disciplinary Areas of Research covering design of IoT based Solutions for Safety and Ambient Monitoring for both Underground and Opencast Mines, and other areas of mining and environment safety.