Abstract: The power system congestion is treated as a vital issue in the restructured topology of the power system. The analysis of appropriate technique to control congestion is of preeminent interest. This paper proposes a congestion controlling scheme with the optimal placement and sizing of the Distributed Generation (DG) so as to ensure an optimal power flow in the power system network. A multi-objective framework is formulated for the proposed approach considering the operating cost, Voltage Stability Index (VSI) and the system losses. A hybrid optimization technique is proposed involving Improved Genetic Algorithm (IGA) and Bat Algorithm (BA) to optimize the objectives proposed in this research. The efficiency of the proposed methodology is verified using IEEE 33 and 69 bus systems. A comparative analysis is established between the outcomes obtained with hybrid IGA-BA and Particle Swarm Optimization (PSO) technique. The output obtained clarifies that by combining IGA and BA, greater efficiency is achieved compared to the PSO algorithm output.
Keywords : Cost minimization, Congestion management, Distribution generation, Optimization.
I. INTRODUCTION
The advent of restructuring in the electric power industries has given rise to an intense competition among the market players. The Distribution System Operator (DSO) experiences an arduous task to plan the generations situated on the distribution system as the resulting flows may lead to the abrupt congestion [1]. This scenario can also evolve due to the substantial introduction of new loads for the sector electrification like the electric vehicle in the urban areas. The congestion problem can be conceived as the problem of voltage uncertainty and over loading problem resulting in the violation of the thermal limit of the power components. The congestion controlling scheme may be envisaged as resolving the issues related to the overloading and monitoring the under voltage or over voltage issues [2]. The market based method and direct control method are the two strategies adopted by the DSO for controlling the congestion in the distribution framework. The day ahead dynamic tariff along with the distribution capacity market and intra-day shadow price are some of the market based methods.
Revised Manuscript Received on October 10, 2019
* Correspondence Author
Kaushik Paul*, Electrical Engineering, National Institute of Technology Jamshedpur, Jamshedpur, India. Email: [email protected]
Niranjan Kumar, Electrical Engineering, National Institute of Technology Jamshedpur, Jharkhand, India. Email: [email protected]
Poulami Dalapati, Computer Science and Engineering, BIT Sindri, Dhanbad, India. Email: [email protected]
The direct control method includes network reconfiguration and installation of the DGs to mitigate the over voltage and overloading issues [3]. The DGs have evolved as one of the major component of power system and several noteworthy attempts have been made to define its utilization. The DG is considered to be a small-scale source, which is placed and connected immediately at the location of the end user in the power system framework [4]. The role of the DGs in the power system framework has gained a significant importance and has attracted the researchers to explore the areas related to power generations [5]. Some of the vital issues for the proliferating interest towards this field are the abrupt rise in the electrical demands, the constraints binding the economic and technical aspects for the establishment of the new power generation plants and transmission lines and the advantages associated with the DGs. The main reason for the broad use of the DGs can be classified as: i) It is easy to find the occupancy site for the DGs to be installed. ii) The transmission cost is significantly reduced due to the placement of the DGs at the consumer end. iii) The DGs use natural gas as a fuel whose availability is never ending and is almost distributed everywhere. iv) The DGs endeavor an extensive blend based on its cost and reliability [6]. The research based on the optimal sitting and sizing of the DGs according to the framework of power system has emerged as an integral aspect in recent days. The formulation of the DG application can be accomplished in the form of mixed integer programming and can be readily solved with the implementation of optimization algorithms. Many techniques have been used to solve the placement of DG problem, which includes Genetic Algorithm (GA), PSO, Ant Colony Optimization (ACO) and so on. Among these, the GA and PSO yield relevant results [7]. Rahiminejad et al. minimized the losses in the smart distribution network with the optimal management of the DGs [8]. In another research conducted by Zhan et al., the optimal location of the DG was determined based on the short circuit current [9]. Paschalis et al. sorted the best position and size of the DG considering the variation of the load [10]. A combination of DG and DSTATCOM was introduced by Iqbal et al. to optimally reduce the losses in the power system network [11]. Saha et al. concentrated their research towards finding the most suitable size and location of the DGs with the implementation of the Chaotic Symbiotic Organisms Search (CSOS) algorithm considering loss minimization in radial distribution system [12].
Congestion Control by Optimal Engagement of
Distribution Generation using Hybrid
Evolutionary Algorithm
The DGs are also integrated in the power system framework to enhance the performance of the network by controlling the power flow, checking the losses and maintaining the voltage profile within its standard levels. Singh et al. implemented DG to obtain a congestion free power system network by maintaining the voltage profile close to its normal values [13]. In another research, the PSO approach was adopted by Muthulaxmi and Babula to locate the optimal position and best size of the DG considering the real power shift of the DG to relive the power system network from the state of congestion [14]. Singh et al. used Z bus matrix to determine the optimal location of the DG for Congestion Management (CM) [15]. Wang et al. proposed a CM scheme by optimally rescheduling the real power of the DG using Cat Swarm Optimization and Clonal Selection Algorithm [16].
In this paper, the optimal estimation of location and size of the DG is achieved using heuristic optimization algorithms. The rescheduling of DG is developed for managing the congestion in the power distribution framework by optimizing the operating cost, losses, and VSI. The cost minimization, loss reduction, and VSI are the multiple objectives carried out in this research. In order to obtain the optimal DG size, its placement, operating cost, VSI and system losses, the PSO and hybrid IGA-BA are deployed. In high dimensional space, the PSO algorithm falls into local optimum. The hybrid algorithm IGA-BA is deployed to overcome this limitation. While combining the IGA parameters with the BA, the process becomes much more advanced and the predicted results accurately satisfy the optimum conditions.
II. PROBLEMFORMULATION
The method depicted in this research is motivated towards finding the optimal solution for the placement and sizing of the DG and maintaining the power flow within its limit. The maintenance of voltage profile within desired level and curtailment of the power loss are also taken into account. The cost minimization while implementing the DG is also considered as an important objective formulated in this research.
A. Objective function
The cost function [17] minimization is given as:
2
dg dg dg
C P P
(1) Subjected to: Equality constraints: 1 G N
dg D loss i
P
P
P
(2)
1
G
N
dg D loss i
Q
Q
Q
(3) Inequality constraints:min max
dg dg dg
P
P
P
(4) min maxdg dg dg
Q Q Q (5) Pdg is termed as the real power adjustment done by the DG.
Qdg is designated as the reactive power of the DG. Pd is
designated as real power demand and Qd is designated as the
reactive power demand. α, β and γ correspond to the generator coefficients for the DG.
The real and reactive power loss formulation is given as:
2
1
* k
loss n n
n
P I R
(6)2
1
* X k
loss n n
n
Q I
(7)The value of In is determine from the load flow studies. Rn
and Xn are taken as nth branch resistance and reactance
respectively.
The configuration of radial system is such that one sending node supply all of the receiving nodes. The alteration in VSI is observed when a DG is placed in the distribution network, and the VSI can be formulated as given in [18].
m n n n n V V I R jX
(8)
*
( ) ( )
n n n n
P n jQ n V I (9)
4 2
2
( )
4[
( )
( )
]
4[
( )
( )
]
m n n n n m
n n n n
VSI n
V
P n R
Q n X
V
P n R
Q n X
(10)Vm specifies the sending end voltage, whereas Vn specifies
the receiving end voltage. Pn, Qn corresponds to the real
power and reactive power designated at the receiving node respectively and Rn and Xn corresponds to the resistance and
reactance of the receiving node respectively.
Once the DG is implemented, the voltage level rises because of the reverse power flow. As a result, the standard limits of voltage profile should be constrained at each of the buses and is expressed as:
min max
i i i
V V V (11)
max min
1.05 . . and 0.95 . .
i i
V p u V p u
The upper limit and the lower limit of the active power and reactive power of the DG are given as:
min max
dg dg dg
P
P
P
(12) Where,min 0MW and max 5MW
dg dg
P P
min max
dg dg dg
Q Q Q (13) Where,
min max
Qdg 0Mvar and Qdg 1Mvar
III. PARTICLESWARMOPTIMIZATION The PSO is one of the well-known evolutionary algorithms and the concept behind it depends on the flock of birds significantly finding food in a specific area. The best effective solution to an optimization problem is found out from the solution space with the aid of a population based finding procedure where the particles such as birds change their positions similar to seeking of food [19]. In „N‟ dimensional
X
i
(
x x
i1,
i2,...,
x
iN)
(14)V
i
(
v v
i1,
i2,...,
v
iN)
(15) Where,Xi is the position and Vi is the velocity
In the wide search space, each particle traverses to find out the possible optimal solution regions and amend the flying velocity and direction with respect to the flying experience. The positions of all particles are examined at the end of each iteration process, which is related to the objective function value.
The local best or the position best is the effective identical position, which is accomplished by the individual particle, and the ith particle is given as:
P
i
(
p
i1,
p
i2,...,
p
iN)
(16) The collective best among all the position best is designated as the global best and is represented as:GBmin(P ) i (17)
The particles utilize both of these information to update the velocity and position which is given as follows:
1 1 1
2 2
( )
( )
j j j j
i i i i
j j
i
V wV C r P X
C r GB X
(18)
1 1
j j j
i i i
X X V (19) Where,
w is designated as the inertia weight, r1 and r2 are
considered as the random values taken between 0 and 1. C1
and C2 are stated as the two positive constants known as
acceleration constants, j represents the iteration number. IV. HYBRIDALGORITHM
The PSO algorithm is an effective evolutionary algorithm that can be implemented in fetching the optimal solution towards the problem designated by the user. In regions of high dimensional space, they fall into local optima easily and hence they have low convergence rate in the iterative process [20]. Hence, in order to attain optimal requirement the hybrid combination of IGA-BA is deployed which is predicted to yield better and accurate solution to the problem. The IGA- BA concept is given below:
A. Improved Genetic Algorithm
The GA method is implemented when there is a modest time and space available for the occurrence of evaluation. The classical approach of the GA suffers from the disadvantage of readily getting trapped into local minima. For multi-objective optimization problem, the IGA is preferred [21]. The major drawback of GA is the weak ability of the local search. To overcome this issue, IGA is introduced with adaptive local search operator which detects the optimal solution. The IGA is the combination of initial selection, crossover, and mutation to find out the best fitness to a problem. IGA searches for the optimal solution until the given objectives are met. “Chromosome” in IGA defines the solution to a particular problem [22]. The process includes the collection of genes that determines the essential parameters to be optimized.
The process of improvement involves the randomly generation of initial population according to certain conditions, rough selection, abandon the lowest part of the
fitness of individuals. This leads to the enhancement in the fitness of the initial population and directs the algorithm to achieve the global solution with appreciative convergence speed.
The dynamic adaptive technique is adapted during the evolution process, so as to adjust the values of the parameters dynamically. This results in the individuals with high adaptability to embrace smaller crossover and mutation probability and the individuals with stumpy fitness embrace higher crossover and mutation probability. The adaptive crossover rate is denoted Pc and mutation rate is denoted as Pm
and the adjustment equation is represented as:
max min 1
max 1 max max 1 ( )( ) , ,
c c avg
c avg
avg c
c avg
P P f f
P f f
f f P
P f f
(20) where max c
P and
min
c
P is considered as the maximum and minimum crossover probability; f1 is the larger fitness of the two individuals to be crossed; fmax is the maximum fitness of the group;
f
avg is the average fitness of the group.m max m min max 1
m max 1
max max 1 ( )( ) , , avg avg m c avg
P P f f
P f f
f f
P
P f f
(21)
where
m max
P and Pm min is the maximum and minimum mutation probability;
1
f is the fitness of the individual to be mutated.
B. Bat Algorithm
The elemental framework of BA is designated as:
The echolocation is used by the bats to feel the distance and they also bear a marvelous ability to measure the distinctness between the prey and the background barrier [23].
Each of the bat in the group bears a velocity designated as vi and a position designated as xi. A certain value of
wavelength λ along with frequency fmin and loudness A0 are
also assigned to the bats. They also have the ability to modulate the rate of pulse emission ri ranging from [0-1]
based on the closeness of the prey.
The variation of the loudness is done from a positive A0 to a
minimum Amin.
The velocity and the position of the bats are designated as vi and xi in dimension d. At time step „t‟ the generation of new
values for the position xit and velocity vit are obtained as
follows:
min ( max min)
i
f f f f
(22)v
it1
v
it(
x
it
x f
*)
t (23)x
it1
x
itv
ti (24) Where,The velocity increment is defined as the product of λi*fi.
Depending on the type of the problem the velocity can be adjusted by changing the value of fi (or λi) keeping the other
factor constant. So the frequency that is initially assigned to the bats is chosen uniformly from [fmin, fmax].
The random walk is utilized to generate the new solution locally, which is given by:
x
new
x
old
A
t (25) Here ε is denoted as the random number fetched from [-1,1], the average loudness is designated as At = Ait. Thechoice for the loudness value depends as per user accessibility.
1 0
, [1 exp( )]
t t t
i i i i
A
A r r
t (26) here α and γ are constants. For any value existing from 0<α< 1 and γ > 0, we have0
0, ,
t t
i i i
A r r t (27) The parameters for the BA used are: Pulse Rate=0.5, A0=2,
Amin=1, Fmin= 0, Fmax=1, α=0.9, γ=0.9. Fig.1 represents the
pseudo code for BA.
Fig.1. Pseudo code for Bat algorithm. C. Hybrid Algorithm (IGA-BA)
The implementation procedure adopted for optimal sitting and sizing of DG with the aid of IGA-BA necessitates the specific steps to be followed. The parameters opted for the hybrid algorithm is initialization process, crossover, mutation, and BA parameters such as wavelength and loudness. The stepwise procedure for IGA-BA is given below.
i.Initialization: the user specified population number should be incorporated in the hybrid algorithm. The algorithm generates the initial population by having the default sets of values. The initial population size will be examined by means of the objective function, which acts as a motive force behind the hybrid algorithm. The initialization includes population size = 20, mutation probability = 0.01 and cross over probability = 0.5.
ii. Generation of hybrid algorithm: The organization of the hybrid algorithm is based upon the implementation of the load flow in association with the formulated objective function.
iii. Replacement: If the current fitness value is found to be better than the previous one, then it will be submitted by the new fitness value.
iv. Termination: The new population values are evaluated for the next iteration process by the hybrid parameters. The new generated values and the references values are compared and the best values are evaluated. The flow chart for the hybrid algorithm is represented in Figure 2.
Fig.2. Hybrid flow chart for optimal DG sitting and sizing V. RESULTS
The pre-eminent interest underlying the proposed research philosophy is to select the optimal size of DG such that the power transmission to the load will be optimum. The proposed research technique is tested on IEEE 33 and 69 bus systems of MATLAB 2016b platform and the performances are examined as per the research objectives. The detailed discussion for the outputs obtained with PSO and hybrid algorithm IGA - BA are given below.
A. Output of 33 bus Deploying PSO
The IEEE 33 bus system is taken into account to check the potency of the proposed
as follows. The minimum cost value obtained with PSO is 1333.98 $/h. The convergence profile for the minimized cost function with implementation of PSO algorithm is portrayed in Fig. 3. The voltage profile achieved with PSO is represented in Fig. 4. The VSI achieved is 0.8464. The VSI with and without using DG is shown in Fig. 5. The amount of the real and reactive power losses obtained are 0.0985 MW and 0.0750 MVAr respectively.
Fig.3. Cost minimization for 33 bus system deploying PSO.
Fig.4. Voltage profile for 33 bus system by deploying PSO.
Fig.5. Voltage stability index for 33 bus system by deploying PSO.
B. Output of 33 bus Deploying IGA-BA
The proposed research work is implemented on the framework of IEEE 33 bus test case system. The minimum
cost achieved with the implementation of IGA-BA is 927.96 $/h and is minimum when compared to the outcomes obtained with PSO. The convergence profile of the minimized cost function with hybrid of IGA-BA is portrayed in Fig. 6. The voltage profile is represented in Fig. 7. The VSI achieved with the proposed approach is 0.8919 and is better when compared to the VSI obtained with PSO. The VSI with and without using DG are represented in Fig. 8. The real and reactive power losses found with the proposed approach are 0.0726 MW and 0.0570 MVAr respectively, which are also better when compared to PSO.
Fig.6. Cost minimization for 33 bus system deploying IGA-BA.
Fig.7. Voltage profile for 33 bus system by deploying IGA-BA.
C. Output of 69 bus Deploying PSO
The proposed research work is ratified on IEEE 69 bus framework. The outcomes acquired are discussed as follows. The minimum cost value achieved with PSO is 1069.23 $/h. The convergence characteristic for the minimized cost function using the PSO algorithm is given in Fig. 9. The voltage profile achieved with IGA-BA is shown in Fig.10. The VSI obtained with PSO is 0.8798. The VSI using DG is shown in Fig. 11. The real and the reactive power losses are found to be 0.0832 MW and 0.0405 MVAr respectively.
Fig.9. Cost minimization for 69 bus system deploying PSO.
Fig.10. Voltage profile for 69 bus system by deploying PSO.
Fig.11. Voltage stability index for 69 bus system by deploying PSO.
D. Output of 69 bus Deploying IGA-BA
The proposed research work is tested in IEEE 69 bus system. The optimal cost obtained with IGA-BA is 673.97 $/h and is
optimally lower when compared to the cost achieved with PSO. The convergence profile of the cost minimization with IGA-BA is shown in Fig. 12. The voltage profile is represented in Fig. 13. The VSI achieved with the proposed approach is 0.9072 and is better when compared to the VSI obtained with PSO. The VSI with and without using DG is shown in Fig. 14. The real and reactive power losses yielded are 0.0524 MW and 0.0272 MVAr respectively and are also minimum than the losses yielded with PSO.
Fig.12. Cost minimization for 69 bus system deploying IGA-BA.
Fig.13. Voltage profile for 69 bus system by deploying IGA-BA.
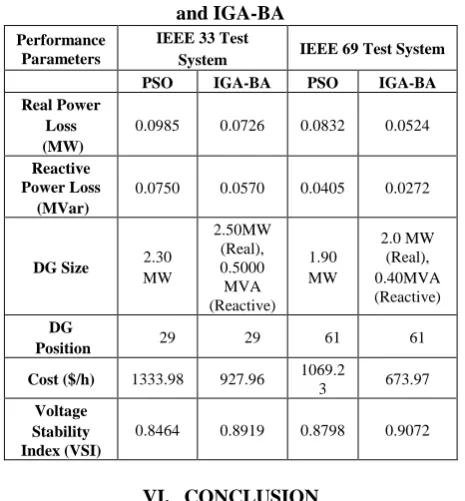
The details of the results obtained with PSO and hybrid algorithm IGA-BA for the proposed approach are tabulated in Table I.
Table- I: Comparison of the results obtained with PSO and IGA-BA
Performance Parameters
IEEE 33 Test
System IEEE 69 Test System
PSO IGA-BA PSO IGA-BA
Real Power Loss (MW)
0.0985 0.0726 0.0832 0.0524
Reactive Power Loss
(MVar)
0.0750 0.0570 0.0405 0.0272
DG Size 2.30
MW 2.50MW (Real), 0.5000 MVA (Reactive) 1.90 MW 2.0 MW (Real), 0.40MVA (Reactive) DG
Position 29 29 61 61
Cost ($/h) 1333.98 927.96 1069.2
3 673.97
Voltage Stability Index (VSI)
0.8464 0.8919 0.8798 0.9072
VI. CONCLUSION
This research is focused on providing an optimal solution to the CM in power system by the selection of optimal DG size and its position. The optimal DG selection is accomplished by adopting optimization techniques such as PSO and combined IGA-BA algorithm. The analysis of the load flow is carried out by using Newton Raphson method and the results obtained using PSO and hybrid of IGA-BA is tested on IEEE 33 and 69 bus system. The outputs obtained from each of the test system are compared and it is found that the hybrid of IGA-BA algorithm provides better outputs while compared to PSO algorithm. The real and reactive DG placement and sizing is found to be better while incorporating hybrid IGA-BA.
REFERENCES
1. S. Hanif, H. B. Gooi, T. Massier, T. Hamacher, T. Reindl, "Distributed congestion management of distribution grids under robust flexible buildings operations," IEEE Transactions on Power Systems, vol. 32,
no. 6, pp. 4600-4613, Nov. 2017. DOI:
10.1109/TPWRS.2017.2660065.
2. NI Lina, W. Fushuan, L. Weijia , M. Jinling, L. Guoying, D. Sanlei, “Congestion management with demand response considering uncertainities of distributed generation output and market prices”,
Journal of Modern Power System and Clean Energy. vol. 5, pp. 66-78, January 2017. DOI: 10.1007/s40565-016-0257-9.
3. S. Huang, Q. Wu, Z. Liu and A. H. Nielsen, "Review of congestion management methods for distribution networks with high penetration of distributed energy resources," IEEE PES Innovative Smart Grid Technologies, Europe, Istanbul, 2014, pp. 1-6. DOI: 10.1109/ISGTEurope.2014.7028811.
4. U. Sultana, Azhar B. Khairuddin, M.M. Aman, A.S. Mokhtar, N. Zareen, “A review of optimum DG placement based on minimization of power losses and voltage stability enhancement of distribution system”, Renewable and Sustainable Energy Reviews, vol. 63, pp. 363-378, Sept. 2016. DOI: 10.1016/j.rser.2016.05.056.
5. D. A. Quijano, J. Wang, M. R. Sarker, A. Padilha-Feltrin, "Stochastic assessment of distributed generation hosting capacity and energy efficiency in active distribution networks," IET Generation, Transmission & Distribution, vol. 11, pp. 4617-4625, December 2017. DOI: 10.1049/iet-gtd.2017.0557.
6. P.P. Biswas, R. Mallipeddi, P.N.Suganthan, G.A.J. Amaratunga, “A multi-objective approach for optimal placement and sizing of distributed generators and capacitors in distribution network”, Applied Soft Computing Journal, vol. 60, pp. 268-280, November 2017. DOI: 10.1016/j.asoc.2017.07.004.
7. S. Jain, S. Kalambe, G. Agnihotri, A. Mishra, “Distributed generation deployment: State-of-the-art of distribution system planning in sustainable era”, Renewable and Sustainable Energy Reviews, vol. 77, pp. 363-385, September 2017. DOI: 10.1016/j.rser.2017.04.024. 8. A. Rahiminejad, B. Vahidi, M.A. Hejazi, S. Shahrooyan, “Optimal
scheduling of dispatchable distributed generation in smart environment with the aim of energy loss minimization”, Energy, vol.
116, pp. 190-201, December 2016. DOI:
10.1016/j.energy.2016.09.111.
9. H. Zhan et al., "Relay Protection Coordination Integrated Optimal Placement and Sizing of Distributed Generation Sources in Distribution Networks," IEEE Transactions on Smart Grid, vol. 7, pp. 55-65, January. 2016, DOI:10.1109/TSG.2015.2420667.
10. Paschalis A. Gkaidatzis, Aggelos S. Bouhouras, Dimitrios I. Doukas, Kallisthenis I. Sgouras, Dimitris P. Labridis, “Load variations impact on optimal DG placement problem concerning energy loss reduction”,
Electric Power Systems Research, vol. 152, pp. 36-47, November 2017. DOI:10.1016/j.epsr.2017.06.016.
11. Fahad Iqbal, Mohd Tauseef Khan, A. Shahzad Siddiqui, “Optimal placement of DG and DSTATCOM for loss reduction and voltage profile improvement”, Alexandria Engineering Journal, pp-1-11. March 2017. DOI: 10.1016/j.aej.2017.03.002.
12. S. Saha, V. Mukherjee, "Optimal placement and sizing of DGs in RDS using chaos embedded SOS algorithm," IET Generation, Transmission & Distribution, vol. 10, pp. 3671-3680, October 2016. DOI: 10.1049/iet-gtd.2016.0151.
13. A.K. Singh, S.K. Parida, “Congestion management with distributed generation and its impact on electricity market”, International Journal of Electrical Power & Energy Systems, vol. 48, pp. 39-47, June 2013, DOI: 10.1016/j.ijepes.2012.11.025.
14. K. Muthulakshm, C. K. Babulal, “A Novel Method of Relieving Transmission Congestion by Optimal Rescheduling with Multiple DGs Using PSO”. Int. Conf. 2014 on Swarm, Evolutionary & Memetic Computing. pp. 396-408. DOI: https:10.1007/978-3-319-20294-5_35. 15. K. Singh, V. K. Yadav, N. P. Padhy, J. Sharma, “Congestion Management Considering Optimal Placement of Distributed Generator in Deregulated Power System Networks”, Electric Power Components and Systems, vol. 42, pp-13-22, December 2013 DOI: 10.1080/15325008.2013.843218.
16. Xu. Wang, J. Chuanwen, “Congestion Management in Modern Power System Containing Active Distribution Network Nodes”, Electric Power Components and Systems, vol. 44, pp 1453-1465. June 2016. DOI: 10.1080/15325008.2016.1173127.
17. Wei-Tzer. Huang, Kai-Chao. Yao, Chun-Ching Wu, “Using the Direct Search Method for Optimal Dispatch of Distributed Generation in a Medium-Voltage Microgrid”, Energies, vol 7, pp 8355-8373. December 2014. DOI:10.3390/en7128355.
18. M. Chakravorty, D. Das, "Voltage stability analysis of radial distribution networks," International Journal of Electrical Power and Energy Systems, vol. 23, pp. 129-135, February 2001. DOI: 10.1016/S0142-0615(00)00040-5.
19. A. Elhossini, S. Areibi and R. Dony, "Strength Pareto Particle Swarm Optimization and Hybrid EA-PSO for Multi-Objective Optimization,"
Evolutionary Computation, vol. 18, no. 1, pp. 127-156, March 2010. DOI: 10.1162/evco.2010.18.1.18105
20. M. Neshat, G. Sepidnam, M. Sargolzaei, A.N Toosi, “Artificial fish swarm algorithm: a survey of the state-of-the-art, hybridization, combinatorial and indicative applications”, Artificial Intelligence Review, vol. 42. pp. 1-33, December 2014. DOI: 10.1007/s10462-012-9342-2.
21. G. Candan & H. R. Yazgan, “Genetic algorithm parameter optimisation using Taguchi method for a flexible manufacturing system scheduling problem”, International Journal of Production Research, vol. 53, pp. 897-915. July 2015. DOI: 10.1080/00207543.2014.939244.
23. K. Kaced, C. Larbes, N. Ramzan, M. Bounabi, Z. Elabadine Dahmane, “Bat algorithm based maximum power point tracking for photovoltaic system under partial shading conditions”, Solar Energy, Vol. 158, pp. 490-503, December 2017. DOI: 10.1016/j.solener.2017.09.063.
AUTHORSPROFILE
Kaushik Paul has received his B.Tech degree in Electrical Engineering from Netaji Subhash Engineering College in the year 2010. He also received his M.Tech degree in 2012 from NIT Kurukshetra in Electrical Engineering with specialization in power system. His M.Tech research focused on the demand response strategies adopted in case of air-conditioning load. He also served as an Assistant Professor in the department of Electrical and Electronics Engineering in Sharda Group of Institutions from 2012 to 2014. He got is Ph.D degree from NIT Jamshedpur in Electrical Engineering in the year 2019 and presently working as Assistant professor in the department of Electrical Engineering at BIT Sindri. His research interest includes power system analysis, congestion management, optimization techniques.
Niranjan Kumar is a professor in the department of Electrical Engineering at National Institute of Technology Jamshedpur. He received his B.Sc engineering in the year 1988 and his M.Tech degree in the field of Electrical engineering from National Institute of Technology Jamshedpur in the year 1996. He completed his Ph.D degree from IIT Roorkee. His research areas include power system deregulation, transmission pricing and electricity market and congestion management.