Int. J. Electrochem. Sci., 7 (2012) 7866 - 7876
International Journal of
ELECTROCHEMICAL
SCIENCE
www.electrochemsci.orgElectrochemical Evaluation of a Ir-Ru Binary Oxide for Oxygen
Evolution Reaction
J. C. Cruz1, A. Ramos Hernández2, M. Guerra -Balcazar2, A.U. Chávez-Ramirez1, J. Ledesma-García2,*
, L.G. Arriaga1
1 Centro de Investigación y Desarrollo Tecnológico en Electroquímica S.C., C.P. 76703, Querétaro,
México.
2 Facultad de Ingeniería, División de Investigación y Posgrado, Universidad Autónoma de Querétaro,
Centro Universitario Cerro de las Campanas, Querétaro, Qro., C.P. 76010, México.
*
E-mail: [email protected]
Received: 4 July 2012 / Accepted: 17 July 2012 / Published: 1 September 2012
Binary oxides of IrOx:RuOy were synthesized and characterized as electrocatalysts for the oxygen
evolution reaction. The catalysts were prepared by using a colloidal method in aqueous solution and a subsequent thermal treatment. The physical characterization was carried out by X-ray diffraction (XRD) and the lattice parameters, unit cell volumes (V) and the crystal lattice distortion ratio were calculated. Half cell electrochemical evaluation of binary oxides was carried out in an inert diamond electrode (BDD, A=1cm2) substrate, in order to achieve reproducibility and a stability measurements in a potential range of 0 to 2 V vs. NHE. Half Cell chronoamperometric studies by 24 h show a IrOx:RuOy 20:80 with the highest stability, and a current density of 146 mA cm-2 at 1.44 V vs. NHE.
Finally the binary oxide was evaluated in a single electrolysis cell at different operation temperatures obtaining 1.28 A cm-2 at 1.8 V (80 °C).
Keywords: Oxygen evolution reaction, diamond electrode, binary oxides.
1. INTRODUCTION
SPE electrolyzers use a membrane (Nafion® in this case) for the ion exchange into its two components: Hydrogen and Oxygen. Hydrogen evolution reaction takes place in the cathodic side while the Oxygen evolution reaction is performed in the anodic side, which is one of the main subjects of study in this work.
Safety, high energy density and low maintenance requirement are some advantages of water electrolyzers. However, despite the feasibility of using such systems, the slow kinetics of the OER in the anode is an issue [11] which requires efficient electrocatalysts. For this reason, many research groups have developed new materials such as transition metal oxides as Pd, Ir, Ru, Rh, Au, Re, Os, Ta and Mo among others [12-18]. Additionally it was observed that the use of these metals as electrolcatalysts decreases the overpotential applied to carry out the OER, also generating a higher current density.
In a previous study RuO2 and IrO2 oxides were synthesized [19-21], obtaining important
insights on both materials. The IrO2 has good stability when is used in the OER, but- a higher
overpotential is needed, unlike the RuO2 that requires a lower overpotential for carrying out the
reaction, however the current density developed drops dramatically over time, which, as mentioned, does not occur with IrO2. This result is directly related to the stability of the material [20].
A principal and complex difficulty for half cell electrochemical studies of catalytic materials for OER is the substrate (normally glassy carbon) utilized, due to high potentials needed as up to 1.6V vs NHE. This could cause an accelerating corrosion process of the substrate and the participation of functional groups on the carbon surface. In this work, it was selected the B-doped diamond (BDD) as substrate. The BDD presents a very high overpotential for both oxygen and hydrogen evolution in acid conditions. This electrode/substrate leads to a wide potential window (approximately 3.5 V vs NHE) that can be used for other electrochemical reactions in the presence of aqueous electrolytes. The oxygen evolution reaction potential on BDD is 2.4 V in 0.2 M H2SO4 [22, 23]. Nevertheless, the width
of the potential window decreases with the quality of the BDD film and the incorporation of non-diamond sp2 carbon impurities, and its response resembles that obtained from glassy carbon and highly oriented pyrolytic graphite [24, 25]
This paper presents the preliminary results obtained from the synthesis and electrochemical half cell characterization of binary metal oxides based on Ir and Ru (catalytic activity and chemical stability), at three different compositions IrOx:RuOy (20:80, 50:50, 80:20); these materials were
supported in an inert diamond electrode, in order to reach high stability support material. Finally the best electrocatalytic material of IrOx:RuOy was tested in an SPE type electrolyzer at different
operation conditions
2. EXPERIMENTAL
2.1 Synthesis of binary oxides
Synthesis of electrocatalysts was performed by colloidal method based on two salts, H2IrCl6
in different volume ratios: IrOx:RuOy 20:80, 50:50 and 80:20. A solution of each salt was prepared in deionized water at a concentration of 0.01M. These two components were mixed into a new solution of 25 mL in a predetermined ratio. Then, the solution was heated to boiling point, almost 100 °C for 10 minutes under constant agitation. The next step was to add quickly 1 mL of 1M NaOH (JT Baker) aqueous solution by using a syringe. This solution was kept at constant temperature with stirring, in order to promote the formation of hydroxides. The following step was to calcined the binary oxides material at 400 °C in a control temperature furnace in air atmosphere. Then the resulting powders was washed in alternating baths of acetone (JT Baker) and deionized water by centrifugation for periods of 10 minutes. A last wash with 1 L of deionized water at 80 °C was performed to finally dry the material in an oven for 4 h at 80 °C.
2.2 Electrochemical purification treatment for the electrode B doped diamond (BDD)
An electrode of BDD (Adamart Technologies S.A.) was used as substrate which underwent a process of electrochemical purification. The process involves applying in galvanostatic mode 4 mA cm-2 during 30 minutes in order to remove the functional groups of C-sp2 on the material surface which may interfere Oxygen evolution reaction [26].
2.3 Half-cell electrochemical characterization
The electrochemical characterization of materials was carried out by cyclic and linear voltammetry techniques and in a conventional three-electrode cell in 10 mL of 0.5 M H2SO4 solution
(JT Baker) under N2 atmosphere (Infra). For testing, 5 mg of the dust under the study were dissolved in
100 μL of deionized water and the mixture in ultrasonic for 20 minutes. Then, 6 μL were deposited on the active electrode area and led to a low temperature oven (80°C) to remove water, leaving an oxide layer. The next step was to place 2 μL of Nafion as proton exchange membrane on the electrode, and it was taken back to the oven to evaporate solvents.
The working electrode consisted of a BDD electrode (A= 1cm2) coated with the oxide under study, Pt wire as counter electrode and a reference electrode Hg/Hg2SO4. The H2SO4 solution was
bubbled for 20 minutes using Nitrogen to remove dissolved Oxygen. Cyclic, linear voltammetry and chronoamperommetric were performed in order to characterize the electrochemical behavior of the material, its activity against the oxygen evolution reaction and stability respectively.
2.4 Electrochemical characterization in a single cell SPE electrolyzer
For the OER at the anode, binary oxide IrOx:RuOy 20:80 was chosen due to its higher
performance in half cell tests in comparison to binary oxides IrOx:RuOy 50:50 and 80:20. This material
The material was on 5cm2 area. A load of 0.6 mg cm-2 Pt/Vulcan commercial (XC-72 ETEK, PEMEAS, Boston, USA) at 30% was used for hydrogen evolution at the cathode.
The SPE electrolyzer performance was evaluated by linear voltammetry, chronoamperometric and impedance spectroscopy techniques at atmospheric pressure and electrochemical impedance spectroscopy (EIS) in a frequency range of 10 kHz to 1 Hz. The electrochemical characterization was performed with a PGSTAT Autolab 302 Potentiostat/Galvanostat equipped with a booster of 20 A (Metrohm®) and a Frequency Response Analyser (FRA). The fuel cell test station, which operated on liquid fuel (ElectroChem Inc. with a direct methanol unit couple) was used to control operating parameters, such as cell temperature, inlet temperature of liquids and flow rate.
The electrolyser performance was evaluated in a range to 30- 80°C. Deionised water was circulated at 2 mL min- 1 in the anode electrode. Linear voltammetry profiles were performed for a range of potentials from 0.8V to 1.8 V at a 50 mV s -1 scan rate.
2.5 Physicochemical characterization
The electrocatalysts physical characterization was carried out by X-ray diffraction (XRD) in order to determine the crystallographic structure and crystalline size. XRD was performed on the dry electrocatalytic powders using a Philips X-Pert diffractometer using the Kα line of the copper (CuKα) as radiation source. The diffractometer was operated at 40 kV and 20 mA, time step of 0.5 θ min-1
, and angular resolution of 0.005° θ. The diffraction patterns were fitted to JCPDS (Joint Committee on Powder Diffraction Standards).
3. RESULTS AND DISCUSSION
Series of three binary oxides were synthesized with the following volume ratios: IrOx:RuOy ,
20:80, 50:50 and 80:20, they were subjected to different electrochemical tests (cyclic and linear voltammetry, chronoamperometric) to assess their performance. The best performance was electrochemically characterized by linear voltammetry and electrochemical impedance spectroscopy.
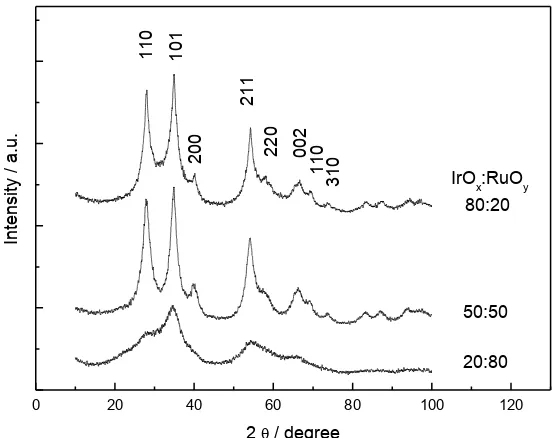
According to the literature, the Iridium and ruthenium dioxide crystallize in the same tetragonal (rutile-like) structure. The lattice parameters of IrO2 and RuO2 are quite similar (IrO2, a = 4.4983 Å
and c = 3.1544 Å (JCPDS Card No. 15-0870); RuO2, a = 4.4994 Å and c = 3.1071 Å (JCPDS Card No.
40-1290). On the other hand, the ionic radius of Ir4+ (0.0625 nm) is similar to Ru4+ (0.062 nm). According to Hume-Rothery theory, it is possible to form a continuous solid solution of IrO2 and
RuO2, where Ru4+ and Ir4+ share the same site on the cationic sub-lattice of a tetragonal (rutile-like)
phase [27], moreover is possible to replace one element (Ir or Ru) for another according to the proportionality of the mixture in the crystallize structure.
Figure 1 shows XRD patterns of samples IrOx: RuOy (20:80, 50:50 and 80:20). The sample
since crystalline phase of this material begins at 400 ° C [19] in tetragonal structure. The average crystal size (D) can be estimated by Debye-Scherrer equation (1),
) cos
(
k
D (1)
where λ is the X-ray radiation wavelength ( 0.154187 nm for CuβKα), θ is the Bragg angle, κ= 0.89 and β is the FWHM, i. e., the line width at half maximum height of the main intensity peak after subtraction of the equipment broadening.
0 20 40 60 80 100 120
310
110
002
220
211
200
101
20:80 50:50
In
te
n
si
ty
/ a
.u
.
2 / degree
80:20 IrOx:RuOy
[image:5.596.159.437.250.469.2]110
Figure 1. Diffraction patterns of samples IrOx: RuOx, 20:80, 50:50, 80:20.
Table 1. Lattice parameters (a ,b and c) and unit cell volume (V) of IrOx:RuOy (50:50 and 80:20).
Material lattice parameters V (Å3) D(101)nm (Ɛ2)1/2 Reference
a b c
RuO2 4.4994 =a 3.1071 62.90 [*1]
IrO2 4.4983 =a 3.1544 63.83 [*2]
RuO2 4.9886 =a 3.4135 84.94 9.10 0.00679 [19]
IrO2 4.9693 =a 3.4901 86.18 4.83 0.01299 [20]
IrOx:RuOy (20:80) 5.0450 =a 3.4876 88.76 …… ….. this work
IrOx:RuOy (50:50) 5.0183 =a 3.4650 87.26 4.64 0.01350 this work
IrOx:RuOy (80:20) 4.9935 =a 3.4603 86.28 6.50 0.00959 this work
[image:5.596.30.568.558.745.2]
Therefore, it is not possible to determine crystal size for the sample IrOx: RuOy 20:80.
However, for the samples 50:50 and 80:20, can be observed a more defined crystalline arrangement, with a preferential crystallographic orientation in the plane (1 0 1) for the composite material. An average crystal size being such, 4.64 nm and 6.5 nm to 50:50 and 80:20, respectively. In table 1, it is shown the values of lattice parameters and unit cell volumes (V) of the Ir: Ru-Ox (50:50 and 80:20) and compared with IrO2 and RuO2 standard and synthesized by our group [19, 20]
The crystal lattice distortion ratio of the materials can be calculated by the fallowing equation [28]:
2 2
2 2 2 2 2 sin 32 4
cos
D (2)
where β is FWHM, λ is the X-ray radiation wavelength, D is the average crystallite size and (Ɛ2
)1/2 is the crystal lattice distortion ratio. According to equations (1) and (2), can be deduced as:
32 4 sin
1
1 2 2
2 1
2
D (3)
c a
V 2 (4)
The (Ɛ2
)1/2 depends only on D when using the same angle θ. Equation 4 show the unit cell volume defined as a and c that was used to calculated V values for the different samples.
0.0 0.5 1.0 1.5 2.0 2.5 3.0 3.5 -0.005 0.000 0.005 0.010 0.015 0.020 0.025 0.030 0.035 0.040 j / Acm -2
E/ V vs. NHE
-0.2 0.0 0.2 0.4 0.6 0.8 1.0 1.2 1.4 1.6 1.8 2.0 -0.0004 0.0000 0.0004 0.0008 0.0012 0.0016 0.0020 j / A cm -2
E / V vs. NHE
A)
[image:6.596.140.432.472.680.2]B)
In table 1, is possible to note a directly relation between the RuOy material quantity to an
increase of (Ɛ2)1/2, that could be caused by the material amorphous structure of RuOy that clearly show
in XRD results figure 1.
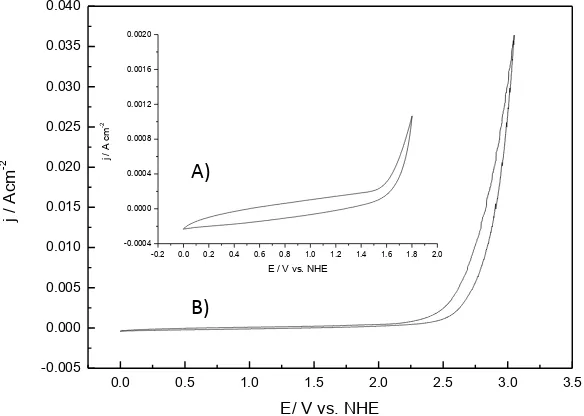
The cyclic voltammetry response of the substrate BDD (figure 2) is show before (figure 2 A) and after electrochemical cleaning (figure 2 B). It is observed an increase (from 1.6 V vs. NHE to 2.4 V vs. NHE) in the potential window, due the C-sp2 disappearing on the BDD surface. This window displacement ensures no intervention of the substrate during the water electrolytic process.
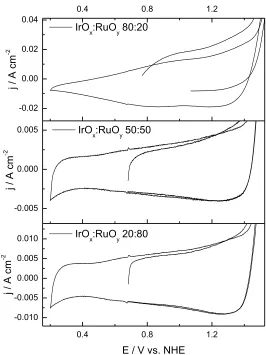
Figure 3 shows the cyclic voltammetry of different samples, peaks near 0.58 and 0.72V vs. NHE were noticed and they are attributed to the redox transitions of the Ru (III) / Ru (IV) and Ru (IV) / Ru (VI) surface oxyruthenium groups, respectively, which can be observed in the sample IrOx:
RuOy 20:80 which contains the largest proportion of Ru and conversely it is possible to observe peaks
at 0.3 and 1.04V vs. NHE are attributed to the redox transitions of the Ir (III) / Ir (IV ) and Ir (IV) / Ir (VI) oxyiridium surface groups, respectively, which are notorious in the sample IrOx: RuOy 80:20,
which contains a higher proportion of Ir.
0.4 0.8 1.2
-0.010 -0.005 0.000 0.005 0.010 -0.005 0.000 0.005 -0.02 0.00 0.02 0.04
0.4 0.8 1.2
j /
A
cm
-2
E / V vs. NHE IrOx:RuOy 20:80
j /
A
cm
-2
IrOx:RuOy 50:50
j /
A
cm
-2
[image:7.596.152.418.333.688.2]IrOx:RuOy 80:20
Figure 3. Cyclic voltammetry of samples IrOx: RuOy, 20:80, 50:50, 80:20 in 0.5 M H2SO4 at 27 ° C
0.00 0.02 0.04 0.06 0.08 0.10 0.12 0.14 0.16 1.2
1.3 1.4 1.5 1.6
E
/ V
vs.
N
H
E
j /Acm-2
80:20 50:50 20:80
IrOx:RuOy
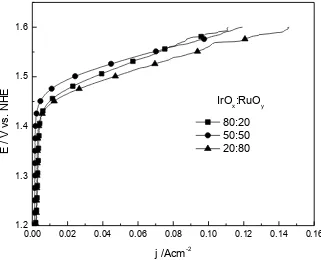
Figure 4. Half-cell polarization curves of samples IrOx: RuOy, 20:80, 50:50, 80:20 to 27 ° C in 0.5 M
[image:8.596.133.454.77.337.2]H2SO4 at 27°C in O2 sat.
Table 2. Maximum current density and potential of oxygen evolution obtained with oxides of Ir and Ru individual and mixtures.
Material J / mA cm-2 (at 1.6 V)
E / V vs. ENH
IrOx:RuOy 80:20 107 1.44
IrOx:RuOy 50:50 120 1.48
IrOx:RuOy 20:80 146 1.44
The catalytic activity of synthesized oxides related to Oxygen evolution was studied by polarization curves obtained by linear voltammetry at a scan rate of 5 mV s-1 in 0.5M H2SO4 under O2
atmosphere (figure 4). IrOx:RuOy 20:80 (33:67 atomic ratio) has a better electrocatalytic activity
compared to the evolution of oxygen, which means it has a higher current density for Oxygen evolution in acid medium, about 146 mA cm-2 to 1.6 V vs NHE. The trend shows that the catalytic activity of the material increases as the amount of Ru in the mixture is higher. Oxygen evolution potential of the mixtures 20:80 and 80:20 are very similar (1.44 V vs. NHE), while the binary oxide IrOx:RuOy 50:50 shifts slightly 40 mV towards anodic direction. The results are summarized in Table
0 2 4 6 8 10 12 14 16 18 20 22 24 26
0.00 0.02 0.04 0.06 0.08 0.10 0.12
j /
A
cm
-2
t / hr
[image:9.596.136.437.75.297.2]80:20 50:50 20:80 IrOx:RuOy
Figure 5. Half-cell chronoamperometrics of samples IrOx: RuOy, 20:80, 50:50, 80:20 in 0.5 M H2SO4
and 1.55V vs. NHE to 27 ° C.
0.1 0.2 0.3 0.4 0.5 0.6 0.7 0.8
0.0 0.1 0.2 0.3 0.4
30°C 40°C 60°C 80°C
Z i
/
cm
2
Zr / cm2
1.55 V
0.18 0.20 0.22 0.24 0.26 0.28 0.300.00 0.02 0.04 0.06
-Zi
/
cm
2
Zr / cm 2
80°C
A) B)
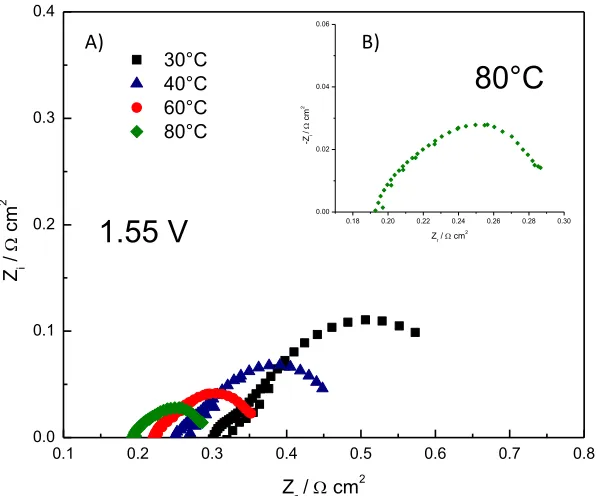
Figure 6. Impedance spectra of IrOx: RuOy 20:80 in a single cell electrolyzer: A) at different
temperatures and B) Zoom at 80 ° C with a potential 1.55 V.
[image:9.596.144.443.388.636.2]
result clearly shows that the activity of the material is enhanced by a synergistic effect between Ir and Ru. This effect is attributed, according to literature, to the effect of corrosion in the material [19].
Impedance tests were performed after OER was carried out for the mix IrOx:RuOy 20:80
(figure 6), also analyzing the behavior of the material at 1.55 V. According to the results obtained, the series resistance and the total charge transfer resistance of this material decreases as temperature increases, the reaction rate increased with temperature, showing a series resistance of 0.192 Ω cm2 and a charge transfer resistance of 0.102 Ω cm2
at 80 °C.
0.0 0.2 0.4 0.6 0.8 1.0 1.2 1.4
0.6 0.8 1.0 1.2 1.4 1.6 1.8 2.0
30°C 40°C 60°C 80°C
E
/ V
[image:10.596.147.433.217.451.2]j / A cm-2
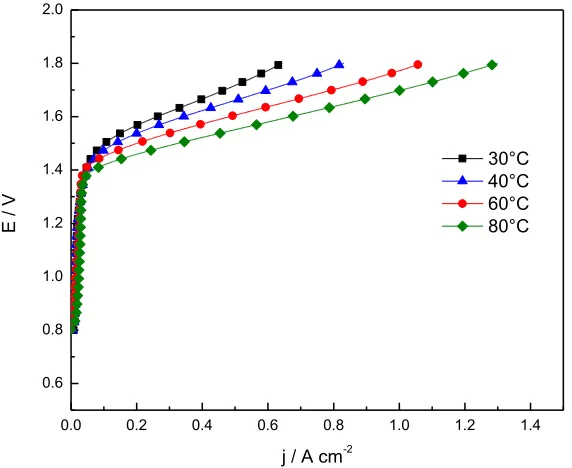
Figure 7. Polarization curves of IrOx: RuOy 20:80 electrolyzer at different temperatures in single cell
electrolyzer.
The electrochemical behavior in electrolysis single cell is shown in figure 7 for IrOx:RuOy
20:80. The maximum current density was 1.28 A cm-2 with a terminal cell voltage of 1.8 V at 80°C and atmospheric pressure.
4. CONCLUSIONS
IrOx:RuOy 20:80, 50:50 and 80:20 were prepared with a simple and fast method, obtaining an
average crystal size as 4.64 nm and 6.5 nm for 50:50 and 80:20, respectively. Lattice parameters, unit cell volumes (V) and the crystal lattice distortion ratio were calculated and compared with the literature. The electrochemical characterization shows a better performance for IrOx:RuOx 20:80. This
ACKNOWLEDGMENTS
The authors externalize their gratitude to CONACYT for the financial support Projects SEP-CONACYT 133310 and 154263. J. L-G and A.R-H thank the Fund UAQ FIN-2009-22.
References
1. F. Barbir, Sol. Energy, 78 (2005) 661.
2. M. Hongchao, L. Changpeng , L. Jianhui, S. Yi , X. Xingzhong, X. Wei, J Mol Catal A: Chem, 247 (2006) 7.
3. E. Rasten, G. Hagen, R. Tunold, Electrochim. Acta, 48 (2003) 3945.
4. C. Jayeeta, K. Hong Rok , M. Sang Bong , P. Daewon , Int. J. Hydrogen Energ, 33 ( 2008) 3270. 5. Z.G. Ye, H.M. Meng, D.B. Sun, J Electroanal Chem, 621 (2008) 49.
6. J. Gaudet, A.C. Tavares, S. Trasatti, D. Guay, Chem Mater, 17 ( 2005) 1570. 7. R. Hutchings, K. Müller, R. Kotz, S. Stucki, J Mater Sci, 19 (1984) 3987.
8. M. Ito, Y. Murakami, K. Hayato, O. Hiroyuki, Y. Kiyochika, T. Yoshio, J Electrochem Soc.,141 (1994) 1242.
9. A. Di Blasi, C. D´Urso, V. Baglio, V. Atonucci, A. S. Aricó, R. Ornelas, F. Matteucci, G. Orozco, D. Beltran, Y. Meas, L. G. Arriaga, J. Appl. Electrochem., 39 (2009) 191.
10.Y. Tanaka, S. Uchinashi, Y. Saihara, K. Kikuchi, T. Okaya, Z. Ogumi, Electrochim. Acta, 48 (2003) 4013.
11.V. Antonucci, A. Di Blasi, V. Baglio, R. Ornelas, F. Matteucci, J. Ledesma-Garcia, L.G. Arriaga, A.S. Aricò, Electrochim. Acta, 53 (2008) 7350.
12.A. Marshall, B. Børresen, G. Hagen, S. Sunde, M. Tsypkin, R. Tunold, Russ J Electrochem., 42 (2006) 1134.
13.F. Andolfatto, R. Durand, A.Michas, P. Millet, P. Stevens, Int. J. Hydrogen Energ., 19 (1994) 421. 14.K. Ledjeff, F. Mahlendorf, V. Peinecke, A. Heinzel, Electrochim. Acta, 40 (1995) 315.
15.A.Marshall, B. Børresen, G. Hagen, M. Tsypkin, R. Tunold , Mater Chem Phys., 94 (2005) 226. 16.L.M. Da Silva, J.F.C. Boodts, L.A. De Faria, Electrochim. Acta, 46 (2001) 1369.
17.H. Tamura, C. Iwakura, Int. J. Hydrogen Energ., 7 (1982) 857.
18.S. Trasatti, G. Lodi, In: Trasatti, S. (Ed.), Electrodes of Conductive Metallic Oxides, Part B.Part B. Elsevier, Amsterdam, Holand (1980)521.
19.J. C. Cruz, V. Baglio, S. Siracusano, V. Antonucci , A. S. Aricò , R. Ornelas, L. Ortiz-Frade, G. Osorio-Monreal, S. M. Durón-Torres , L.G. Arriaga , Int. J. Electrochem. Sci., 6 (2011) 6607. 20.J. C. Cruz, V. Baglio, S. Siracusano, R. Ornelas, L. Ortiz-Frade, L. G. Arriaga, V. Antonucci, A.
S. Arico, J Nanopart Res., 13 (2011) 1639.
21.I. Chiaki, H. Kazuhro, T. Hideo, Electrochimica Acta, 22 (1997) 329. 22.A. Kraft, Int. J. Electrochem. Sci.,2(2007)355.
23.G. Zhao, S. Shen, M. Li, M. Wu, T. Cao, D. Li, Chemosphere, 73 (2008) 1407. 24.M. Panizza, G. Cerisola, Electrochimica Acta, 51 (2005)191.
25.E.A. Ekimov, V. A. Sidorov, A. V. Rakhmanina, N.N. Mel´nik, M.A. Timofeev, R.A. Sadykov, Inorg. Mater., 11 (2006) 1198.
26.Y. Meas, L. A. Godinez, E. Bustos, Synthetic Diamond Films: Preparation, electrochemestry, characterization and application, Chapter 13 (2012) 311.
27.E. Balko, C. Davidson, J. Inorg. Nucl. Chem., 42 (1980) 1778.
28.Y. Fen, X. Zhang, W. Xu, T. Fang, Trans. of Nonferrous Metal Society of China, 17 (2007) 626.