al ~ ~
--
-
>
..
w
w
EUROPEAN COMMISSION
WORKING
NOTES
Working notes on the
Common Agricultural Policy
_j '\. ~v \ ' I
... \ '
,J ·?' I
-THE OUTLOOK OF
WORLD CEREAL
MARKETS
Special issue
EUROPEAN COMMISSION Directorate-General for Agriculture
Information, reports, publications, studies and documentation 130, rue de la Loi, B - 1049 Brussels
A great deal of additional information on the European Union is available on the Internet.
It can be accessed through the Europa server (http://europa.eu.int)
Cataloguing data can be found at the end of this publication
Luxembourg: Office for Official Publications of the European Communities, 1996
ISBN 92-827-8813-X
© ECSC-EC-EAEC, Brussels- Luxembourg, 1996
Reproduction is authorized, except for commercial purposes, provided the source 1s
European Commision
Directorate General for Agriculture (DG
VI)Working document
The Outlook of World Cereal Markets
An analysis of past developments (1961-1995)
and a critical evaluation of recent forecasts (1996-2000)
October 1996
Table of contents
Executive summary
1. Introduction
2. Developments in world cereal markets, 1961-1995
3. The medium-term outlook of world cereal markets (1996-2000}
4. Conclusions
References
Annex A - Wheat
Annex B -Coarse Grains
p. 1 p.1
p.2
p.7
p.l5
THE OUTLOOK OF WORLD CEREAL MARKETS
EXECUTIVE SUMMARY
Several organisations have recently published their outlook for world cereal markets to the year 2000 and beyond. This analysis, by assuming as its starting point information on the outlook in world cereal markets derived from major baseline projections (OECD, IFPRI, FAO, USDA, ABARE), attempts to examine the consistency of these projections and their sensitivity to changes in underlying assumptions.
Thus, after an examination of main developments in world cereal markets during the 1961-1995 period and the factors that determined them, a comparison of main projections follows. The main areas of uncertainties are then identified in order to examine the potential impact of alternative assumptions on the world outlook for cereals, and to provide a critical assessment of the medium-teim outlook for cereal markets. Finally, the estimated relationship of prices and stock-to-use ratio for wheat and coarse grains over the 1961-95 period is used to test consistency of price forecasts with the forecast level of world ending. stocks.
Cereal market developments, 1961-95
The current situation in world cereal markets is characterised by the lowest level of world stock-to-use ratio and the highest level of prices since 1961. During the last decade (1986-1995), world wheat consumption exceeded world production in six years, including four of the last five years. On the average, during the 1986-95 period the world consumed 6.5 mio tonnes more wheat than it produced. In coarse grains, the situation is similar, with consumption exceeding production in five of the last ten years (or by an average of 10 mio tonnes per year).
In trying to identify the underlying factors of recent price developments in world cereal markets, the present analysis found most of the explanatory elements on the supply rather than the demand side.
- Growth in wheat yields, that sustained the upward trend in world demand since the early 1960s, slowed down since the 1980s. Coarse grain yields follow a more stable trend in the long-run, but are characterised by wide annual fluctuations.
- Area allocated to cereals has been decreasing after 1985, as a result of supply-control measures in the developed world, and the combined impact of urbanisation and under-investment in agriculture in the developing world.
- The combined impact of area and yield developments implies that annual growth in wheat production has slowed down significantly, and is currently under 1 °/o, while coarse grain production still increases by more than 2 °/o annually.
- Wheat per capita consumption has stagnated since 1990, while coarse grain consumption has recently picked-up, driven by strong meat demand in Asia. However, in both wheat and coarse grains, annual rates of growth are lower than population growth rates since the mid-1980s.
- Unlike developments up to the mid-1980s, net cereal trade has also stagnated during the last decade, with export growth rates even lower than consumption growth.
Cereal market outlook, 1996-2000
With respect to world wheat markets, the conclusion derived on the basis of the present analysis, and under the assumption of constant policies, is that the expected strong growth in world wheat demand and trade forecast by several international organisations does not appear the most plausible scenario. World wheat consumption is estimated to increase by 43 mio t to the year 2000,
or 8% with respect to present levels (but much lower than the increase of 76 mio t, or 15%, estimated
by F AO and the OECD). High prices could continue to characterise world wheat prices during the next 2-3 years, but these will be mostly linked to the slow rate of adjustment of supply, due to lower yield growth and limited area availability.
On the contrary, this analysis concludes that coarse grain production and consumption will probably follow a stronger pattern than wheat, as most forecasts tend to indicate. Here, the link to the fundamental cause of strong cereal demand, the increasing meat demand in Asia, is more direct. Maize has an advantage over wheat as a feed grain both on the demand side (due to its lower price) and on the supply side (due to its higher yield). It is thus expected that total coarse grain consumption
could be higher by 96 mio t, or 12 %, in 2000 with respect to its depressed 1995 level.
Cereal prices, especially for wheat, should be expected to stay higher than their levels during the late 1980s or the early 1990s, although a decline from their present levels should come gradually as we move towards the year 2000. Given the present set of cereal policies around the world, a prudent interpretation of the very optimistic picture for growth in consumption and trade indicated by several major organisations is deemed necessary. Growth in production, consumption and trade should be less spectacular (yet significant), while world market prices, especially for wheat, should stay high and volatile until a gradual rebuilding of stocks towards the end of the century results in their decline, still to levels higher than the beginning of the decade.
The main area of uncertainty on the evolution of cereal production and consumption to the year 2000 is to be found in the developing world (mainly in Asia) and the FSU (Former Soviet Union), but the latter is not expected to play a major role in world trade until 2000. Developments in Latin America or Africa are not expected to bring major changes with respect to recent developments.
Abreviations used in this report
OECD : Organisation for Economic Co-operation and Development IFPRI: International Food Policy Research Institute
FAO: Food and Agricultural Organization (of the United Nations) USDA : United States Department of Agriculture
ABARE: Australian Bureau of Agricultural and Resource Economics VIA2 : European Commision Directorate General for Agriculture
-Quantitative analysis, statistics, forecast, remote sensing mio t : million metric tons
(2)
THE OUTLOOK OF WORLD CEREAL MARKETS
1. INTRODUCTION
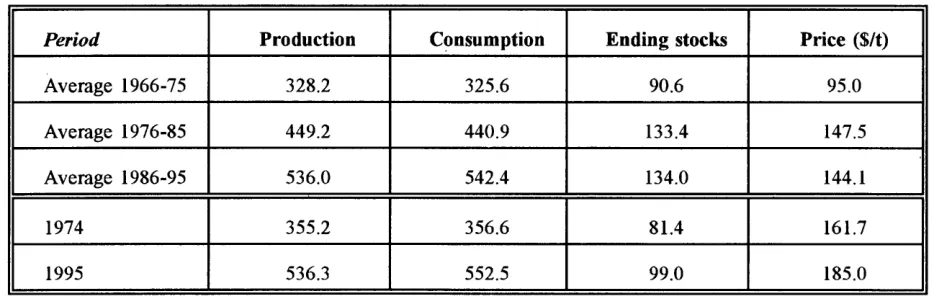
The current situation in world cereal markets is characterised by the lowest level of world stock-to-use ratio and the highest level of prices since 1961 (initial year for both the FAO and USDA international data bases). However, the present conjuncture contrasts the only other period with apparent similarities (1974), when stocks were also low and prices high, since it is not linked to a major macroeconomic shock, as was the case during the 1973 oil crisis.
Table Ja. World wheat production, consumption, ending stocks and prices, 1966-1995.
Period Production Consumption Ending stocks Price ($/t)
Average 1966-75 328.2 325.6 90.6 95.0
Average 1976-85 449.2 440.9 133.4 147.5
Average 1986-95 536.0 542.4 134.0 144.1
1974 355.2 356.6 81.4 161.7
1995 536.3 552.5 99.0 185.0
Table lb. World coarse grains production, consumption, ending stocks and prices, 1966-1995.
Period Production Consumption Ending stocks Price ($/t)
Average 1966-75 582.8 581.4 90.4 80.1
Average 1976-85 743.6 732.2 144.5 116.3
Average 1986-95 804.2 814.4 149.5 107.9
1974 622.7 612.9 90.5 128.3
1995 778.2 819.5 95.6 152.0
.S'ource: FAO, US'DA.
Note: Quantities are expressed in million tonnes. World prices are US export prices for wheat and maize (Gulf
ports).
It is evident from data in tables 1a, 1b (and the more detailed information included in the attached annexes) that the dramatic increase of world prices in 1995 cannot simply be explained by short-term developments.
During the last decade (1986-1995), world wheat consumption exceeded world production in six years, including four of the last five years. On the average, during the 1986-95 period the world consumed 6.5 mio tonnes more wheat than it produced, with a consequent decline in the level of ending stocks from 179 mio tin 1986 to 99 mio tin 1995 (or from 35 %of stock-to-use ratio in 1986 to 18 %in 1995).
[image:8.579.52.520.268.416.2] [image:8.579.55.519.463.610.2]In coarse grains, the situation is similar, with consumption exceeding production in five of the last ten years (or by an average of 12 mio tonnes per year). Ending stocks in coarse grains declined proportionately even more than wheat, from 235 mio tonnes in 1986 to 96 mio tonnes in 1995, or from 30 %of stock-to-use ratio to just below 12 %.
A situation similar to that observed in 1986-95, where cereal world consumption (excluding rice) exceeded cereal world production by 1.2 °/o annually, is not sustainable in the long run. Both production and consumption can be expected to adjust, responding to current prices and, in turn, affecting future prices. However, in order to analyse the potential pattern of this adjustment, one needs first to answer to two fundamental questions raised by recent developments: a) what are the underlying factors that led to the present situation, and b) how can these affect the long-term prospects of world cereal markets.
Several organisations have provided their answer to the second question above. The Food and Agriculture Organisation of the U.N. and the International Food Policy Research Institute (linked to the World Bank) have looked into the long-term horizon of agricultural markets, to the year 2010 (F AO) and 2020 (IFPRI). The FAO has also analysed the impact of the Uruguay Round to the year 2000. The USDA has looked into specific long-term food needs of developing countries, and has recently published its detailed projections to the year 2005. The OECD published in spring of 1996 its medium-term outlook to the year 2000. Finally, the Australian Bureau of Agricultural and Resource Economics has also provided its medium-term outlook to the year 2000.
This analysis does not attempt to provide another baseline, or some different answer to the questions raised above. Rather, by assuming as its starting point information on the outlook in world cereal markets derived from major baseline projections (OECD, IFPRI, FAO, USDA, ABARE), it attempts to examine the consistency of these projections and their sensitivity to changes in underlying assumptions. Thus, after an examination of main developments in world cereal markets during the 1961-1995 period and the factors that determined them, a comparison of main projections follows. Finally, the main areas of uncertainties are identified in order to examine the potential impact of alternative assumptions on the world outlook for cereals, and to provide an answer to the first question above by providing a critical assessment of the medium-term outlook for cereal markets.
2. DEVELOPMENTS IN WORLD CEREAL MARKETS, 1961-1995
The main determinant of developments in cereal markets during the last decade has been the slower pace of growth in production compared to consumption. The commonly used notion that cereal market developments have mainly been driven by strong demand does not stand to facts. World wheat consumption has rather stabilised, if not slightly declined, since 1990. In per capita terms, the slight downward trend is clear. Even coarse grain consumption, which continues to increase, has only added a minor downward tilt to its long-term trend during the last five years.
The fact that production laggs behind consumption takes an added significance if one considers that the Former Soviet Union (FSU), an importer of an average of 36 mio tonnes of cereals annually in the 1980s, only plays a minor role in recent years. The drop in its consumption should have allowed world production to cover demand needs, especially since these are growing at slower rates.
Table 2a. Annual growth in world wheat area, yield, production and consumption, 1961-1994.
Period Area Yield Production Consumption
Average 1961-72 0.33% 3.63% 3.96% 3.81%
Average 1972-83 0.76% 2.56% 3.34% 2.65%
Average 1983-94 -0.58% 1.30% 0.72% 1.43%
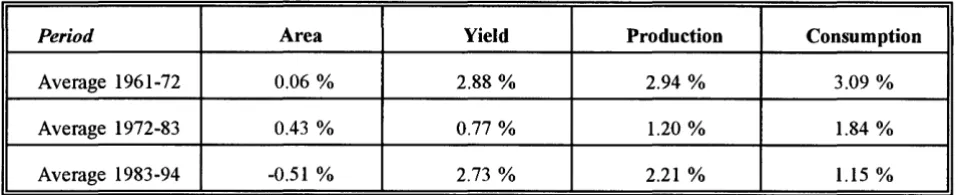
Table 2b. Annual growth in world coarse grain area, yield, production and consumption, 1961-1994.
Period Area Yield Production Consumption
Average 1961-72 0.06% 2.88% 2.94% 3.09%
Average 1972-83 0.43% 0.77% 1.20% 1.84%
Average 1983-94 -0.51% 2.73% 2.21% 1.15%
Source: Vl-A2 calculations on the basis of FAO, US'DA data.
For more details at the regional level and a graphical presentation of developments described in this part, see annexe tables 1a (wheat) and 1b (coarse grains).
a. Area allocation
World wheat area grew during both the 1961-72 and 1972-83 periods, actually increasing its annual rate of growth from 0.3 %to 0.8%. Coarse grain area, stable throughout 1961-72, increased at 0.4% annually during 1972-83. However, both wheat and coarse grain area declined during 1983-94, by similar rates of around half a percentage point per year.
World wheat area, at 203 mio hectares in 1961, reached its peak of 23 9 mio ha in 1981, and declined to 215 mio ha by 1994, before increasing again in 1995. In wheat, two contrasting trends dominate. Asia (excluding its FSU part) has added almost 25 mio ha to its 1961 base of 61 mio ha, while the FSU has seen its wheat area decline by 21 mio ha over the same period (from 63 mio ha to 44 mio ha~ note that this decline started already in the early 1970s). Europe as a whole (excluding its FSU part) is currently at its 1961 level. North America has had significant variations, but its current levels are higher than those in the 1960s. Finally, despite strong annual variations, Latin America, Africa and Oceania have had a minor world impact due to their size, losing over the whole period some 4 mio ha of wheat land.
World coarse grain area, which increased from 315 mio ha in 1961 to 348 mio ha in 1981, had dropped to 305 mio ha by 1995. However, coarse grain annual area allocation at the world level masks significant regional differences, and a general pattern of development is not easily identifiable. In order to get a more clear picture, it is necessary to look at a more regional level. In coarse grains, all major regions have witnessed a decline in area, especially since the early 1980s. Asia and the FSU have seen their area drop by 15 mio ha each, Europe has lost around 10 mio ha, while North America was in 1995 almost 10 mio ha lower than its 1985 area. Africa, which accounts for an important share of coarse grain area, has seen only marginal gains, while Latin America area has remained constant on the average.
[image:10.581.43.518.115.214.2] [image:10.581.43.522.264.361.2]b. Yield growth
Wheat yield trends have slowed down in all regions of the world except Africa. This development, which can be traced to the early 1980s, has been more pronounced in Europe and the FSU. Part of the decline in Europe is reversible, since it can be attributed to the adjustment process of transition to a market economy in Central Europe. Another part, however, seems to indicate a general slow-down in wheat yield growth, as is evident in developments in the EU, the region with the highest yields in the world. In the remaining regions, except Africa, the slow-down in wheat yields is evident, with both yields and growth rates lower than those in the EU.
Coarse grain yields have exhibited growth patterns that differ among regions, compensating gains for losses, thus keeping the world aggregate rate of growth unchanged. Growth of yields in Europe (mainly Central Europe) and the FSU have declined. while yields in Asia, Africa, North and Latin America currently have an annual rate of growth that is higher than in the 1960s. The US drought of 1983 forced the 1983-92 world growth rates lower, but US yields have since recovered. Within coarse grains, maize yields have been growing much faster than yields in other feed grains. However, annual variations in maize yields have also increased, with US maize yields being particularly volatile - their annual fluctuation, always in opposite directions, has ranged between 17 % and 2 9 % with respect to the previous year during the 1991-95 period.
c. Consumption
World cereal consumption had been growing faster than world population from 1961 to the mid 1980s, but has changed pattern since then. By 1990, world wheat consumption seems to have reached a peak, while per capita consumption actually started to decline some years earlier. This development can not be attributed to the FSU or Central Europe alone, where transition to a market economy led to a drastic drop in per capita consumption of wheat. Although changes in these regions certainly affect world totals, they only partly explain them. In fact, it is the most populated regions of the world, Asia, Africa and Latin America, that are witnessing a stagnation in their per capita wheat demand, although the pattern differs significantly within each region. It is interesting to note that major producers in the developed world (North America, EU, Australia) have experienced increases in their wheat consumption in recent years, mainly for feed use.
Coarse grain consumption presents a mixed picture. In absolute terms, coarse grain consumption was increasing throughout the 1961-95 period, but its rate of growth in the second half of this period has clearly diminished. In per capita terms, consumption in coarse grains was on the increase until the end of the 1970s (with the notable exception of a significant drop in 1974). Throughout the 1980s, per capita coarse grain consumption was on the decline, but seems to have stabilised since 1990. Developments in coarse grain markets reflect, more strongly than wheat, changes in feed demand linked to world meat production. Therefore, their regional breakdown could shed more light to their underlying factors.
Since 1990, two different patterns emerge, both linked to developments in meat demand and production. In Central and Eastern Europe and the FSU, the abolition of subsidies due to the. transition to a market economy led to a decapitalisation of the livestock herd and an increase in the price of meat, causing a structural (probably permanent) downward shift in meat supply and demand, and thus in feed demand. These losses were, however, overcompensated by a strong increase in meat demand in most other parts of the world. To some extent, the impact of these changes led to an increase in feed demand of coarse grains in some meat exporters (Brazil, Argentina, Australia - in the US and the EU, this shift was to the benefit of feed wheat). However:, it is mainly feed demand for maize in Asia that accelerated in recent years, as a result of the very rapid increase in meat (pork and poultry) demand in the region.
d. Trade
Trade patterns generally reflect the balance between supply and demand, and changes in trade policies. Throughout the historical period examined in this part ( 1961-95), agricultural policies in cereals (including their trade component) essentially remained unchanged until1985. Thus during the 1961-1980 period, world trade patterns reflected the supply-demand balance in various regions. Throughout this period, world wheat trade (measured as exports) doubled from 45 mio t to 95 mio t, while world coarse trade passed from 30 mio t to 110 mio t. The annual rate of growth in wheat and coarse grain exports exceeded growth in both their production and consumption.
In wheat, North America accounted for half of world exports, with US wheat exports doubling over the 1961-80 period(from 20 to 40 mio t). Canada saw its wheat exports increase from 10 to 15 mio, while Australia also added roughly 5 mio t to world trade (up from around 5 mio tin 1961). However, the main change throughout the period was the gradual emergence of the EU as a wheat exporter towards the end of the 1970s. From a net importer of 10 mio t in 1961, the EU had turned into a net exporter of 10 mio t by 1980 (and the main importer of cereal substitutes and oilmeals for feed). The only other significant exporter, Argentina, also increased its exports over the period, but at a slow pace and with strong annual variations. On the import side, Asia which accounts for about one third of world trade, saw its wheat imports double over the period (although South Asia actually stabilised its import demand) while Africa increased its wheat imports three-fold. Yet, the main change took place towards the second part of the 1970s, when the FSU, a net exporter through most of the 1961-75 period, turned into an importer of 15 mio t of wheat by 1980.
In coarse grains, the US alone covers two-thirds of world trade. From 1961 to 1980, US exports in coarse grains (85 %of it in maize) passed from 15 mio t to 70 mio t. Argentina also increased its net exports from 5 to I 0 mio t over the same period. On the import side, imports in Asia increased ten-fold. With China more or less in balance over the whole period, it was Japan that had the main impact- Japanese coarse grain imports jumped from 2.5 mio tin 1961 to 19 mio tin 1980. The other main development was in the FSU, which exhibited a similarpattern with its wheat net trade and turned into an importer of 18 mio t of coarse grains by 1980.
Since the mid-1980s, trade developments were affected by policy changes in several parts of the world. A significant impact in world markets came certainly from changes in US agricultural policies, especially under the 1985 Farm Bill. These changes altered significantly US export policies, first by a massive buy-out of stocks in exchange of area limitations (PIK), then through the gradual decrease of loan rates, the more aggressive use of export subsidies as a result of the Export Enhancement Programme (EEP), a price-support policy influenced by market developments and a significant set-aside of agricultural land, both on an annual (ARP) and a multi-annual (CRP) basis. In fact, developments during the last decade can to a large extend be traced to the agri~ultural policy change of the US being the residual supplier of the world.
With the US unwilling to hold large quantities of public stocks, and with significant surpluses in Canada, Australia and increasingly in the EU, world wheat importers faced a buyer's paradise after the passage of the ! 985 Farm Bill. World prices declined under the combined influence of increased supplies, increased export subsidies and a lower US.dollar, and from 1986 to 1989 world wheat stocks dropped by 60 mio t (or by one-third of their 1986 level).
US wheat exports increased from an evenly spread two-year total of 50 mio t in 1985 and 1986 (partly due to the high dollar) to over 80 mio t over the next two years. Coarse grain stocks followed the same path, and declined by 113 mio t (or 48 °/o) from 1986 to 1989- 107 mio t of this decline are attributed to the drop in US stocks. US exports, which had dropped to just 35 mio tonnes in 1985, a record crop year, passed gradually to 68 mio t by 1989. The large drop in US stocks from 1985 to 1989 benefited two regions: the FSU for coarse grains, and China for wheat. The first soon dropped out of the picture, the second imported mainly to cover poor wheat harvests in 1987 and 1988.
However, in more recent years significant changes in cereal farm policies in the US ( 1990), the EU ( 1992) and Canada ( 1995) coincided with a major development impacting on world trade of cereals that was exogenous to agriculture. The transition of the FSU and Central Europe to a market economy resulted in their diminished role in world cereal imports. Consequently, the strong increase of coarse grain demand in Asia after 1990, especially in China, did not result in a boost for world trade.
This is evident from tables 3 and 4, which indicate that the combined developments in Asia and in the former Soviet block seem to cancel each other. Despite strong annual variations, world trade in cereals has stagnated after 1983. The four major exporters in wheat globally exported around 70 mio ton the average during the 1986-90 and 1990-95 periods, with minor changes in their shares.
Table 3. Annual growth in cereal exports, 1961-1994.
Period Wheat Coarse grains
1961-72 3.91% 6.64%
1972-83 4.00% 3.82%
1983-94 0.01% -0.64%
S'ource: VJ-A2 calculations on the basis of FAO, USDA data.
Table 4. Average net exports ofwheat,four main exporters, 1981-1995 (in mio t).
Period European Union United States Canada Australia
Average 1981-85 12.1 38.1 19.4 12.5
Average 1986-90 16.5 33.6 19.4 11.9
Average 1991-95 17.6 32.5 20.4 10.0
[image:13.580.60.540.453.550.2] [image:13.580.61.544.625.724.2]e. Conclusion
During the last decade, developments followed a spiral path, with interacting policy changes in several countries, including the major policy change of the 1992 CAP reform and the GA TI agreement (whose implementation starts after the period under examination in this section). It is impossible to trace short-term developments to individual events in such an environment. However, in trying to answer the first question posed in the introduction, namely what were the underlying factors of recent price developments in world cereal markets, most of the explanatory elements can be found on the supply rather than the demand side.
1) Growth in wheat yields, that sustained the upward trend in world demand since the early 1960s, slowed down since the 1980s. Coarse grain yields follow a more stable trend in the long-run, but are characterised by wide annual fluctuations.
2) Area allocated to cereals has been decreasing after 1985, as a result of supply-control measures in
the developed world, and the combined impact of urbanisation and under-investment in agriculture in the developing world.
3) The combined impact of area and yield developments implies that annual growth in wheat production
has slowed down significantly, and is currently under 1 °/o, while coarse grain production still
increases by more than 2 °/o annually.
4) Wheat per capita consumption has stagnated since 1990, while coarse grain consumption has recently picked-up, driven by strong meat demand in Asia. However, in both wheat and coarse grains, annual rates of growth are lower than population growth rates since the mid-1980s.
5) Unlike developments up to the mid-1980s, net cereal trade has also stagnated during the last decade, with export growth rates even lower than consumption growth.
3. THE MEDIUM-TERM OUTLOOK OF WORLD CEREAL MARKETS (1996-2000)
A distinction should be drawn between the medium-term outlook in cereal markets to the year 2000 and the long-term horizon. Several organisations have produced baseline projections for the medium-term, while the long-term outlook has been the focus of attention of the FAO and IFPRI, to 2010 and 2020, respectively.
In this analysis, the focus will be on the medium-term, with the OECD outlook forming the basis of
evaluation and the baseline projections from FAO, USDA and ABARE used as additional sources of
information. In addition, an VI-A2 assessment of the likely world outlook is given at the end, based on
extensive analysis of yield trends at a regional level and a synthetic evaluation of the outlook of various sources.
Most forecasts tend to agree in their global assessment of the medium -term outlook to 2000. Recently implemented policy changes in most major exporters (EU, US, Canada), the implementation of the GA TI agreement, the slow process of adjustment in Central Europe and (particularly) in the FSU, and the expected increase in demand in Asia, these are the factors that paint the picture to the tum of the century. However, differences in numbers exist, and they have their significance since they can point to uncertainties that could affect assessment of the long-term outlook.
The following tables (5a-5b) present the most recent outlook to the year 2000 from the OECD, FAO, USDA and ABARE.
Table StL Medium-term outlook for wheat for the year 2000 (in mio t).
World OECD FAO USDA ABARE
Production 633.3 ' 630.9 593.1 604.0
Consumption 633.3 629.5 593.0 601.0
Trade n.a. 114.8 108.6 113.0
Stocks 126.1 n.a. 110.9 116.0
Price (US $/t) 142.0 149.4 143.3 194.0
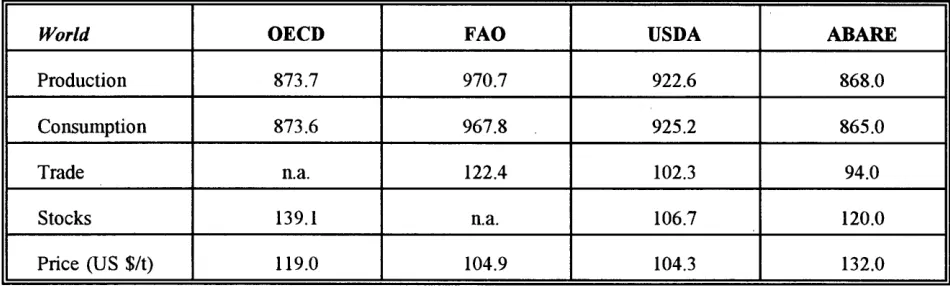
Table Sb. Medium-term outlook for coarse grains in the year 2000 (in mio t).
World OECD FAO USDA ABARE
Production 873.7 970.7 922.6 868.0
Consumption 873.6 967.8 925.2 865.0
Trade n.a. 122.4 102.3 94.0
Stocks 139.1 n.a. 106.7 120.0
Price (US $/t) 119.0 104.9 104.3 132.0
Prices are US' export prices for wheat and maize (Gulf ports), except for the OECD wheat price (Argentina), All prices are nominal. The FAO does not provide absolute prices, but these were calculated from price change forecasts
(n.a.: non-available).
It is important to note that area allocation, where available, does not differ significantly in most of the above forecasts. Given that net trade is derived from the regional balance between supply and demand and stocks are generally treated as a residual, differences in the outlook of the above organisations have to be attributed to differences in yields and consumption patterns at the regional level. Furthermore, forecasts for the OECD countries are generally very similar, leaving as an object of inquiry developments in the non-OECD world.
The outlook for Latin America and Africa also seems to leave little room for major errors due to the relatively small impact of Latin America on world trade (Argentina has increasingly been exporting within the region), and to the poor prospects of a real improvement in the increasing deficit of Africa.
[image:15.575.57.533.169.316.2] [image:15.575.56.531.363.506.2](3)
OECD, USDA and ABARE expect that Central Europe, already a minor net exporter of cereals, will increase its net exports by 2-3 mio t by the year 2000, while the FSU (excluding intra-trade) will import quantities that will not exceed the Central European surplus. It can therefore be concluded that, at least till the end of the century, developments in the former Soviet block will tend to cancel each other, having an insignificant impact on world trade.
On the other hand, developments in Asian markets seem to be the fundamental reason for the positive tone in both OECD and USDA forecasts, which seem to attribute bright prospects for global trade to strong income growth in Asian markets and the positive impact of the GATT agreement on trade. This could be a plausible outcome, but its underlying assumptions require some critical examination, and a distinction between wheat and coarse grains.
a. Wheat production
Since the outlook of the above organisations differs with respect to the projected level of world wheat production, one has to identify differences in the components of this outcome first. OECD and ABARE provide both area and yield figures for the world. By the year 2000, the OECD foresees world wheat area at 23 7 mio ha and ABARE at 231 mio ha, up from 218 mio ha in 1995. For comparison, the outlook of USDA is lower, at 225 mio ha. ABARE does not provide detailed figures per region.
The change in wheat area foreseen by the OECD is attributed to the OECD countries (+ 3-4 mio ha), to the FSU and the four Visegrad countries (+5 and+ 1 mio ha, respectively), and to the rest of the world (+3 mio ha).
Wheat yield figures differ only slightly, with OECD at 2.67 t/ha, higher than the ABARE world yield of 2.61 tlha. USDA forecasts wheat yields at 2.64 tlha. F AO does not provide detailed area and yield figures in its Uruguay Round study. In its 20 10 project, it indicates a cereal yield of 2. 7 tlha for the 93 developing countries excluding China in 2010. By deduction, it is assumed here that the 2000 yield for these countries is 2.63 halt, thus similar with that of other forecasts. (Detailed analysis within VI-A2, that focused on yield trends per region and major producer, indicates a world yield of 2.68 tlha, i.e. at the level of yield suggested by the OECD.)
To better understand the source of the differences that appear in the previously mentioned forecasts, one has to enter into regional details. ABARE does not provide such details in its publication. OECD does have a very detailed analysis for its region, but treats the rest of the world in a global manner. The FAO provides a regional break-down for production, but area and yield figures are not presented. USDA provided its own revised outlook for 2005 in August 1996, which added both world totals and regional information to its February 1996 baseline, but did not integrate the impact of the FAIR Act.
On the basis of information from the above sources, table 6 was constructed. In this table, the assessment of DG VI-A2 on the world wheat outlook for 2000 is included. This assessment, which is based on a critical synthesis of different forecasts and is almost identical to the ABARE world total (for which no details are available), is based on the following principles:
a) For the US and Australia, the most recent information of USDA and ABARE was used, respectively. This information differs slightly from the OECD outlook.
b) For the EU, the revised medium-term forecasts ofVI-A2 are used, based on a low-yield trend scenario and on the assumption that the set-aside rate is applied as foreseen in the revised Regulation 1765/92.
c) For the rest of the OECD, the outlook of the organisation has remained unchanged in the VI-A2 assessment.
d) For the FSU, area allocation in wheat is expected to increase by 0.6 mio ha from 1995 to the year 2000, instead of the OECD figure of 5 mio ha (a figure not found in any other source of information).
e) For Latin America, the figure for Mexico comes from the OECD, while for the rest of the region figures are based on recent trends.
f) For China, wheat area increases slightly in 1996, but stabilises afterwards to the year 2000. For the rest of Asia and Africa, the recent (very steady) trend of area growth is used.
g) For the CEEC, the DG VI studies formed the basis for the outlook of the region (some yields were slightly modified in view of recent developments, and former-Yugoslavia was added to the total).
Table 6. Outlook for wheat production in the year 2000 (by region, in mio t).
ReJ!ion/Countrv OECD FAO USDA
EUROPE n.a. 114.92 n.a.
-Ell 97.65 73.72 94.69
- CEEC11
(22. 77) 40.23 36.23
NORTH AMERICA 99.72 95.64 95.44
-us
71.49 69.23 68.96 -Canada 28.23 26.37 26.48LA TIN AMERICA n.a. 23.35 n.a.
- Arf!entina n.a. 11.48 11.70
-Brazil n.a. 3.63 1.94 -Mexico 4.73 4.85 4.48
ASIA21 n.a. 265.48
n.a.
-China n.a. 122.67 102.08 -South Asia n.a. 90.35 89.60
AFRICA21 n.a. 18.07 n.a.
AUSTRALIA 16.05 18.63 17.09
FSU 83.02 94.63 75.62
I
WORLDI
633.251 630.891 593.081Note: n.a. indicates a non-available figure.
11
The OECD figure for CEEC includes only Poland, Hungary, the Czeck Republic and Slovakia.
21
FAO does not provide figures for Africa and Asia, but country data allow aggregation.
VI-A2
136.03
96.71 38.30
97.20
68.97 28.23
18.87
10.70 2.05 3.77
239.80
108.35 86.54
16.62
15.79
74.76
[image:17.576.53.532.265.729.2]b. Wheat consumption
In wheat, the OECD foresees an increase of global consumption by 63 mio t from 1995 to 2000 - 50 mio for human consumption and the rest for animal feed. For its members, the OECD outlook looks perfectly plausible. It foresees a slight drop of human per capita consumption (by 1 kg to 105 kg per head) and a further increase of wheat feed demand by close to 6 mio t, essentially all of it in the EU due to the drop of wheat prices from current levels and to strong oilmeal prices. However, the outlook that the OECD provides for the non-OECD world could prove to be optimistic. With wheat feed demand increasing by only 6 mio t, it is the outlook for human consumption of wheat in the region that poses some problem.
The OECD outlook implies an increase in per capita wheat demand by 3 % or 2.5 kg per head, from 82.1 kg per head in 1995 to 84.6 kg per head in the non-OECD world by the year 2000. However, rates of growth in per capita human consumption of wheat have been declining since 1990 despite the strong income growth in the region. Given the treatment of the non-OECD world as a block in OECD forecasts, it not possible to identify the regions that would absorb all this increase. One can only assume that, because the OECD foresees only a small increase of OECD wheat exports (essentially going to the non-OECD world, since Japanese imports are expected stable}, most of this increase in human demand has to be met by the non-OECD world itself.
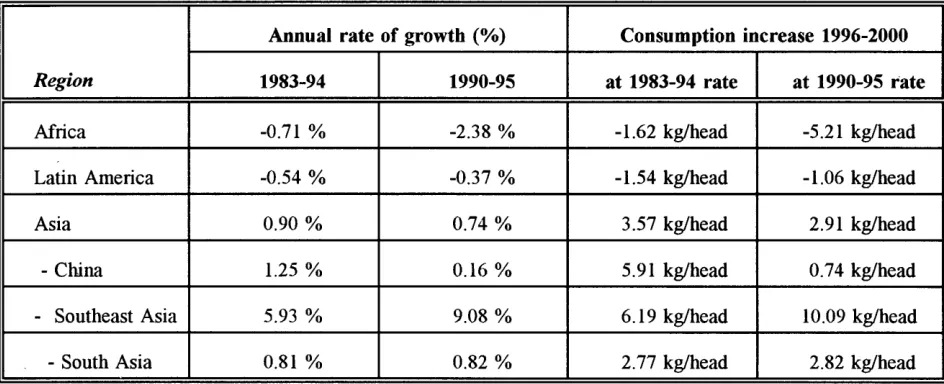
Table 7 looks into recent developments in the non-OECD area to test the plausibility of the OECD forecast.
Table 7. Per capita wheat consumption in the non-OECD world.
Annual rate of growth (o/o) Consumption increase 1996-2000
Region 1983-94 1990-95 at 1983-94 rate at 1990-95 rate
Africa -0.71 % -2.38% -1.62 kg/head -5.21 kg/head
Latin America -0.54% -0.37% -1.54 kg/head -1.06 kg/head
Asia 0.90% 0.74% 3.57 kg/head 2. 91 kg/head
-China 1.25% 0.16% 5. 91 kg/head 0. 7 4 kg/head
- Southeast Asia 5.93% 9.08 o/o 6.19 kg/head 10.09 kg/head
-South Asia 0.81% 0.82% 2. 77 kg/head 2.82 kg/head
Source: VI-A2 calculation on the basis of FAO, USDA data and OECD outlook.
Southeast Asia: Indonesia, Malaysia, Thailand, Philippines, Vietnam; South Asia: India, Pakistan, Bangladesh.
The above table indicates that Africa and Latin America are decreasing their per capita consumption of wheat, with the former deteriorating its position and the latter ameliorating it somewh~t. This leaves once more Asia as the main area of focus. The OECD forecast could look plausible only if trends of the 1983-94 period continue in this region. However, there has been a marked slow-down in Asia as a whole after 1990, in South Asia (India, Pakistan, Bangladesh), and particularly in China.
[image:18.575.40.512.394.586.2]Only Southeast Asia, a region that is not producing any wheat, keeps increasing its wheat consumption rapidly. However, the region has a per capita consumption of only 18.6 kg/head, and even if it keeps growing at recent rates, it is not expected to increase its total wheat consumption by more than 6 mio t up
to the end of the century. In addition, if income growth is considered as the driving force of Asian wheat
demand in recent years, then the latter should not be expected to grow faster in the future because income growth is foreseen by the OECD to slow down, compared to current rates, in the region.
FAO consumption forecasts might also be viewed as being too optimistic. The FAO distinguishes
between two main groups, developed and developing world, and has detailed country forecasts. In the
developed world, the F AO estimates for wheat consumption in the EU and the US are lower than those of the OECD and most other forecasts by 10 and 4 mio t, respectively. However, since the FAO seems to over-estimate FSU consumption by 13 mio t, global FAO results for wheat consumption in the developed world do not differ from those of the OECD if the FSU is included.
This again brings the focus of attention to the developing countries, and the detailed results of the F AO allow for a more concrete evaluation. It is again in Asia where most of the potential for error exists. In China alone, FAO indicates a total wheat consumption of 138 mio t by the year 2000. This figure (which exceeds by 20 mio t the IFPRI forecast for 2000) implies a per capita consumption of 104 kg/head in 2000, that is an increase of 11.5 kg/head in 5 years. Yet Chinese consumption increased by just 0.7
kg/head during the last five years. In South Asia the FAO sees an increase of 3.5 kg/head in wheat
consumption - a figure slightly higher than the 1983-94 trend. If the recent slow-down in South Asia is confirmed, wheat consumption in the area would be lower than the FAO forecast by 2 mio t, a much smaller discrepancy than the Chinese figure.
Unfortunately, USDA forecasts only provide net trade projections. However, these indicate a modest recovery in world wheat exports, with China increasing its wheat imports from 12 to 15 mio t, and the rest of the world absorbing another 7 mio t of exports. Most of the increase in world trade, (7 out of 10 mio t) comes from the US, with other exporters exhibiting minor gains and only the EU declining from 19 mio t in 1996 to 16 mio t by 2000 (but regaining its losses by 2005).
ABARE differs in its forecasts from the OECD, FAO and USDA in two aspects. First, it is more modest
for world wheat production and consumption levels by the year 2000~ second, it sees a somewhat
stronger growth in world wheat trade than the USDA.
ABARE sees an increase of wheat exports from their present level of 98 mio t to 113 mio t by 2000/0 1 -USDA arrives at this level two years later. The FAO level of wheat trade is at 115 mio t by 2000, while the OECD sees net exports of the OECD world to the non-OECD world increase by 8 mio t during the
1995-2000 period, or by only 4 mio t compared to the 1994 level of wheat exports. (In view of the strong
increase in wheat demand and the very small increase in wheat imports of the non-OECD countries from the OECD area, it is very hard to see where the additional production of wheat will come from in the OECD outlook).
The comparison of OECD, FAO, USDA and ABARE medium-term outlook for wheat consumption to the
year 2000 indicates that most of the uncertainty comes from China, a region that will account for 20 %
c. Coarse grain production
Table 8 summarises coarse grain results on the same basis as table 6. A note of caution is necessary for the OECD figure of the world total, that excludes an important part of grains (e.g., millet) produced in the developing world. This is the reason for which there is an important difference between the OECD total for the world and the totals of FAO, USDA and VI-A2. Most probably, the world total of ABARE figures (table 5b) also excludes these cereals. The absense of a regional break-down again poses some problems, but these are less important than in wheat if one takes into account the exclusion problem mentioned before.
Table 8. Outlook for coarse grain production in the year 2000 (by region, in mio t).
ReJ!ion/Country OECD FAO USDA
EUROPE n.a. 156.75 n.a.
-EU 85.01 98.03 94.06
- CEEC11 (18.10) 56.84 53.37
NORTH MffiRICA 295.77 284.52 302.37
- U.S' 272.56 257.28 278.92
-Canada 23.21 27.24 23.45
LATIN MffiRICA n.a. 98.24 92.42
-A~ntina n.a. 17.69 16.49
-Brazil n.a. 40.68 39.77
-Mexico 28.11 23.16 25.20
ASIA21 n.a. 236.35 n.a.
-China n.a. 136.24 131.76
AFRICA21 n.a. 89.91 n.a.
AUS1RALIA 7.82 9.53 8.39
FSU 76.22 95.40 80.39
I
WORLDI
873.62I
970.671 922.60I
Note: n.a. indicates a non-available figure.
11
The OECD figure for CEEC includes only Poland, Hungary, the Czeck Republic and Slovakia.
21
FAO does not provide figures for Africa and Asia, but country data allow aggregation.
p. 13
VI-A2 148.91
87.30
60.07
300.89
276.42
24.47
92.79
15.81
39.88
24.11
214.80
139.03
70.62
7.74 79.78
In fact, the conclusion one could draw from the above table is that, in general, forecasts for coarse grain are relatively close, with three notable areas of difference: Europe, Africa and the FSU, all affecting mainly the FAO outlook. FAO forecasts ignore the significant shift from coarse grains to wheat that is taking place in the EU, thus over-estimating production in coarse grains and underestimating it in wheat (see table 6). All other forecasts are very similar for the EU.
For Africa, the F AO outlook (98 mio t) seems very optimistic. Although OECD does not provide any figures, OECD totals indicate a production of 87 mio t for Africa and the Middle East combined- a figure lower than that of FAO. It is only in the FSU where different assumptions on area and yield growth result in significant differences in production. As in wheat, this difference does not impact on world trade, since the FSU is expected to remain a minor net importer.
d. Coarse grain consumption
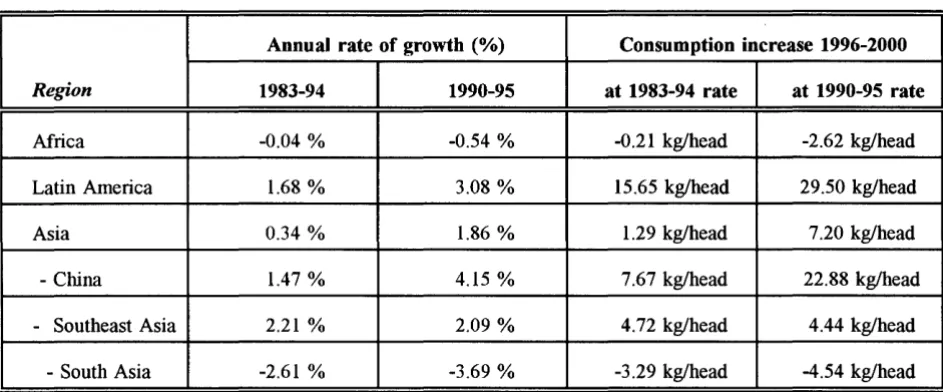
In similarity with wheat, table 9 presents the recent evolution of coarse grain consumption in the non-OECD world.
Table 9. Per capita coarse grain consumption in the non-OECD world.
Annual rate of growth (%) Consumption increase 1996-2000
Region 1983-94 1990-95 at 1983-94 rate at 1990-95 rate
Africa -0.04% -0.54% -0.21 kg/head -2.62 kg/head
Latin America 1.68% 3.08% 15.65 kg/head 29.50 kg/head
Asia 0.34% 1.86% 1.29 kg/head 7.20 kg/head
-China 1.47% 4.15% 7.67 kg/head 22.88 kg/head
- Southeast Asia 2.21% 2.09% 4.72 kg/head 4.44 kg/head
-South Asia -2.61% -3.69% -3.29 kg/head -4.54 kg/head
S'ource: VI-A2 calculation on the basis of FAO, USDA data.
S'outheast Asia: Indonesia, Malaysia, Thailand, Philippines, Vietnam; South Asia: India, Pakistan, Bangladesh.
The above table indicates the regions where consumption patterns have changed recently in coarse grains-China and Latin America for the better and South Asia and Africa for the worse. In China, this development is linked to the rapid increase in meat demand (expected to continue in the near future). In
[image:21.577.65.537.342.538.2]e) Conclusion for the outlook of world cereal production and consumption
As is evident from the previous discussion, the main area. of uncertainty on the evolution of cereal production and consumption to the year 2000 is to be found in the developing world (mainly in Asia) and the FSU. However, the FSU is not expected to play a major role in world trade until 2000. In addition, developments in Latin America do not pose major problems in tenns of the potential outlook of the region. Even in Africa, the bleak picture of the region's outlook is mainly an issue for policy debate, with unfortunately little room for a change in outlook to the year 2000. It is therefore the difference between projected production and consumption in Asia that deter1mines to a large extend the prospects for world cereal markets, since the difference between the two t:nds up as exports of the developed world to the region.
With respect to world wheat markets, the conclusion derived on the basis of the analysis presented here, and under the assumption of constant policies, is that th.:~ expected strong growth in world wheat demand and trade does not appear the most plausible scenario. High prices could continue to characterise world wheat prices during the next 2-3 years, but these will be mostly linked to the slow rate of adjustment of supply, due to lower yield growth and limited area availability.
On the contrary, coarse grain production and consumption will probably follow a stronger pattern than wheat, as most forecasts tend to indicate. Here, the link to the fundamental cause of strong cereal demand, the increasing meat demand in Asia, is more direct. rviaize has an advantage over wheat as a feed grain both on the demand side (due to its lower price) and on the supply side (due to its higher yield).
4. CONCLUSIONS
As stated previously in this report, its objective is not to provide forecasts for the world cereal outlook, but to critically examine the plausibility of the outlook provided by various organisations that tend to influence public opinion due to their role or importance (OECD, F AO, USDA, ABARE), despite the inherent difficulties of such an exercise (differences in data, assumptions, regional coverage).
On this basis, it has been possible to conclude in this analysis that the widely held belief that current high prices and low stocks are the result of bad weather and strong demand does not seem to be supported by hard evidence. Despite the undisputed role of weather on crop yields on an annual basis, and the existence of some successive bad harvests in recent years, the current situation is the result of developments that are present for more than a decade, the main ones being the decline in world cereal area and the slow-down in yield growth. Thus, cereal production has repeatedly fallen behind consumption during the last decade despite the slower growth of consumption and the stagnation of trade since the mid-1980s.
If this assertion is true, then cereal prices, especially for wheat, should be expected to stay higher than their levels during the late 1980s or the early 1990s, although a decline from their present levels should come gradually as we move towards the year 2000. A gradual increase of stocks as a result of a recovery in area and production should eventually lead to llower prices, but this could well take a few years.
Developments in 1996 provide an interesting insight into the manner by which adjustments in cereal markets could take place as we move towards the end of the century. Within a few months, the expectations of a worldwide shortage of grains, that briefly led wheat price:s close to $ 300 per tonne, were reversed as the harvest approached and area increases amomg all major e:xporters, together with record yields, led to a significant increase in world production. Had these developments been driven by strong demand, one would have expected a strong increase in trade. However, the contrary is now the case - current expectations are that trade will decline in 1996/97.
Given the weather instability that characterises agricultural markets, a linearly smooth path of response of cereal markets to price signals does not appear likely. As evidenced by the strong cereal price variability of the first months of 1996, the current level of stocks, coupled with the lack of a policy of public stock-holding by any major exporter, implies that prices estimated on the basis of the historical stock to price relationship are probably the lower limit of potential world market prices. Actual prices could tum out to be higher due to the risk premium that markets would tend to attribute to the absense of the buffer effect of public stocks.
Thus the process of adjustment is not only going to be slow, but unevenly spread in time and in space.
In fact, most of the potential for consumption growth rests with the developing world, while most of the capacity of supply response with the developed world. Thus, the transmission of market price signals to producers will be crucial in determining trade flows. In addition, two regions with opposite developments in recent years, China and the FSU, are full of uncertainties.
References
ABARE, 1996. Outlook for food grains.
Alexandratos N., 1995. World agriculture: Towards 2010, an FAO study. FAO, Rome.
Canadian Wheat Board, 1995. CWB grain trade, forecast to 2004-05.
Delgado C. L., 1995. Africa's changing agricultural development strategies: Past and present paradigms as a guide to the future. IFPRI, Washington D.C.
DeRosa D. A. and K. Govindam, 1995. Agriculture, trade, and regionalism in South Asia. IFPRI,
Washington D.C.
FAO. Uruguay Round impacts.
Gill G. J., 1995. Major natural resource management concerns in South Asia. IFPRI, Washington D.C.
OECD, 1995. China's food economy: past performance and future trends. Paris.
OECD, 1996. The agricultural outlook, trends and issues to 2000. Paris.
Rosegrant M. W., Agcaoili-Sombilla M. and Perez N. D., 1995. Global food projections to 2020: Implications for investment. IFPRI, Wallington D.C.
Rosegrant M. W., Agcaoili-Sombilla M. and Perez N. D., 1995. Global food supply and trade to 2020: Implications for policy and investment. IFPRI, Wallington D.C.
Trigo E. J., 1995. Agriculture, technological change, and the environment in Latin America: A 2020 perspective. IFPRI, Washington D.C.
USDA, 1996. Long term agricultural projections to 2005. Washington D.C.
European Commision
Directorate General for Agriculture (DG
VI)Working document
The Outlook of World Cereal Markets
Annex A - Wheat
(1961-1995)
Annex table 1a. Annual growth rates in wheat, 1961-94.
Annual rate of growth (o/o)
WHEAT Area Yield
Region 1961-72 1972-83 1983-94 1961-72 1972-83 1983-94
Europe 0.04% -0.22% -0.32% 4.33% 2.37% 1.66%
-EU -0.25% 0.09% -0.99% 4.18% 2.49% 2.62%
North America -1.03% 3.02% -0.64% 3.98% 1.48% 0.03%
-U.S' -0.79% 2.40% 0.05% 2.89% 1.71% -0.43%
Latin America 1.15% 2.19% -2.03% 0.25% 3.41% 2.22%
Asia 1.47% 1.17% 0.51% 5.19% 4.27% 1.80%
-China 0.26% 0.91% -0.02% 8.51% 6.73% 1.85%
Africa 2.08% -1.39% -0.14% 4.51% 0.40% 5.32%
Oceania 2.26% 4.86% -3.86% -2.17% 6.02% -4.14%
FSU -0.67 o/o -1.27 o/o -1.66% 3.02% 0.40% 0.02%
I
WORLDII
0.33 o/oI
0.76 °/oI
-0.58 o/oII
3.63%I
2.56 o/oI
1.30 o/oI
Annual rate of growth (o/o)
WHEAT Production Consumption
Region 1961-72 1972-83 1983-94 1961-72 1972-83 1983-94
Europe 4.37% 2.14% 1.34% 2.39% 0.91% 1.00%
-EU 3.92% 2.59% 1.61% 1.78% 0.87% 1.50%
North America 2.91% 4.55% -0.61% 2.64% 2.56% 1.47%
-U.S' 2.08% 4.16% -0.38% 2.81% 2.82% 1.34%
Latin America 1.41% 5.67% 0.15% 3.44% 3.30% 1.42%
Asia 6.73% 5.49% 2.33% 5.46% 5.00% 2.73%
-China 8.79% 7.70% 1.82% 5.57% 7.55% 2.64%
Africa 6.68% -1.00% 5.17% 4.78% 5.31% 2.15%
Oceania 0.03% 11.17% -7.84% 4.26% -0.48% 1.87%
FSU 2.33% -0.87% -1.64% 4.00% -0.42% -1.22%
I
WORLDII
3.96 o/oI
3.34 o/oI
0.72 o/oII
3.81 o/oI
2.65 o/oI
1.43 °/oI
Source: VJ-A2 calculation on the basis of FAO, USDA data.
Note: Europe and Asia exclude their respective F.S'U parts. North America consists of the US and Canada.
300
250
r-..
i
.! 225 ~~
150
~!#ns
·.··· -:-.-:- ·.·.·.·...
··-·.·
·-:-·--:-:-:-:-:-:-: :-·-·-: ..
:-::-:-:-:-:- =:-:::: ::=:::
tt ~~t~ ::::::= ~r~
11l_i __
:_l_.!_I_J. : : : : - ; ::~1:::
·.·.·.· ::.::: .. ::::: ==·==== :::;:~: ~{:~ ~I{
:-:-:-: .... ::::::. }~~
!world wheat area and yield, 1961-95 I
:::::.: .... :;.:-:: :-:-.· .:::::·
-:-:-:-:-:-:-: · .. ·.- -:-::
:-:-:-:-:-:-:-1961 1963 1965 1967 1969 1971 1973 1975 1977 1979 1981 1983 1985 1987 1989 1991
I Note: AIN on left-hand •xis, yi•ld on tight-hand uisl c:::1 Area e Yield
2.5
1993 1995
Graph A1: Despite annual variations, world wheat area has been declining since the early 1980s, while the annual rate of wheat yield growth has slowed down.
!world wheat production and consumption, 1961-95 I
700
600
500
..
I
400~
300
200
100
1961 1963 1965 1967 1969 1971 1973 1975 1977 1979 1991 1983 1985 1987 1989 1991 1993 1995
I•
Production o Consumption!8 1i
!
300 250 200 150 100 501961 1963 1965 1987 1969 1971 1973
j! Area • Yield
World wheat growth, 1961-95
( 1961 •100,
1975 1977 1979 1991 1983 1985
• Production + Consumption • Population
1987 1989 1991 1993 1995
Graph A3: World wheat production and consumption grew faster than world population since 1961. However, In recent years both production and consumption
of wheat have stagnated.
420
350
280
:
~ 210
~
140
n -~ ~I~j
1961
I
World wheat stocks and prices, 1961-95 J~~ ~ ~ITh;~
"=«·
=:·,· ... ,::,·,·:':,···., = :::::: L--:::::::
:
.. ::'·:::::,::::: .. ,::::::·: .. :::.::::::: .;.;.;, .:.:;:;
I
Ill
·.ii;r ..=.rl:l::•·l,!.l:•··~,.•i
,1:•:,: •. :! • =,.1:·,•:•·:' =:•·!,:!,1, •. ,1
=··:·,•·•:1:1::
i
11:11· :·:·:·
\
(~
s
I
F:::::=: ::::::
II
TI' =·
;:
II
II
l:l~lil
7I
ill
I
w
I
II
~r
I
I
II
I
I
i
:: :::A
~I
\_/
]:
;.;.·.... '::::::s
l·.·i ...
·l.l .•.·.~
•. i.l .. l •.•.:-:····
1963 1965 1987 1989 1971 1973 1975 1977 1979 1991 1983 1985 1997 1989 1991 1993 1995
G:;:J Wortd enclng stocks + US wheal export price (HW 2)
Note: stocb on ld-hand u/6, ptictu on tiglrt-hllnd ax/6
Graph A4: This situation, coupled with major policy changes In recent years, has led to declining stocks and soaring prices.
240
200
160
120 ...
120
100
80
60
40
20
1961 1963 1965 1967 1969 1971 1973
Asia -v- FSU + El6ope
VVheatarea,1961-95
( main regions )
1975 1977 1979 1981 1983 1985
-& North Amenca ~ Latin America .r;; Africa
1987 1989 1991 1993 1995
-b: Oceania
Graph A5: While wheat area has been increasing in Asia, it has been constantly declining in the FSU. North American wheat area has seen strong annual fluctuations, while the rest of the world exhibits more steady patterns.
VVheatarea,1961-95
( China and main cereal exporters )
50
40
30
20
10
1961 1963 1965 1967 1969 1971 1973 1975 1977 1979 1981 1983 1985 1987 1989 1991 1993 1995
fk China * EU ~ us • Canada :Y. Australa u Argemna
Graph A6: China's wheat area had been on an upward trend, but has recently stabilised. US wheat area fluctuates more than any other major exporter's in response
1961 1963 1965 1967 1969 1971 1873
• Asia . . FSU
Wheat yields, 1961-95
( main regions )
1975 1977 1979 1961
-+ Cemal Europe • Africa
1983 1985 1967 1989 1891 1983 1895
• Latin America
Graph .11: Asian, African and Latin American wheat yields have been growing at slow but relatively steady pace. Central European yields collapsed in the early 1990s but have started recovering recently, while FSU yields are still on the deeline.
Wheat yields, 1961-95
( China and main cereal exporters )
1961 1963 1965 1967 1969 1971 1973 1975 1977 1979 1981 1983 1985 1987 1989 1991 1993 1995
-o- China * EU +us • Canada Q Argentina '9-Australia
Graph AB: EU wheat yields have been growing stronger than yields of any other major exporter, and are two-fold high~r than North American yields. However, the
1961 1963 1965 1967 1969 1971 1973
Asia -"" FSU + E"ope
Wheat production, 1961..g5
( main regions )
1975 1977 1979 1981 1983 1985
-0 North America ~ Latin America .s;. Africa
1987 1989 1991 1993 1995
-t:r Oceania
Graph A9: Wheat production in Asia has been growing fast, due to both area and yield growth. In Europe, high yield growth turned the region into a net exporter. North America wheat production fluctuates significantly, while FSU wheat productiun is on the decline.
Wheat production, 1961..g5
( China and main cereal exporters )
150
125
100
75
50
25
1881 1983 1985 1967 1969 1971 1973 1975 1877 1879 1981 1983 1985 1987 1999 1991 1993 1995
~ China * EU .. us • Canada v-Australia n Argentina
300
250
200
100
50
Wheat consumption, 1961-95
( main regions )
: : : : : : ;;;:: ; : : : =:: '
1961 1963 1965 1967 1969 1971 1973 1975 1977 1979 1981 1993 1995
Asia _,. FSU -+ Europe -& North America ~ latin America -9- Africa
1967 1989 1981 1993 1995
-b: Oceania
Graph A11: Wheat consumption has been growing very fast in Asia, but its pace has slowed down In recent years. Wheat consumption growth has been modest elsewhere except in the FSU, where it declined dramatically after 1110.
150
125
100
75
50
25
1961 1963 1965 1967 1969 1971 1973
-tr China * EU
Wheat consumption, 1961-95
( China and main cereal exporters )
1975 1977 1978 1981 1983
... us • Canada JQL Australia
1985 1987 1988 1991 1993 1995
e Argentina
300
250
200
J
!150
~
100
50
"'*Asia + EIM"OJ)e
Wheat per capita consumption, 1961-95
( main regions excluding the FSU )
o North America ~ Latin America s;r Africa
Graph A 13: Per capita wheat consumption Is modestly increasing in all regions of the world. except the FSU.
'i .!
425
375
325
l 275
~
225
175
125
1961 1963 1965 1967 1969
-+ Europe
1971
Wheat per capita consumption, 1961-95
( Europe and the FSU )
1973 1875 1977 1879 1981 1983
* EU e .Central Europe • FSU
~ Oceania
1995 1997 1999 1991 1993 1995
European Commision
Directorate General for Agriculture (DG
VI)Working document
The Outlook of World Cereal Markets
Annex B. - Coarse Grains
(1961-1995)
Annex table lb. Annual growth rates in coarse grains, 1961-94.
Annual rate of growth (%)
C. GRAINS Area Yield
Region 1961-72 1972-83 1983-94 1961-72 1972-83 1983-94
Europe -0.19% -0.45% -1.44% 4.03% 1.37% 0.42%
-EU 0.54% -0.46% -2.38% 3.71% 0.96% 2.19%
North America -0.33% -1.42% 0.81% 4.11% -0.85% 5.42%
- US' -1.08% -1.41 % 1.20% 4.42% -1.15% 5.61%
Latin America 2.42% 0.08% 0.40% 1.83% 2.40% 2.32%
Asia -0.55% 0.10% -0.80% 2.02% 4.18% 2.35%
-China -0.39% -1.20% -0.52% 2.84% 6.24% 2.71%
Mrica 0.13% 2.46% 0.46% 0.48% -0.62% 2.40%
Oceania 4.26% 3.52% -3.11 % 0.06% 5.06% -2.29%
FSU 0.15 °/o 1.23% -1.69% 1.60% 1.89% 0.57%
I
WORLDII
0.06 o/oI
0.43%I
-0.51%II
2.88%I
0.77 o/oI
2.73%I
Annual rate of growth (o/o)
C. GRAINS Production Consumption
Region 1961-72 1972-83 1983-94 1961-72 1972-83 1983-94
Europe 3.83% 0.91% -1.03% 3.42% 0.47% -2.06%
- EU 4.28% 0.49% -0.24% 3.42% 0.05% -2.06%
North America 3.76% -2.25% 6.27% 2.64% -0.39% 2.78%
-US' 3.29% -2.54% 6.88% 2.29% -0.48% 2.99%
Latin America 4.29% 2.49% 2.73% 4.30% 3.33% 3.68%
Asia 1.46% 4.28% 1.54% 3.47% 4.43% 2.16%
-China 2.44% 4.96% 2.18% 4.36% 4.30% 2.86%
Mrica 0.61% 1.82% 2.87% 1.51% 2.87% 2.84%
Oceania 4.32% 8.76% -5.32% 5.65% 0.95% 2.90%
FSU 1.75 o/o 3.13% -1.13 % 3.16% 3.19 o/o -1.90 o/o
I
WORLDII
2.94 o/oI
1.20 o/oI
2.21 o/oII
3.09 o/oI
1.84%I
1.15%I
Source: VI-A2 calculation on the basis of FAD, US'DA data.