On the phase space structure of IP3 induced Ca
2+
signalling and concepts for
predictive modeling
Martin Falcke, Mahsa Moein, Agne Tilūnaitė, Rüdiger Thul, and Alexander Skupin
Citation: Chaos 28, 045115 (2018); doi: 10.1063/1.5021073
View online: https://doi.org/10.1063/1.5021073
View Table of Contents: http://aip.scitation.org/toc/cha/28/4
On the phase space structure of IP
3induced Ca
21signalling and concepts
for predictive modeling
MartinFalcke,1,a)MahsaMoein,2,b)AgneTilunait e,_ 3,c)R€udigerThul,4,d)
and AlexanderSkupin2,5,e) 1
Max Delbruck Centre for Molecular Medicine, Robert R€ ossler Strasse 10, 13125 Berlin, Germany€
and Department of Physics, Humboldt University, Newtonstr. 15, 12489 Berlin, Germany 2
Luxembourg Centre for Systems Biomedicine, University of Luxembourg, 7, Rue de Swing, Belval L-4367, Luxembourg
3
Systems Biology Laboratory, School of Mathematics and Statistics, University of Melbourne, Parkville, Victoria 3010, Australia
4
Centre for Mathematical Medicine and Biology, School of Mathematical Sciences, University of Nottingham, Nottingham NG7 2RD, United Kingdom
5
National Biomedical Computation Resource, University California San Diego, 9500 Gilman Drive, La Jolla, California 93121, USA
(Received 31 December 2017; accepted 12 March 2018; published online 13 April 2018)
The correspondence between mathematical structures and experimental systems is the basis of the generalizability of results found with specific systems and is the basis of the predictive power of theoretical physics. While physicists have confidence in this correspondence, it is less recognized in cellular biophysics. On the one hand, the complex organization of cellular dynamics involving a plethora of interacting molecules and the basic observation of cell variability seem to question its possibility. The practical difficulties of deriving the equations describing cellular behaviour from first principles support these doubts. On the other hand, ignoring such a correspondence would severely limit the possibility of predictive quantitative theory in biophysics. Additionally, the existence of functional modules (like pathways) across cell types suggests also the existence of mathematical structures with comparable universality. Only a few cellular systems have been sufficiently investigated in a variety of cell types to follow up these basic questions. IP3induced Ca2þsignalling
is one of them, and the mathematical structure corresponding to it is subject of ongoing discussion. We review the system’s general properties observed in a variety of cell types. They are captured by a reaction diffusion system. We discuss the phase space structure of its local dynamics. The spiking regime corresponds to noisy excitability. Models focussing on different aspects can be derived starting from this phase space structure. We discuss how the initial assumptions on the set of stochastic variables and phase space structure shape the predictions of parameter dependencies of the mathematical models resulting from the derivation.VC 2018 Author(s). All article content, except
where otherwise noted, is licensed under a Creative Commons Attribution (CC BY) license (http:// creativecommons.org/licenses/by/4.0/).https://doi.org/10.1063/1.5021073
IP3induced Ca2þsignalling is one of the most versatile
and universal cellular signalling systems and a popular model system in non-linear dynamics for pattern forma-tion in noisy systems. We discuss the experimental evi-dence allowing for identification of the mathematical structure to which it corresponds, and a variety of con-cepts for deriving simplified models from it.
I. INTRODUCTION
In spring 1995, I (MF) joined John (Jack) L. Hudson’s lab in Charlottesville, Virginia, to work with him on dynamic clustering of globally coupled non-linear oscillators or a topic from pattern formation far from thermodynamic equilibrium.
James D. Lechleiter and Patricia Camacho were in Charlottesville at this time, too. James had just published his results on the effect of energizing mitochondria on Ca2þ waves in Xenopus oocytes,1which had several aspects very interesting for the theory of pattern formation. According to that theory, free ends of waves in excitable systems should either form a spiral or recede. The free ends of Ca2þwaves with energized mitochondria neither formed spirals nor receded but showed different dynamics. Jack suggested work-ing on these patterns. This was my first biophysical project and it redirected my career. Jack worked experimentally and developed also the mathematical models explaining his experiments. His high standards and expectations towards theory close to experiments substantially influenced all of my later scientific and educational work.
The first years of this biophysical research led to results on spiral instabilities, spiral pattern regimes, and generation and annihilation dynamics,2but could not explain Lechleiter’s experiments. The underlying mathematical structure of the model did not correspond to the experimental system. When
a)
Electronic mail: [email protected]
b)
Electronic mail: [email protected]
c)Electronic mail: [email protected] d)Electronic mail: [email protected] e)
Electronic mail: [email protected]
we replaced the model with a direct transition from excit-ability to an oscillatory regime by a model with a direct transition from excitability to bistability,3 it explained not only the mitochondria experiments4 but also experiments which were not taken into account when it was developed.5 This exemplifies how the basic mathematical structure of a non-linear dynamical system defined by its set of bifurca-tions and their relation, often called the bifurcation diagram and phase space structure, is essential for the predictive power of a theoretical description.
In physics, the fundamental equations like Newton’s first law, the variational principles of classical mechanics, or the Schr€odinger equation of quantum mechanics have been devel-oped with simple examples. Nonetheless, they are stunningly predictive far beyond the systems used in their formulation. This predictive power originates from a correspondence between the experimental objects and mathematical structures. The mechanics of macroscopic objects corresponds to varia-tional principles and differential equations, and the behaviour of microscopic objects corresponds to operator theory in Hilbert spaces. The identification of the correct mathematical structure corresponding to an observation provides predictive power to a mathematical theory in science. Mathematical mod-els formulated within mathematical structures not correspond-ing to the observations still may reproduce the measurements used for their development but rarely are predictive beyond them as illustrated by the history of atom models.
In general, the biophysics of cells has to obey the basic laws of physics—the first principles. But cells consist of many components and interactions and therefore specifying the fundamental equations of physics to a living cell is close to impracticable. The approach of theoretical biophysics is consequently to consider the components and interactions assumed to be most relevant for a specific process of interest and to verify the assumptions retrospectively by contrasting model predictions with experimental results. But does the lack of models derived from first principles for cellular behavior also mean that the correspondence of mathematical structures to observations has no meaning in cellular biophys-ics? The predictive power growing out of it makes it worth to follow up on this only seemingly philosophical question.
Only a few cellular dynamical systems are currently characterized well enough for identifying the mathematical structure corresponding to them. Intracellular Ca2þdynamics is one of them. The Ca2þ pathway translates extracellular signals into intracellular responses by increasing the cyto-solic Ca2þconcentration in a stimulus dependent pattern.6–8 The concentration increase can be caused either by Ca2þ entry from the extracellular medium through plasma mem-brane channels or by Ca2þ release from internal storage compartments. In the following, we will focus on inositol 1,4,5-trisphosphate (IP3)-induced Ca
2þ release from the
endoplasmic reticulum (ER), which is the predominant Ca2þ release mechanism in many cell types. IP3 sensitizes Ca
2þ
channels (IP3Rs) on the ER membrane for Ca
2þ binding,
such that Ca2þ released from the ER through one channel increases the open probability of neighboring channels. This positive feedback of Ca2þ on its own release channel is called Ca2þ-induced-Ca2þ-release (CICR). Opening of an
IP3R triggers a Ca
2þflux into the cytosol due to the large
con-centration differences between the two compartments, which is in the range of 3–4 orders of magnitude. The released Ca2þ is removed from the cytosol either by sarco-endoplasmic reticulum Ca2þATPases (SERCAs) into the ER or by plasma membrane Ca2þATPases into the extracellular space.
IP3Rs are spatially organized into clusters of up to about
fifteen channels. These clusters are scattered across the ER membrane with distances of 1–7lm.9–13CICR and Ca2þ dif-fusion couple the state dynamics of the channels. Given that the diffusion length of free Ca2þis less than 2lm due to the presence of Ca2þ binding molecules in the cytoplasm and SERCAs, the coupling between channels in a cluster is much stronger than the coupling between adjacent clusters.14 The structural hierarchy of IP3Rs from the single channel to
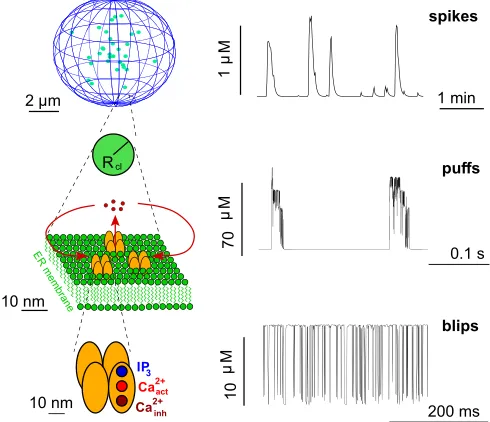
clus-ters shown in Fig.1is also reflected in the dynamic responses of the intracellular Ca2þ concentration as revealed through fluorescence microscopy and simulations.9,15–17Openings of single IP3Rs (blips) may trigger collective openings of IP3R
within a cluster (puffs), while Ca2þdiffusing from a puff site can then activate neighboring clusters, eventually leading to a global, i.e., cell wide, Ca2þspike.13,16,18,19Repetitive sequen-ces of these Ca2þspikes encode information that is used to regulate many processes in various cell types.6,20,21
[image:3.612.315.560.428.639.2]Ca2þ exerts also a negative feedback on the channel open probability, which acts on a slower time scale than the positive feedback, and has a higher half maximum value than CICR.9,15,18,22–24 This Ca2þ-dependent negative feedback helps terminating puffs, and therefore the puff probability
FIG. 1. Hierarchical organization of IP3induced Ca2þsignalling with
con-centration signals of the corresponding structural level. The elementary build-ing block is the IP3R channel (bottom). It opens and closes stochastically. An
open channel entails Ca2þrelease into the cytosol due to the large concentra-tion difference between the ER and the cytosol. Since channels are clustered, opening of a single channel, which is called a blip, leads to activation of other channels in the cluster, i.e., a puff (middle). The cluster corresponds to a region with Ca2þrelease with a radius Rclthat is fixed by the number of open channels. The stochastic local events are orchestrated by diffusion and CICR into cell wide Ca2þ waves, which form the spikes on cell level (top). Reprinted with permission from A. Skupin, H. Kettenmann, and M. Falcke, PLoS Comput. Biol. 6, e1000870 (2010). Copyright 2010 ICSB.36
immediately after a puff is smaller than the stationary value but typically not 0. Channel clusters recover within a few sec-onds to the stationary puff probability.9,15,18,22–24
The negative feedback terminating release spikes causes an absoluterefractory period Tmin as part of the interspike
intervals (ISIs) lasting tens of seconds.25–27 The molecular mechanism of this feedback is pathway and cell type specific and not always known although a negative feedback on the IP3 concentration might be involved.28,29 Hence, the
nega-tive feedback that determines the time scale of interspike intervals is different from the feedback contributing to inter-puff intervals and requires global (whole cell) release events. At very strong stimulation, cells exhibit a raised Ca2þ concentration of much longer duration than spikes which may oscillate,30,31 burst,32,33 or is rather constant.1,34,35 Typically, the amplitude of these oscillations is smaller than the spike amplitude. In the following, we review our current understanding of experimental results on Ca2þsignaling and how it illustrates the relation between mathematical structures and observations in biophysics.
II. EXPERIMENTAL RESULTS ON THE PHASE SPACE STRUCTURE AND DYNAMICAL PROPERTIES OF IP3
INDUCED Ca21RELEASE
The pathway exhibits local Ca2þrelease through individ-ual channel clusters at low [IP3], spiking at intermediate [IP3]
and an elevated cytosolic [Ca2þ]iat high [IP3]. A basic
obser-vation in all experiments is that cell-to-cell variability with respect to Ca2þspiking behavior is large but not completely arbitrary. It obeys some preserved characteristics, which have been confirmed for all cell types in which they have been investigated. We will focus on these general characteristics since they obviously reflect essential system properties.
It is convenient for the presentation of experimental results to introduce also a few mathematical concepts. In math-ematical terms, intracellular Ca2þ dynamics are described by reaction-diffusion equations like
@X
@t ¼DDXþFðX;~r;t;pÞ; (1)
whereXis a vector of concentrations,tis time,~ris the space coordinate,Dis a diagonal diffusion matrix, D the Laplace operator, FðÞ is a non-linear function describing the local dynamics, andpis a vector of parameters.Xcomprises free cytosolic Ca2þ, Ca2þbound to Ca2þ-binding molecules, IP3,
and free and bound Ca2þin the lumen of the ER and mito-chondria in a rather general formulation of the dynamics.
In general, non-linear dynamics reaches asymptotically attractors in phase space which may be stationary states or manifolds of higher dimension. Attractors with higher dimension like limit cycles, tori, or even chaotic attractors potentially describe the Ca2þspiking behaviour. They may be caused by the dynamics of spatial modes [eigenfunctions of the linearized rhs of Eq.(1)] or by the local dynamics,37 i.e., may occur withDX0 also. Spatial modes have been observed with the Ca2þdynamics of excitation contraction coupling in cardiac myocytes,38,39 which is a driven system in terms of dynamical systems theory. However, there is no
experimental evidence for attractors of the autonomous and/ or IP3induced intracellular Ca2þdynamics caused by spatial
modes, and hence we can focus on properties of the local dynamics.
The local dynamics of Eq.(1)are the behaviour of the IP3R clusters. The majority of the modelling literature
assumes oscillatory local dynamics in the spiking regime since measured spikes are repetitive. Indeed, spike sequences even with a CV of 0.3–0.4 of the ISI appear surprisingly reg-ular in visual inspection. However, a closer look could not confirm this assumption.24,40
Clusters are dynamically coupled by Ca2þ diffusion, which needs to be reduced for investigations focussing on the local dynamics. Such an uncoupling can be achieved by high intracellular concentrations of the Ca2þ buffer EGTA. The elemental event of the local dynamics is the stochastic open-ing of channels in a cluster. The first open channel entails with some probability opening of more channels in the cluster causing a puff. Puffs last typically a few tens of ms but with large scatter.13,41The probability of triggering calcium puffs is linearly related to the number of IP3R in a cluster.
42
Puff sequences at a given cluster exhibit some correlation between amplitude and subsequent interpuff intervals, a weak correla-tion between interpuff intervals and subsequent amplitude, but no detectable correlation between consecutive ampli-tudes.41Both puff amplitude and frequency increase and satu-rate with increasing stimulation of cells.42
Typical interpuff intervals last a few seconds,13,24,41,42 and interspike intervals are in the range from about 20 s to a few minutes. If the local dynamics were oscillatory and caused the sequence of spikes, the time scale of the ISI should be detectable as a temporal modulation of properties of the puff sequence at a given site. That has not been found.24 A modulation of puff sequences on the ISI time scale could not be detected and no evidence of an oscillatory regime of the local dynamics has been observed.24 The ISI time scale has only been observed on cell level. Consequently, spikes are a collective phenomenon requiring coupling of clusters. Another set of experiments demonstrated that indeed the aver-age ISI depends sensitively on the intracellular buffer concen-tration modulating the strength of spatial coupling.40 This confirms the results of the analysis of the local dynamics.
These experimental results are supported by theoretical investigations. The Ca2þconcentration at closed clusters is the resting concentration in the range of100 nM. Detailed simu-lations of the concentration dynamics in the immediate vicinity of channels14showed that concentrations at open channels are high (>20lM). The dynamic range of the regulatory binding sites for both the positive and negative feedback of Ca2þto the open probability ranges from a few hundred nM to micromolar values below 10lM.43–45 Oscillatory dynamics require con-centration values in the dynamic range. However, with these large concentration changes, the system essentially never is in this dynamic range and the regime of the deterministic limit of the cluster dynamics is either excitable or bistable (except tiny parameter ranges).17
manner. Waves occur if a critical number of releasing clusters is reached.16,46,47The randomness of puffs causes randomness of spike timing with a linear relation between the standard deviationrof interspike intervals and the average Tav
r¼aðTavTminÞ (2)
as shown in Fig.2and further for 8 cell types and 10 condi-tions27,40,48–50(see also Ref.51). The slopeaof this relation between SD and average is the same for all cells of the same type stimulated with the same agonist27,40,48,49,52and robust against changes in stimulation strength,27 pharmacological perturbations,27 changes in buffering conditions,40 and the large cell variability. It has been verified even in cells not exhibiting clustering of channels and puffs.49 Values of a
are, for example, about 0.2 for hepatocytes stimulated with vasopressin, 0.25 for human embryonic kidney (HEK) cells stimulated with carbamyl choline (CCh), 0.37 for hepatocytes stimulated with phenylephrine,270.7 for processed lipoaspirate (PLA) cells,52and close to 1 for spontaneously spiking astro-cytes.40 Consequently, the standard deviation is of the same order of magnitude as the average ISI.
The standard deviation of ISI of oscillatory systems moving on a limit cycle in phase space and perturbed by noise is typically smaller than the values measured for Ca2þ spiking,53 and/or the cumulant relation may exhibit a nega-tive slope.53Varying parameter values across the range cov-ered by cell variability and the perturbations applied in two studies27,40 cause loss of a unique relation between r and Tav53with these oscillatory systems since the period and the
noise causing the standard deviation are determined by dif-ferent processes. Thus the robustness ofaagainst cell vari-ability and perturbations can hardly be reconciled with an oscillatory dynamics since all these parameter variations
against whichais robust would need to affect the processes setting the average and the processes setting the SD in exactly the way conserving the CV. But since spike generation is sto-chastic, the parameters control only the spike generation probability, and the type of stochastic process—e.g., inhomo-geneous Poisson—fixes the relation between Tavandr.
54
The second parameter of Eq.(2), the absolute refractory period Tmin, was also found to be the same for all individual
cells of the same type stimulated with the same agonist.27,40 When Tminhas passed, the puff probability recovers from 0
gradually to its asymptotic value. This slow recovery delays initiation of the next spike. That spike may occur during recovery, if the asymptotic spike generation probability is large compared to the recovery rate, or after recovery in the opposite case. The contribution of this stochastic part of the ISI to the total average ISI has been thoroughly investigated and is well known. It contributes typically 40%–70% to the total average ISI, and the measured range is from 8% to 95% contribution.27,40,48–50The recovery reduces also the SD (of the stochastic part) of the ISI.27,40,48–50The slower the recov-ery, the smaller is the ratio of SD to average ISI (coefficient of variation CV).54
The wave-nucleation like generation of global release spikes as well as the ISI statistics strongly suggests excitabil-ity as the dynamic regime of IP3 induced Ca
2þ spiking in
agreement with the analysis of the local dynamics. Excitable systems exhibit a stationary state which is stable against small perturbations. Perturbations above the excitation threshold are amplified to a transition to the excited state. The stochastic behavior of channel clusters causes incidental local transitions to the excited state, which then spreads with some probability into the whole cell. The resulting large fraction of open clusters—i.e., a release spike—causing a high Ca2þconcentration and high open probability are the excited state of Ca2þdynamics. This state is terminated by negative feedback acting on a slower time scale than the excitation. The probability for generating this supercritical local excitation fixes the average stochastic part TavTmin
and the standard deviationr.
The complete distribution of ISI cannot be easily deter-mined from experimental data since measured spike trains are not longer than about 60 ISI. Fusion of ISI sequences normalised by Tav have been used as a surrogate data set
and led to skewed distributions with an absolute refractory period.55 More sophisticated methods based on the time rescaling theorem and Kolmogorov-Smirnov tests for com-parison of measured and hypothetical distributions identified an inhomogeneous Gamma distribution as the most likely experimental ISI distribution with time dependent stimu-lus.56 Distributions of ISI obtained with these methods and constant stimulation are shown in Fig.3.
The response of the average ISI to stimulation with extracellular agonists has features applying to all of the four plasma membrane receptors for which it has been investi-gated.27 On that basis, we assume them also to be general features of the system. Tminis not affected by stimulation, as
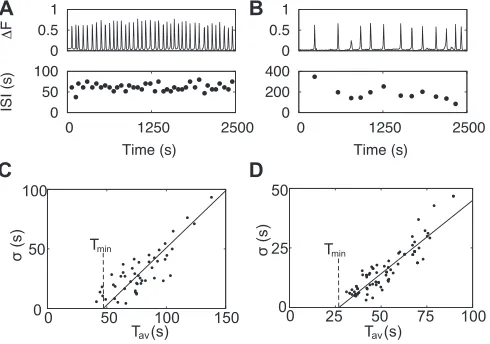
[image:5.612.53.298.479.651.2]we have learned from the robustness properties of Eq. (2), already. Stimulation controls the average stochastic part TavTmin of the ISI. The concentration response has been FIG. 2. Variability in Ca2þsignals. (a) The transient cytosolic Ca2þ
concen-tration of an astrocyte stimulated with 10lM adenosintriphosphat (ATP) (upper panel) exhibits some variability as indicated by the variable individual ISIs (lower panel). (b) An astrocyte of the same experiments shows slower and more irregular spiking illustrating cell-to-cell variability. (c) The systematic analysis of the standard deviationrof ISI versus the average ISI Tavfor HeLa
cells stimulated with 100lM histamine reveals a linear dependence in accor-dance with the moment relation(2)where each data point corresponds to the characteristic of an individual cell. (d) Ther-Tavrelation of astrocytes
stimu-lated with 10lM ATP exhibits also a linear dependence with a different slope than HeLa cells. TavTminis the average stochastic part of the ISI.
established by applying steps in the concentrationa of the stimulating agonist.27 The change of the average stochastic part of the ISI due to this concentration step is proportional to the average stochastic part at the lower agonist concentra-tion Tav1(Ref.27)
DTav¼bðTav1TminÞ: (3)
Analysis of measurements revealed thatb does not depend on the agonist concentration,27which entails an exponential dependency ona
Tav¼Trefst e
cðaarefÞ
þTmin: (4)
Trefst is the average stochastic part measured at the reference concentration aref. This prefactor of the exponential is cell specific and picks up all the cell variability. The constantc
in the exponent is the same for all cells of a given cell type stimulated with the same agonist. Equation(4)does not bear directly information on the dynamic regime of IP3induced
Ca2þspiking, but it defines clear constraints to its theory.
III. BASIC REQUIREMENTS AND CONCEPTS FOR MODELLING OF IP3INDUCED INTRACELLULAR
Ca21DYNAMICS
A comprehensive monograph reviewing modelling of intracellular Ca2þ dynamics has recently been published.57 Here, we would like to fill a void in the literature by a critical reflection on the framework of model derivation and the approximations coming with modelling concepts used in the biophysical literature.
The essence of the system is defined by its general prop-erties, which are also the basic requirements models should meet:
• The sequence of dynamic regimes with increasing
stimula-tion: puffs, spikes, permanently elevated Ca2þ. Pathway dependent also a bursting regime may follow or replace the spiking regime.
• The dynamics of individual clusters are not oscillatory on the time scale of ISI.
• Cell-to-cell variability of average ISI is large.
• The spiking regime obeys Eqs.(2),(3), and(4)with Tmin,
a, andcbeing cell type and pathway specific but not sub-jected to cell variability.58
• ISIs depend sensitively on parameters of spatial coupling.
The high stimulation regime is not in this list since the behavior is cell type dependent—it might be stationary or oscillatory.
The hierarchical organization of CICR carries the ran-domness of individual channels onto the level of cell-wide spikes via the stochastic puff dynamics of clusters (Fig. 1). The random channel state changes are the source of noise. Consequently, the master equation for the probability of the microscopic states of the system is the starting point for an exact theory. In the most general case, that would comprise the position and number of Ca2þions and Ca2þbinding mol-ecules and the state of the channels and pumps. While the master equation as the starting point for a theory defines con-cepts and methods to be used, solving it is not practical in the end. Hence, probabilistic theories usually start from for-mulations of the state dynamics eligible for simulating tra-jectories in phase space.
A. Simulations
The diffusion coefficients of Ca2þ and Ca2þ binding molecules are sufficiently large to establish the deterministic concentration profile on the time scale of typical channel state changes due to the frequent sampling of space by ther-mal motion. The number of SERCA molecules is orders of magnitude larger than the number of Ca2þchannels. Hence, we can describe diffusion, the reactions involving cytosolic Ca2þbinding molecules, and the SERCA flux by reaction-diffusion equations like Eq. (1). The random opening and closing of channels causes time dependent source terms in the partial differential equation for the Ca2þ concentration. We illustrate that with a simple model comprising cytosolic Ca2þc, one Ca2þ bufferb (Ca2þ bound form), and the ER Ca2þconcentratione
@c
@t¼DcDcþ
XN
i¼1
X1
j¼1
Ai;jðc;eÞdðtti;jÞdð~r~riÞ
Vp c2
K2þc2þPlðecÞ k
þð
btbÞcþkb; (5)
@e
@t ¼DeDe
XNp
i¼1
X1
j¼1
Ai;jðc;eÞdðtti;jÞdð~r~riÞ 2
4
þVp c2
K2þc2PlðecÞ
3
5; (6)
@b
@t ¼DbDbþk þð
btbÞckb: (7)
Here,btdenotes the total buffer concentration,kþandk–the
binding and dissociation rate, Vp is the maximum SERCA
pump flux, andthe ratio of cytosol to ER volume. We have approximated the shape of a channel mouth by a spatial
[image:6.612.76.275.56.203.2]d-function and the time course of a single opening by a
temporald-function. N is the number of channels,~ri is the
location of theith channel, andf gti;j the sequence of its
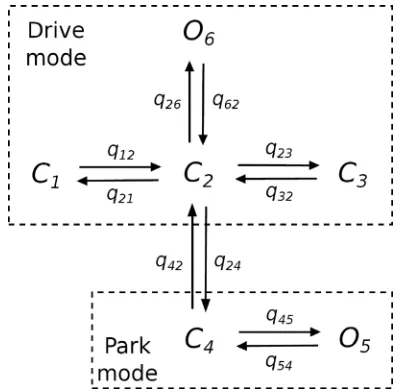
open-ings before timet. The sequence of time points of openings is determined by Markov chain Monte Carlo simulations for the state of each individual channel. The simulations are based on state schemes; an example is shown in Fig. 4. Such an approach has been used both for single clusters as well as cell-wide cluster arrays.19,53,59–64
This type of simulations is well suited to investigate channel state schemes in cellular context, the role of particu-lar pathway components, or spatial aspects.19,53,59,62–64
B. Distributions and their moments
Probability distributions for stochastic variables are the natural way to characterize stochastic systems. They are the solutions of the master equation. However, we need to plify the system to obtain equations we can solve. These sim-plified systems can be informed by the general properties listed above. We know about the ISI distribution that it should exhibit an absolute refractory period and a linear rela-tion between standard deviarela-tion and average.
The formulation of the problem in terms of Eq.(5) and Markov chains can also serve as starting point for analytical calculations or derivation of simplified models. The robust-ness of spike generation with respect to cell variability and perturbations demonstrates that it cannot depend on very specific parameter values or other details. Hence, simplifica-tions should not destroy the basic characteristics of the sys-tem. At the same time, the large cell variability entails requirements on the theory. With each experiment compris-ing a population of cells, we sample a phase space volume large enough for accommodating this cell variability. Hence, the qualitative properties of IP3 induced Ca2þ dynamics
listed above must not depend sensitively on the value of
parameters distinguishing individual cells. These parameters comprise protein concentrations,65 the number of clusters, their spatial arrangement, diffusion properties, and more.13
A suggestion for calculating the ISI distribution has been made in this spirit.54It starts from the wave nucleation char-acter of spike generation. All clusters are closed at the end of a spike. Each opening cluster entails a sphere of increased Ca2þconcentration around it. We indicate that by the orange spheres in the red round cells above scheme (8). The local rise in Ca2þincreases the open probability of the open clus-ter’s neighbours. A spike occurs when a critical numberNcr
of open clusters is reached via one of many possible paths of cluster openings. Hence, the ISI calculation can be formu-lated as a first passage problem from 0 to Ncropen clusters.
The first passage time distribution corresponds to the ISI dis-tribution for stationary spike trains. This approach radically simplifies the system into a state space defined by the number of open clusters only.54That implies averaging over all Npath
possible paths from 0 toNcropen clusters.54
(8)
The transition probabilities fromktokþ1 open clusters are determined by the probability that k open clusters open another one, and from kto k1 that a cluster closes. The transition probabilities Wi;k in state scheme (8) can be
directly calculated from interpuff interval and puff duration distributions.54 Such an approach is able to explain the cumulant relation Eq.(2).54
A lot remains to be done even with such a simple approach. The dependency of the transition probability on the numbers of open clusters and the parameters of spatial cou-pling has not been worked out analytically, yet. Also, the effect of the recovery from the negative feedback terminating spikes has not yet been described analytically in this approach but with phenomenologicalAnsatze€ or stochastic simulations only.40,53,55,66A new approach to this problem has been sug-gested recently but has not been specified to Ca2þ spiking, yet.67 Derivation of the concentration response relation Eq.
(4)with this approach has neither been attempted, yet.
C. Rate equations
[image:7.612.74.273.483.679.2]Rate equations for lumped variables might be desirable for simplified models and have been successfully used for investi-gating specific aspects of pathways or the dynamics.3,28,57,70–74 The derivation of rate equations implies averaging over the state distribution dynamics defined by the master equation. The
FIG. 4. This state scheme of the IP3R originally published by Siekmann et al.68is comprised of two modes. One is the drive mode containing three
closed states C1, C2, C3and one open state O6. The other is the park mode
which includes one closed state C4and one open state O5. The rates of
state-transitions within each mode are constants.aandbare the rates connecting the two modes and depend on Ca2þin a highly dynamic manner. Reprinted with permission from P. Cao, M. Falcke, and J. Sneyd, Biophys. J.112, 2138–2146 (2017). Copyright 2018 Elsevier.69
spatial character of spike initiation renders the averaging diffi-cult. Another (related) conceptual problem arises from the fact that the dynamics on cell level is still noisy. In contrast, the more frequent situation in the derivation of cellular dynamics encounters noise on the molecular level only. The population average carried out in the master equation of such systems dur-ing the derivation of rate equations is an average over the mole-cules in a single cell. The large number limit guaranteeing the validity of deterministic rate equations applies to the cell level. With IP3induced Ca
2þspiking, this limit does not apply to the
cell level since cell behavior is noisy. The average needs to be carried out across an ensemble of identical cells.
Consequences of these considerations can be illustrated by a comparison to existing rate equation models. We pre-pare this comparison by reconsidering the rate equation deri-vation of the most simple stochastic process—radioactive decay of atoms. The stochastic variable is the numberNaof
atoms. We denote the probability per unit time for decay of a single atom withk. The atom numberNaobeys for large
ini-tial numbersNithe exponential function Na¼Niekt. Each
decaying atom is in a stationary state till it decays, and there is no process setting the time point of its decay. However, if we ask for the timetrrequired till a specific number of atoms
Nrremains in the deterministic limit, it is set byNi,Nrandk
(tr¼k1lnðNi=NrÞ). The process setting the time scale is the
continuous decrease inNadown toNr.
Rate equation models derived by averaging on the molecular level and assuming deterministic behavior on cell level usually require specific processes to set the time scale of ISIs. That might be a rising fraction of channels recovered from inhibition, an approach to a critical Ca2þconcentration or the rise of receptor sensitization.57,74 However, the noisy behavior of Ca2þ spiking entails different determinants of the average ISI. Figure 5 illustrates some differences between the rate equations obtained by assuming determinis-tic cell behavior and noisy behavior on cell level. The time courses were obtained from simulations of a purely deter-ministic model75(black) and a noisy excitable version of it53 (red). Both systems respond with a spike to the perturbation. The noisy system generates subsequent spikes some time after the stimulated one [red line in Fig.5(a)]. The determin-istic rate equation model stays in a stationary state after the initial perturbation without generating a second spike [black line in Fig. 5(a)]. During the time Tdiv, the dynamics is
completely noise dominated. This illustrates that completely analogous to radioactive decay, there is no deterministic pro-cess on the level of the individual cell setting its ISI after recovery from the previous spike.
Spiking is lost in the rate equations since Tdivdiverges
due to averaging on the molecular level. Thus also the dependency of the ISI on the parameters characterizing the noise and spatial coupling is lost. Most rate equation models tune parameters to an oscillatory regime to establish spiking [Fig.5(b)]. The interspike interval is then dominated by the time required to reach the threshold for CICR. This entails parameter dependencies of the ISI different from the ones of noise driven dynamics.
The sketch of Tdiv for the excitable model in Fig.5(a)
applies when the asymptotic spike generation probability
reached after recovery is smaller than the recovery rate from negative feedback. The medium and long ISI data in Xenopus oocytes18 and spontaneously spiking astrocytes and microglia cells40,66 are experimental realizations. Their recovery phase from negative feedback is substantially shorter (a1) than the average ISI.40,66The effect of noise on time scales and parameter dependencies is also substantial if the recovery phase and the average ISI are of comparable length.27,40,66
In summary, averaging on the single cell level across molecules and clusters eliminates the noise generating the spike. The rate equations for this average do not reflect the spike generating mechanism since usually an oscillatory regime is then used to “rescue” spiking. However, averaging over a stochastic ensemble of cells defined by a cellular spike generation probability distribution allows for including the average of the noise generated time scale and its parame-ter dependencies, and can thus reflect the spike generation mechanism.
Deriving rate equations in a way reflecting the spike generation mechanism is an open problem and has not been attempted, yet. Suitable concepts might be inspired by the integrate-and-fire models of neuronal dynamics starting from an expression for the spike generation probability on cell level. Investigations on globally coupled noisy excitable systems might be specified to Ca2þ dynamics.76 Another very promising approach includes higher moments in the derivation.77
[image:8.612.330.551.59.261.2]Parameter dependencies and the mathematical structure of models can also be restricted by Eqs.(3)and(4). Stochastic simulations of the excitable regime of the frequently used DeYoung-Keizer-model reproduced Eq. (3) but not Eq. (4).
Hence, a comprehensive theoretical understanding of the con-centration response is still lacking.
IV. CONCLUSION
While detailed multiscale simulations can mimic experi-mental observations in a rather flexible manner,19,53,59–64 neither the current state of the stochastic theory nor the rate equation models live up to the request for predicting experi-mental outcome beyond the examples used for model deriva-tion. This indicates that we have not yet understood how to derive the appropriate models. Based on the accordance of experimental and multiscale simulation results, we come to the conclusion that a reaction diffusion system with a local dynamics in a noisy excitable regime must be the starting point of the derivation of predictive models since it is the mathematical structure corresponding to the observations.
IP3 induced Ca2þ dynamics is a classic of biological
applications of non-linear dynamics.57,78–80 On the basis of early interpretations of experimental results, it became one of the prototypical cellular limit cycle oscillators. The recent experimental results reviewed in this study revealed that the repetition of spikes is caused by noise instead of a limit cycle or torus in phase space. Derivation of predictive and simple models starting from this noisy spatially extended excitable system is a task reaching beyond the specific biological sys-tem. Hence, this classic still poses theoretical problems inter-esting and challenging for the whole field of nonlinear dynamics.
ACKNOWLEDGMENTS
A.S. was supported by the Fonds National de Recherche through the C14/BM/7975668/CaSCAD Project and by the National Biomedical Computation Resource (NBCR) through the NIH P41 GM103426 grant from the National Institutes of Health.
1L. Jouaville, F. Ichas, E. Holmuhamedov, P. Camacho, and J. Lechleiter,
“Synchronisation of calcium waves of mitochondrial substrates in
Xenopus laevisoocytes,”Nature377, 438–441 (1995).
2
M. Falcke, M. B€ar, J. Lechleiter, and J. Hudson, “Spiral breakup and defect dynamics in a model for intracellular Ca2þdynamics,”Physica D
129, 236–252 (1999).
3
M. Falcke, “Reading the patterns in living cells - the Physics of Ca2þ sig-naling,”Adv. Phys.53, 255–440 (2004).
4M. Falcke, J. Hudson, P. Camacho, and J. Lechleiter, “Impact of
mito-chondrial Ca2þcycling on pattern formation and stability,”Biophys. J.77, 37–44 (1999).
5M. Falcke, Y. Li, J. Lechleiter, and P. Camacho, “Modeling the
depen-dence of the period of intracellular Ca2þwaves on SERCA expression,” Biophys. J.85, 1474–1481 (2003).
6
M. Berridge, M. Bootman, and P. Lipp, “Calcium - a life and death sig-nal,”Nature395, 645–648 (1998).
7
C. Taylor, “Why do hormones stimulate Ca2þmobilization,”Biochem. Soc. Trans.23, 637–642 (1995).
8
G. Dupont, L. Combettes, G. S. Bird, and J. W. Putney, “Calcium oscil-lations,” inCold Spring Harbor, Perspectives in Biology(2011), p. 3.
9
M. Bootman, E. Niggli, M. Berridge, and P. Lipp, “Imaging the hierarchi-cal Ca2þsignalling in HeLa cells,”J. Physiol.499, 307–314 (1997).
10
I. F. Smith, S. M. Wiltgen, and I. Parker, “Localization of puff sites adja-cent to the plasma membrane: Functional and spatial characterization of Ca2þ signaling in SH-SY5Y cells utilizing membrane-permeant caged IP3,”Cell Calcium45, 65–76 (2009).
11
Taufiq-Ur-Rahman, A. Skupin, M. Falcke, and C. W. Taylor, “Clustering of InsP3receptors by InsP3retunes their regulation by InsP3and Ca2þ,”
Nature458, 655–659 (2009).
12W. Suhara, M. Kobayashi, H. Sagara, K. Hamadad, T. Goto, I. Fujimoto,
K. Torimitsu, and K. Mikoshiba, “Visualization of inositol 1,4,5-trisphos-phate receptor by atomic force microscopy,”Neurosci. Lett.391, 102–107 (2006).
13
M. V. Keebler and C. W. Taylor, “Endogenous signalling pathways and caged ip3 evoke Ca2þpuffs at the same abundant immobile intracellular sites,”J. Cell Sci.130, 3728–3739 (2017).
14
R. Thul and M. Falcke, “Release currents of IP3receptor channel clusters
and concentration profiles,”Biophys. J.86, 2660–2673 (2004).
15Y. Yao, J. Choi, and I. Parker, “Quantal puffs of intracellular Ca2þevoked
by inositol trisphosphate in Xenopus oocytes,”J. Physiol.482, 533–553 (1995).
16J. Marchant, N. Callamaras, and I. Parker, “Initiation of IP
3-mediated
Ca2þwaves in Xenopus oocytes,”EMBO J.18, 5285–5299 (1999).
17R. Thul and M. Falcke, “Stability of membrane bound reactions,”Phys.
Rev. Lett.93, 188103 (2004).
18
J. Marchant and I. Parker, “Role of elementary Ca2þpuffs in generating repetitive Ca2þoscillations,”EMBO J.20, 65–76 (2001).
19M. Falcke, “On the role of stochastic channel behavior in intracellular
Ca2þdynamics,”Biophys. J.84, 42–56 (2003).
20
H. Schulman, P. Hanson, and T. Meyer, “Decoding calcium signals by multifunctional cam kinase,”Cell Calcium13, 401–411 (1992).
21
W. Li, J. Llopis, M. Whitney, M. Zlokarnik, and R. Tsien, “Cell-permeant caged InsP3 ester shows that Ca2þspike frequency can optimize gene
expression,”Nature392, 936–941 (1998).
22
I. Parker, J. Choi, and Y. Yao, “Elementary events of InsP3-induced Ca2þ
liberation in Xenopus oocytes: Hot spots, puffs and blips,”Cell Calcium
20, 105–121 (1996).
23
E. R. Higgins, H. Schmidle, and M. Falcke, “Waiting time distributions for clusters of IP3receptors,”J. Theor. Biol.259, 338–349 (2009). 24K. Thurley, I. F. Smith, S. C. Tovey, C. W. Taylor, I. Parker, and M.
Falcke, “Timescales of IP3-evoked Ca2þspikes emerge from Ca2þpuffs
only at the cellular level,”Biophys. J.101, 2638–2644 (2011).
25N. Woods, K. Cuthbertson, and P. Cobbold, “Repetitive transient rises in
cytoplasmic free calcium in hormone-stimulated hepatocytes,” Nature
319, 600–602 (1986).
26T. Rooney, E. Sass, and A. Thomas, “Characterization of cytosolic
cal-cium oscillations induced by phenylephrine and vasopressin in single fura-2-loaded hepatocytes,” J. Biol. Chem.264, 17131–17141 (1989).
27K. Thurley, S. C. Tovey, G. Moenke, V. L. Prince, A. Meena, A. P.
Thomas, A. Skupin, C. W. Taylor, and M. Falcke, “Reliable encoding of stimulus intensities within random sequences of intracellular Ca2þspikes,” Sci. Signaling7, ra59 (2014).
28
A. Politi, L. D. Gaspers, A. P. Thomas, and T. H€ofer, “Models of IP3and
Ca2þ oscillations: Frequency encoding and identification of underlying feedbacks,”Biophys. J.90, 3120–3133 (2006).
29
P. J. Bartlett, W. Metzger, L. D. Gaspers, and A. P. Thomas, “Differential regulation of multiple steps in inositol 1,4,5-trisphosphate signaling by protein kinase C shapes hormone-stimulated Ca2þoscillations,”J. Biol. Chem.290(30), 18519–18533 (2015).
30
M. Berridge, “Calcium oscillations,” J. Biol. Chem. 265, 9583–9586 (1990).
31
M. Nash, K. Young, R. Challiss, and S. Nahorski, “Receptor-specific mes-senger oscillations,”Nature413, 381–382 (2001).
32A. Green, P. Cobbold, and C. Dixon, “Elevated intracellular cyclic AMP
exerts different modulatory effects on cytosolic free Ca2þoscillations in single rat hepatocytes,”Biochem. J.302, 949–955 (1994).
33A. Green, C. Dixon, A. McLennan, P. Cobbold, and M. Fisher, “Adenine
dinucleotide-mediated cytosolic free Ca2þ oscillations in single hep-atocytes,”FEBS322, 197–200 (1993).
34M. S. Nash, M. J. Schell, P. J. Atkinson, N. R. Johnston, S. R. Nahorski,
and R. A. J. Challiss, “Determinants of metabotropic glutamate receptor-5-mediated Ca2þand inositol 1,4,5-trisphosphate oscillation frequency,”J. Biol. Chem.277, 35947–35960 (2002).
35
M. Bootman, C. Taylor, and M. Berridge, “The thiol reagent, thimerosal, evokes Ca2þspikes in HeLa cells by sensitizing the inositol 1,4,5-trisphos-phate receptor,” J. Biol. Chem.267, 25113–25119 (1992).
36
A. Skupin, H. Kettenmann, and M. Falcke, “Calcium signals driven by sin-gle channel noise,”PLoS Comput. Biol.6, e1000870 (2010).
37A. Mikhailov,Foundations of Synergetics, Springer Series in Synergetics
Vol. 1 (Springer, 1994), p. 2.
38
M. Diaz, D. Eisner, and S. O’Neill, “Depressed ryanodine receptor activity increases variability and duration of the systolic Ca2þtransient in rat ven-tricular myocytes,”Circ. Res.91, 585–593 (2002).
39
J. Kocksk€amper and L. A. Blatter, “Subcellular Ca2þalternans represents a novel mechanism for the generation of arrhythmogenic Ca2þwaves in cat atrial myocytes,”J. Physiol.545, 65–79 (2002).
40A. Skupin, H. Kettenmann, U. Winkler, M. Wartenberg, H. Sauer, S. C.
Tovey, C. W. Taylor, and M. Falcke, “How does intracellular Ca2þ oscil-late: By chance or by the clock?,”Biophys. J.94, 2404–2411 (2008).
41
G. D. Dickinson and I. Parker, “Factors determining the recruitment of inositol trisphosphate receptor channels during calcium puffs,”Biophys. J.
105, 2474–2484 (2013).
42G. D. Dickinson, D. Swaminathan, and I. Parker, “The probability of
trig-gering calcium puffs is linearly related to the number of inositol trisphos-phate receptors in a cluster,”Biophys. J.102, 1826–1836 (2012).
43
C. Taylor, “Inositol trisphosphate receptors: Ca2þ-modulated intracellular Ca2þchannels,”Biochim. Biophys. Acta1436, 19–33 (1998).
44
J. K. Foskett, C. White, K.-H. Cheung, and D.-O. D. Mak, “Inositol tri-sphosphate receptor Ca2þrelease channels,”Physiol. Rev. 87, 593–658 (2007).
45E. Gin, M. Falcke, L. E. Wagner, D. I. Yule, and J. Sneyd, “A kinetic
model of the inositol trisphosphate receptor based on single-channel data,” Biophys. J.96, 4053–4062 (2009).
46
G. Dupont, S. Swillens, C. Clair, T. Tordjmann, and L. Combettes, “Hierarchical organisation of calcium signals in hepatocytes: From experi-ments to models,”Biochim. Biophys. Acta1498, 134–152 (2000).
47
W. Croft, K. Reusch, A. Tilunaite, N. A. Russell, R. Thul, and T. C. Bellamy, “Probabilistic encoding of stimulus strength in astrocyte global calcium signals,”GLIA64, 537–552 (2016).
48
S. Dragoni, U. Laforenza, E. Bonetti, F. Lodola, C. Bottino, R. Berra-Romani, G. Carlo Bongio, M. P. Cinelli, G. Guerra, P. Pedrazzoli, V. Rosti, F. Tanzi, and F. Moccia, “Vascular endothelial growth factor stimu-lates endothelial colony forming cells proliferation and tubulogenesis by inducing oscillations in intracellular Ca2þconcentration,”Stem Cells29, 1898–1907 (2011).
49
P. Cao, X. Tan, G. Donovan, M. J. Sanderson, and J. Sneyd, “A determin-istic model predicts the properties of stochastic calcium oscillations in air-way smooth muscle cells,”PLoS Comput. Biol.10, e1003783 (2014).
50G. Dupont, A. Abou-Lovergne, and L. Combettes, “Stochastic aspects of
oscillatory Ca2þdynamics in hepatocytes,”Biophys. J. 95, 2193–2202 (2008).
51
M. Perc, A. K. Green, C. J. Dixon, and M. Marhl, “Establishing the sto-chastic nature of intracellular calcium oscillations from experimental data,”Biophys. Chem.132, 33–38 (2008).
52A. Skupin and M. Falcke, “The role of IP
3R clustering in Ca2þsignaling,”
inInternational Conference on Genome Informatics, 2008[Genome Inf.
20, 15–24 (2008)].
53
A. Skupin and M. Falcke, “From puffs to global Ca2þsignals: How molec-ular properties shape global signals,”Chaos19, 037111 (2009).
54
K. Thurley and M. Falcke, “Derivation of Ca2þsignals from puff proper-ties reveals that pathway function is robust against cell variability but sen-sitive for control,”Proc. Natl. Acad. Sci. U. S. A.108, 427–432 (2011).
55
A. Skupin and M. Falcke, “Statistical analysis of calcium oscillations,” Eur. Phys. J. Spec. Top.187, 231–240 (2010).
56
A. Tilunaite, W. Croft, N. Russell, T. C. Bellamy, and R. Thul, “A_ Bayesian approach to modelling heterogeneous calcium responses in cell populations,”PLOS Comput. Biol.13, e1005794 (2017).
57G. Dupont, M. Falcke, V. Kirk, and J. Sneyd, in Models of Calcium Signalling, Interdisciplinary Applied Mathematics Vol. 43, edited by S. Antman, L. Greengard, and P. Holmes (Springer, 2016).
58
We expect the ISI properties also to apply to interburst intervals with the slight modification of measuring the interburst interval from the end of a burst to the onset of the subsequent one.
59J. Keizer and G. Smith, “Spark-to-wave transition: Saltatory transmission
of calcium waves in cardiac myocytes,” Biophys. Chem. 72, 87–100 (1998).
60
J. Shuai and P. Jung, “Optimal ion channel clustering for intracellular cal-cium signaling,”Proc. Natl. Acad. Sci. U. S. A.100, 506–510 (2003).
61G. Ullah and P. Jung, “Modeling the statistics of elementary calcium
release events,”Biophys. J.90, 3485–3495 (2006).
62
S. R€udiger, C. Nagaiah, G. Warnecke, and J. Shuai, “Calcium domains around single and clustered ip3receptors and their modulation by buffers,”
Biophys. J.99, 3–12 (2010).
63
S. R€udiger, P. Jung, and J.-W. Shuai, “Termination of Ca2þrelease for clustered ip3r channels,”PLoS Comput. Biol.8, e1002485 (2012). 64J. Shuai, J. E. Pearson, and I. Parker, “Modeling Ca2þfeedback on a single
inositol 1,4,5-trisphosphate receptor and its modulation by Ca2þbuffers,” Biophys. J.95, 3738–3752 (2008).
65
A. Sigal1, R. Milo, A. Cohen, N. Geva-Zatorsky, Y. Klein, Y. Liron, N. Rosenfeld, T. Danon, N. Perzov, and U. Alon1, “Variability and memory of protein levels in human cells,”Nature444, 643–646 (2006).
66
A. Skupin and M. Falcke, “Statistical properties and information content of calcium oscillations,” Genome Inf.18, 44–53 (2007).
67M. Falcke and V. N. Friedhoff, “The stretch to stray on time: Resonant
length of random walks in a transient,” preprintarXiv:1801.05446(2018).
68
I. Siekmann, L. E. Wagner II, D. Yule, E. J. Crampin, and J. Sneyd, “A kinetic model for type i and {II}{IP3R} accounting for mode changes,” Biophys. J.103, 658–668 (2012).
69
P. Cao, M. Falcke, and J. Sneyd, “Mapping interpuff interval distribution to the properties of inositol trisphosphate receptors,” Biophys. J. 112, 2138–2146 (2017).
70U. Kummer, L. Olsen, C. Dixon, A. Green, E. Bornberg-Bauer, and G.
Baier, “Switching from simple to complex oscillations in calcium signal-ing,”Biophys. J.79, 1188–1195 (2000).
71
T. Haberichter, M. Marhl, and R. Heinrich, “Birhythmicity, trirhythmicity and chaos in bursting calcium oscillations,” Biophys. Chem.90, 17–30 (2001).
72
U. Kummer, B. Krajnc, J. Pahle, A. K. Green, C. J. Dixon, and M. Marhl, “Transition from stochastic to deterministic behavior in calcium oscil-lations,”Biophys. J.89, 1603–1611 (2005).
73G. Dupont, G. Houart, and A. Goldbeter,From Simple to Complex Ca2þ Oscillations: Regulatory Mechanisms and Theoretical Models(Springer, Berlin, Heidelberg/New York, 2003), Chap. 8, pp. 129–151.
74J. Sneyd, J. M. Han, L. Wang, J. Chen, X. Yang, A. Tanimura, M. J.
Sanderson, V. Kirk, and D. I. Yule, “On the dynamical structure of cal-cium oscillations,”Proc. Natl. Acad. Sci. U. S. A.114, 1456–1461 (2017).
75
A. Goldbeter, G. Dupont, and M. J. Berridge, “Minimal model for signal-induced Ca2þoscillations and for their frequency encoding through protein phosphorylation,”Proc. Natl. Acad. Sci. U. S. A.87, 1461–1465 (1990).
76
T. Prager, M. Falcke, L. Schimansky-Geier, and M. A. Zaks, “Non-Markovian approach to globally coupled excitable systems,”Phys. Rev. E
76, 011118 (2007).
77M. A. Zaks, X. Sailer, L. Schimansky-Geier, and A. B. Neiman, “Noise
induced complexity: From subthreshold oscillations to spiking in coupled excitable systems,”Chaos15, 026117 (2005).
78J. Murray, Mathematical Biology(Springer-Verlag, Berlin, Heidelberg,
1993).
79
A. Goldbeter,Biochemical Oscillations and Cellular Rhythms(Cambridge University Press, Cambridge, 1996).
80J. Keener and J. Sneyd,Mathematical Physiology(Springer, New York,