QUARTERLY
ECONOMIC
COMMENTARY
WINTER 2017
KIERAN MCQUINN
, CONOR O'TOOLE, PHILIP ECONOMIDES AND
TERESA MONTEIRO
FORECASTING
December
201
7
QUARTERLY ECONOMIC COMMENTARY
Kieran McQuinn
Conor O’Toole
Philip Economides
Teresa Monteiro
Winter 2017
The forecasts in this Commentary are based on data available by 27 November 2017
Draft completed on 7 December 2017
A subscription to the Quarterly Economic Commentary costs €327 per year, including VAT and postage.
© The Economic and Social Research Institute, Whitaker Square, Sir John Rogerson’s Quay, Dublin 2.
ISBN 978-0-7070-0444-0 ISSN 0376-7191
DOI https://doi.org/10.26504/qec2017win
The Economic and Social Research Institute is an independent research institute working towards a vision of ‘Informed policy for a better Ireland’. The ESRI seeks to support sustainable economic growth and social progress in Ireland by providing a robust knowledge base capable of providing effective solutions to public policy challenges.
The Institute was founded in 1960 by a group of senior civil servants, led by Dr T.K. Whitaker, who identified the need for independent and in-depth research to support the policymaking process in Ireland. Since then, the Institute has remained committed to independent research and its work is free of any expressed ideology or political position. The Institute publishes all research reaching the appropriate academic standard, irrespective of its findings or who funds the research.
The ESRI brings together leading experts from a variety of disciplines who work together to break new ground across a number of research initiatives. The expertise of its researchers is recognised in public life and researchers are represented on the boards and advisory committees of several national and international organisations.
ESRI researchers uphold the highest academic standards. The quality of the Institute’s research output is guaranteed by a rigorous peer review process. Research is published only when it meets the required standards and practices. Research quality has also been assessed as part of two peer reviews of the Institute, in 2010 and 2016.
ESRI research findings are disseminated widely in books, journal articles and reports. Reports published by the ESRI are available to download, free of charge, from its website. ESRI staff members communicate research findings at regular conferences and seminars, which provide a platform for representatives from government, civil society and academia to discuss key findings from recently published studies and ongoing research.
The Commentary is edited by Kieran McQuinn and Conor O’Toole. Kieran McQuinn is Research Professor and Conor O’Toole is a Senior Research Officer at the Economic and Social Research Institute (ESRI). Philip Economides and Teresa Monteiro are Research Assistants at the ESRI.
Special Articles are published in the QEC in order to foster high-quality debate on various aspects of the Irish economy and Irish economic policy. They are subject to refereeing prior to publication.
TABLE OF CONTENTS
Summary Table ... ii
National Accounts 2016, 2017, 2018 ... iii
CHAPTERS The Irish Economy – Forecast Overview ... 1
The International Economy ... 3
The Domestic Economy ... 13
General Assessment ... 56
Detailed Forecast Tables ... 61
SPECIAL ARTICLES Distributional Impact of Tax and Welfare Policies: Budget 2018 T. Callan, M. Bercholz, K. Doorley, C. Keane, M. Regan, M. Savage, J.R. Walsh....75
Irish house prices: Déjà vu all over again? K. McQuinn....85
SUMMARY TABLE
2014 2015 2016 2017 2018
Output (Real Annual Growth %)
Private Consumer Expenditure 2.0 4.5 3.3 2.8 2.9
Public Net Current Expenditure 4.8 1.8 5.3 3.5 3.6
Investment 18.1 27.9 61.2 15.9 11.9
Exports 14.4 38.4 4.6 3.1 4.4
Imports 14.9 26.0 16.4 4.7 6.8
Gross Domestic Product (GDP) 8.3 25.6 5.1 5.0 4.2
Gross National Product (GNP) 9.0 16.4 9.6 5.4 4.2
Prices (Annual Growth %)
Consumer Price Index (CPI) 0.2 -0.3 0.0 0.6 1.4
Growth in Average Hourly Earnings 1.6 2.2 2.5 2.8 3.0
Labour Market
Employment Levels (ILO basis (‘000)) 1,914 1,964 2,020 2,072 2,118
Unemployment Levels (ILO basis (‘000)) 243 204 172 136 121
Unemployment Rate (as % of Labour Force) 11.3 9.4 7.9 6.2 5.4
Public Finance
General Government Balance (€bn) -7.2 -5.0 -1.8 -1.0 0.6
General Government Balance (% of GDP) -3.7 -1.9 -0.7 -0.3 0.2
General Government Debt, % of GDP 105.2 78.7 75.4 66.2 62.5
External Trade
Balance of Payments Current Account (€bn) 3.2 31.6 9.2 11.5 5.2
Current Account (% of GNP) 1.9 15.4 4.1 4.6 2.0
Note: Detailed forecast tables are contained in an Appendix to this Commentary.
NATIONAL ACCOUNTS 2016
A: EXPENDITURE ON GROSS NATIONAL PRODUCT
2015 2016 Change in 2016
€ bn € bn Value Price Volume
Private Consumer Expenditure 92.7 96.6 4.2 1.0 3.3
Public Net Current Expenditure 27.0 28.4 5.2 -0.1 5.3
Gross Fixed Capital Formation 53.2 87.7 64.9 2.3 61.2
Exports of Goods and Services 326.6 335.0 2.6 -1.9 4.6
Physical Changes in Stocks 2.4 2.4
Final Demand 501.8 550.1 9.6 -0.7 10.4
less:
Imports of Goods and Services 239.9 274.4 14.4 -1.7 16.4
Statistical Discrepancy 0.1 -0.1
GDP at Market Prices 262.0 275.6 5.2 0.2 5.0
Net Factor Payments -56.0 -48.8
GNP at Market Prices 206.0 226.7 10.1 0.4 9.6
B: GROSS NATIONAL PRODUCT BY ORIGIN
2015 2016 Change in 2016
€ bn € bn € bn %
Agriculture 3.2 3.2 0.1 1.7
Non-Agriculture: Wages, etc. 76.1 80.3 4.1 5.4
Other 102.3 107.4 5.1 5.0
Adjustments: Stock Appreciation 0.4 0.4
Statistical Discrepancy -0.1 0.1
Net Domestic Product 181.9 191.4 9.5 5.2
Net Factor Payments -56.0 -48.8 7.2 -12.9
National Income 125.8 142.6 16.7 13.3
Depreciation 61.6 64.5 2.9 4.7
GNP at Factor Cost 187.4 207.0 19.6 10.5
Taxes less Subsidies 18.6 19.7 1.1 6.1
GNP at Market Prices 206.0 226.7 20.8 10.1
C: BALANCE OF PAYMENTS ON CURRENT ACCOUNT
2015 2016 Change in 2016
€ bn € bn € bn
X – M 86.7 60.6 -26.1
F -51.9 -47.6 4.3
Net Transfers -3.1 -3.8 -0.7
Balance on Current Account 31.6 9.2 -22.5
NATIONAL ACCOUNTS 2017
A: EXPENDITURE ON GROSS NATIONAL PRODUCT
2016 2017 Change in 2017
€ bn € bn Value Price Volume
Private Consumer Expenditure 96.6 100.3 3.8 1.0 2.8
Public Net Current Expenditure 28.4 28.8 1.6 -1.8 3.5
Gross Fixed Capital Formation 87.7 104.8 19.6 3.1 15.9
Exports of Goods and Services 335.0 364.5 8.8 5.5 3.1
Physical Changes in Stocks 2.4 2.0
Final Demand 550.1 600.4 9.2 4.1 4.8
less:
Imports of Goods and Services 274.4 297.7 8.5 3.6 4.7
Statistical Discrepancy -0.1 -0.1
GDP at Market Prices 275.6 302.6 9.8 4.6 5.0
Net Factor Payments -48.8 -52.0
GNP at Market Prices 226.7 250.7 10.6 4.9 5.4
B: GROSS NATIONAL PRODUCT BY ORIGIN
2016 2017 Change in 2017
€ bn € bn € bn %
Agriculture 3.2 3.3 0.1 2.0
Non-Agriculture: Wages, etc. 80.3 84.9 4.6 5.8
Other 107.4 124.1 16.7 15.5
Adjustments: Stock Appreciation 0.4 0.4
Statistical Discrepancy 0.1 0.1 0.0 0.0
Net Domestic Product 191.4 212.8 21.4 11.2
Net Factor Payments -48.8 -52.0 -3.1 6.4
National Income 142.6 160.8 18.2 12.8
Depreciation 64.5 69.3 4.8 7.4
GNP at Factor Cost 207.0 230.1 23.0 11.1
Taxes less Subsidies 19.7 20.6 0.9 4.7
GNP at Market Prices 226.7 250.7 23.9 10.6
C: BALANCE OF PAYMENTS ON CURRENT ACCOUNT
2016 2017 Change in 2017
€ bn € bn € bn
X – M 60.6 66.2 5.6
F -47.6 -51.0 -3.3
Net Transfers -3.8 -3.8 0.0
Balance on Current Account 9.2 11.5 2.3
NATIONAL ACCOUNTS 2018
A: EXPENDITURE ON GROSS NATIONAL PRODUCT
2017 2018 Change in 2018
€ bn € bn Value Price Volume
Private Consumer Expenditure 100.3 104.3 3.9 1.0 2.9
Public Net Current Expenditure 28.8 30.1 4.4 0.7 3.6
Gross Fixed Capital Formation 104.8 120.7 15.1 2.9 11.9
Exports of Goods and Services 364.5 391.9 7.5 3.0 4.4
Physical Changes in Stocks 2.0 3.0
Final Demand 600.4 649.9 8.2 2.6 5.5
less:
Imports of Goods and Services 297.7 329.0 10.5 3.5 6.8
Statistical Discrepancy -0.1 -0.1
GDP at Market Prices 302.6 320.8 6.0 1.7 4.2
Net Factor Payments -52.0 -54.2
GNP at Market Prices 250.7 266.6 6.4 2.1 4.2
B: GROSS NATIONAL PRODUCT BY ORIGIN
2017 2018 Change in 2018
€ bn € bn € bn %
Agriculture 3.3 3.4 0.1 2.5
Non-Agriculture: Wages, etc. 84.9 89.5 4.7 5.5
Other 124.1 134.6 10.5 8.5
Adjustments: Stock Appreciation 0.4 0.4
Statistical Discrepancy 0.1 0.0 -0.1
Net Domestic Product 212.8 227.9 15.1 7.1
Net Factor Payments -52.0 -54.2 -2.2 4.3
National Income 160.8 173.7 12.9 8.0
Depreciation 69.3 71.6 2.3 3.5
GNP at Factor Cost 230.1 245.3 15.2 6.6
Taxes less Subsidies 20.6 21.3 0.7 3.3
GNP at Market Prices 250.7 266.6 15.9 6.4
C: BALANCE OF PAYMENTS ON CURRENT ACCOUNT
2017 2018 Change in 2018
€ bn € bn € bn
X – M 66.2 62.2 -4.0
F -51.0 -53.2 -2.2
Net Transfers -3.8 -3.8 0.0
Balance on Current Account 11.5 5.2 -6.2
The Irish Economy – Forecast Overview
The Irish economy looks set to experience another year of strong recovery in 2017. The performance of key indicators – taxation revenues and labour market variables – underpins our assessment that the domestic economy will experience output growth of approximately 5 per cent for the current year. We expect the economy to also grow strongly in 2018, at a rate of 4.2 per cent.
To put this performance in context, the European Union, which is deemed to be currently experiencing a growth recovery, is expected to grow by less than 1.9 per cent for the same period. However, it is worth pointing out that much of the Irish growth is due to domestic factors, with investment and consumption contributing strongly. Both Irish exports and imports look set to register significantly more modest levels of activity in 2017. While this may be down to certain well acknowledged difficulties associated with the National Accounts, it is worth noting that a sustainable growth path for a small open economy such as Ireland’s requires both domestic and external sources of growth over the longer term.
One growing risk for the domestic outlook is the performance of the UK economy. The recent revision downwards of the UK forecast by the Office for Budget Responsibility (OBR) illustrates the precarious nature of the UK economy especially given the uncertainty of the Brexit outcome. While Ireland’s trade has diversified in recent times, the performance of our closest neighbour is still important in generating external sources of growth for the domestic economy.
The overall size of the recent budgetary package, which was framed against a relatively modest amount of fiscal space, was a prudent outcome. In a Special Article to the Commentary, Callan et al. (2017) indicate that overall, the impact of the budget policy was to reduce incomes somewhat below the levels which would have obtained if tax and welfare parameters had been indexed in line with forecast wage inflation.
investment rates could also be driven by the ongoing uncertainties related to Brexit.
The pace of growth in 2017 and the expected performance of the economy in 2018 mean that crucial policy challenges are likely to arise in the coming years if the present strong recovery is set to mature into sustainable performance over the medium term. In that regard two other Special Articles to the Commentary
The International Economy
Though still subdued compared to pre-crisis levels, world real GDP growth forecasts remain positive through the latter half of the year. This growth is well distributed, with the OECD reporting balanced trends between advanced and developing economies.1 According to consensus forecasts, estimates of growth
for 2017 indicate that real GDP will reach an annual rate of 3.6 per cent, reflecting the fastest pace of global growth in two years and a rate just below the average global growth rate of 3.8 between 1985 and 2007, as estimated by the IMF.
Amongst developed economies, it appears that the recovery is becoming more ingrained in the Eurozone with declining unemployment rates and improving domestic demand all contributing to an improved outlook. In unison with these promising developments, the ECB has recently announced plans to taper the quantitative easing programme, cutting monthly levels of asset purchases in half to €30 billion, starting next year. Given the ECB’s pledge to keep borrowing costs unchanged until well after the end of these asset purchases, it is likely the policy rate will remain at its current rate until early 2019. McQuinn and Whelan (2017), in an updated analysis of earlier work, highlight the cyclical nature of the EU recovery. They contend that underlying vulnerabilities persist across Europe and, accordingly, project productivity growth in the Euro Area of below 1 per cent per year over the next decade and weaker in later decades. The results of McQuinn and Whelan (2017) are summarised in the following box.
BOX 1 EUROPE’S LONG-TERM GROWTH PROSPECTS: AN UPDATED ASSESSMENT
The recent adjustment to the asset purchase programme by the ECB reflects the general growing confidence that the European economy has been steadily improving over the last number of years. Growth rates for both the EU and Euro Area, which had been negative as recently as 2012 and 2013 respectively, have over the past three years averaged 1.7 per cent per annum. However in a number of updates of their previous analysis, McQuinn and Whelan (2016; 2017) find little evidence to support the view that Europe is on a new growth trajectory. Rather, they find that the recent recovery is more of a cyclical development reflecting a decline in the relatively high unemployment rates, which had persisted since the international financial downturn, while long-term downward trends in productivity have not reversed.
In their initial study, McQuinn and Whelan (2008) focused on trends in European growth
rates up to mid-2006. While the period of growth in Europe prior to the global crisis of 2008 is sometimes referred to as ‘the boom’, McQuinn and Whelan (2008) noted that long-run trends in both productivity and per capita hours worked were deteriorating to the point where potential output growth in the Euro Area was at a historical low point and, apparently, on a negative trend. In particular, after a long period of catching up with US levels of labour productivity, Euro Area productivity growth had, from the mid-1990s onwards, fallen significantly behind.
McQuinn and Whelan (2016, 2017) update their calculations from their 2008 paper and provide projections for growth in the Euro Area out to 2060 based on a recovery scenario over the rest of this decade and long-term demographic trends. They also describe the potential impact of structural reforms relative to this baseline scenario. In this box, we summarise the main elements of their updated analysis.
With a long-term projection of TFP growth of 0.2 per cent, a gradual decline in the work-age population and a static averwork-age workweek, McQuinn and Whelan (2017) project a ‘baseline’ average real GDP growth rate in the Euro Area of 0.6 per cent over the next decade even if the unemployment rate and investment share of GDP return to their pre-crisis levels by 2020.
The findings are sobering for those expecting economic growth to deal with the Euro Area’s debt problems in the coming decades. Among the results McQuinn and Whelan (2016; 2017) report are the following:
• Total factor productivity (TFP) growth in the twelve-country Euro Area group has declined in each decade since the 1970s. Over the years 2000-2016, a period that includes multiple slow-downs and expansions, TFP growth has averaged only 0.2 per cent per year.
• The slump in investment due to weak growth is now having significant negative supply-side effects. We estimate that capital stock growth, which averaged 1.9 per cent per year over the past two decades, is now falling below 1 per cent per year. Using an elasticity of output with respect to capital of one-third, this factor alone is currently reducing the supply-side growth potential of the Euro Area economy by about 0.5 percentage points per year.
• While Europe’s demographic ageing pattern is sometimes presented as a longer-term issue that will cause problems relating to pension systems in future decades, the ageing process is actually affecting Europe’s growth potential right now. The work-age population of the Euro Area has peaked and Eurostat projections anticipate that the decline in this age group will accelerate in the coming decades. Even assuming a return to pre-crisis average unemployment rates and ruling out future declines in the average workweek of employees, McQuinn and Whelan (2016; 2017) project that, if current patterns of labour market participation persist, total hours worked will decline significantly from the start of the next decade.
‘baseline’ average real GDP growth rate in the Euro Area of 0.6 per cent over the next decade even if the unemployment rate and investment share of GDP return to their pre-crisis levels by 2020.
Output is measured using the following Cobb-Douglas production function
𝑌𝑡 = 𝐴𝑡𝐾𝑡𝛼𝐿1−𝛼𝑡 (1)
where 𝑌𝑡 is real GDP, 𝐾𝑡 is capital input, 𝐿𝑡is labour input (defined in this paper as total
hours worked), and 𝐴𝑡 is total factor productivity. Output growth can then be written as
𝑌𝑡̇
𝑌𝑡
=
𝐴𝑡̇
𝐴𝑡
+
𝛼𝐾𝑡̇
𝐾𝑡
+ (
1− 𝛼)
𝐿𝑡̇
𝐿𝑡(2)
Table A presents results for the Euro Area and the US of the growth accounting exercise which allocates output growth according to the three components in Equation (2). With data on output, capital, and labour growth to hand and a value for α, this equation can
be used to calculate TFP growth.
TABLE A DECOMPOSITION OF EURO AREA AND US OUTPUT GROWTH RATES (%)
Euro Area United States
Period Y A K L Y A K L
1970-1976 3.6 2.7 1.5 -0.6 3.1 0.9 1.2 1 1977-1986 2.1 1.6 0.8 -0.4 3.1 0.7 1.2 1.2 1987-1996 2.3 1.5 0.8 0 2.9 0.9 1.1 0.9 2007-2016 0.3 0.1 0.5 -0.2 1.3 0.4 0.7 0.2
2000-2016 1 0.2 0.6 0.2 1.8 0.5 1 0.3 2010-2016 0.9 0.4 0.3 0.2 2 0.4 0.6 1 2014-2016 1.9 0.6 0.3 1 2.1 0.3 0.7 1.1 2014-2016 (excl Irl) 1.6 0.3 0.3 1 2.1 0.3 0.7 1.1
Sources: McQuinn and Whelan (2017).
• While there have been regular cyclical fluctuations, GDP growth in the Euro Area appears to have been on a downward trend since the 1970s. During the 1970s, GDP growth averaged 3.7 per cent per year. During the 1980s this fell to 2.2 per cent. In the 1990s, the average growth rate was 2.1 per cent and the period from 2000 onwards has seen an average growth rate of only 1.0 per cent.
• The growth rate of total hours worked in the Euro Area has shown no clear trend over the period since 1970. Over the period 2000-2016, the growth rate of total hours worked in the Euro Area has been effectively flat.
per cent between the late 1970s and 2008.2 Recent years, however, have seen a
significant decline in the investment share of GDP and they estimate that the Euro Area capital stock is now growing at an annual rate below 1 per cent.
• The rate of TFP growth has also declined gradually over time. Table A provides estimates for each of the ten-year intervals preceding 2007. TFP growth was running at 2.7 per cent in the first half of the 1970s, fell to 1.6 per cent over 1977-1986, to 1.5 per cent over 1987-1996 and to 0.7 per cent over 1997-2006. The period from 2007-2016 has seen TFP increase only at an average rate of 0.1 per cent per year.
• The recent return to growth in the Euro Area does not signal an improved TFP performance. While the average rate of TFP growth over the 2014 to 2016 period increased to 0.6 per cent, half of this increase is accounted for by the huge increase in Irish GDP in 2015, which reflects issues related to multinational corporation activity that had effectively nothing to do with the real economy of the Euro Area. Excluding Ireland, TFP growth accounted for only 0.3 per cent of the 1.6 per cent average growth rate of this period. The largest contributor to growth, accounting for 1.0 per cent, was increased labour input, mainly reflecting the decline in the unemployment rate.
References:
McQuinn K. and K. Whelan (2017). ‘Europe’s long-term growth prospects: With and without structural reforms’, chapter in Structural Reforms and European Integration, editors P. de Grauwe, N. Campos and Y. Ji.
McQuinn K. and K. Whelan (2016). ‘The Prospects for Future Economic Growth in the Euro Area, Intereconomics’, Review of European Economic Policy, Volume 51, November/December, Number 6, pp.305-311.
McQuinn K. and K. Whelan (2008). ‘Prospects for growth in the Euro Area’, CESifo Economic Studies, Vol. 54(4), pp.642-680.
This box was prepared by Kieran McQuinn and Karl Whelan (UCD).
Key US economic indicators such as employment growth, consumer sentiment and trade expansion all point to robust economic growth in 2017. Elsewhere, the decision by the Bank of Japan to keep monetary policy steady during a period where its peers in North America and Europe have begun winding down stimulus measures suggests the economy there continues to underperform. As long as Japan’s recovery remains moderate, monetary policy will likely remain stable until the country’s 2019/2020 goal of 2 per cent inflation is met. The recent fiscal stimulus by the Japanese authorities will contribute to modest growth in 2017, but a labour market approaching capacity threatens to slow down the recovery.
Despite ongoing concerns as to the sustainability of its underlying economic performance, the Chinese economy registered strong year-on-year growth of 6.8 per cent for the third quarter of 2017. Current trends would suggest it is likely the economy will meet the government’s GDP target of 6.5 per cent growth for the year. Recent attempts by the Chinese authorities to tackle pollution do indicate a certain intention to address structural issues in the Chinese economy though there are still key concerns regarding the sustainability of state-owned enterprises and the extent of credit provision in the economy. More generally, other developing countries have continued benefiting from improved global demand and greater stability in financial markets. Key risks to developing economies include the persistent volatility in commodity prices as well as the possibility of capital flight risk stemming from the increasingly healthy macroeconomic conditions central banks are observing in developed nations. Commodity price volatility introduces elements of underinvestment and currency swings in the developing world which result in weaker growth rates and a slower more fractured integration into global markets.3 As core economies continue to
increase their policy rates and taper off from quantitative easing however, there is a significant possibility this could result in a significant reduction in capital flows towards emerging economies (Agosin and Huaita, 2011; Forbes and Warnock, 2012).4
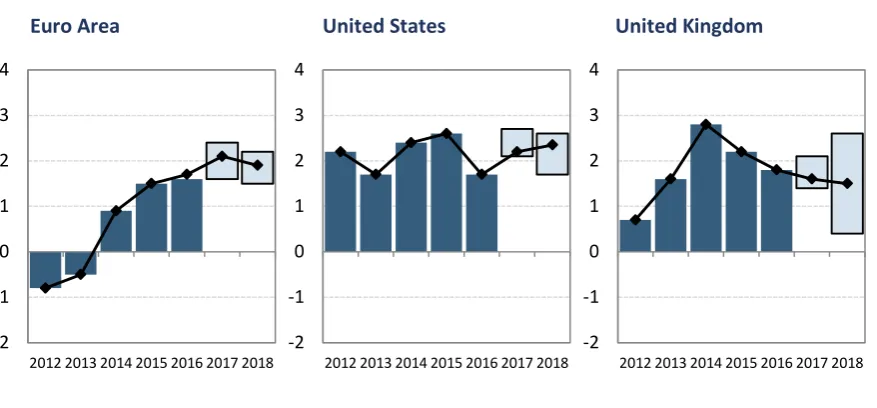
Figure 1 shows the forecasts for GDP growth by some of the major institutions in the respective economies. The outlook overall continues to remain positive over the next two years, with the majority of experts adding upward revisions to forecasts for the Euro Area. The wide bands around the UK forecast for 2017 and 2018 have extended slightly however, indicating increased uncertainty regarding the future prospects of the UK economy.
3 Jacks, D., K. O’Rourke and J. Williamson (2011). ‘Commodity Price Volatility and World Market Integration since
1700’, The Review of Economics and Statistics, August 2011, Vol. 93(3), pp. 800-813.
4 Agosin, M. and F. Huaita (2011). ‘Capital flows to emerging economies: Minsky in the tropics’, Cambridge Journal of
Economics, Vol. 35, pp. 663-683.
FIGURE 1 REAL GDP GROWTH (% CHANGE, YEAR-ON-YEAR)
Euro Area United States United Kingdom
Sources: FocusEconomics, IMF, OECD, HM Treasury and Federal Reserve.
Given the ongoing uncertainty facing the future prospects of the United Kingdom’s economy, we focus on the UK economy in the International section.
T
HEUK
E
CONOMY–
A
PPROACHINGB
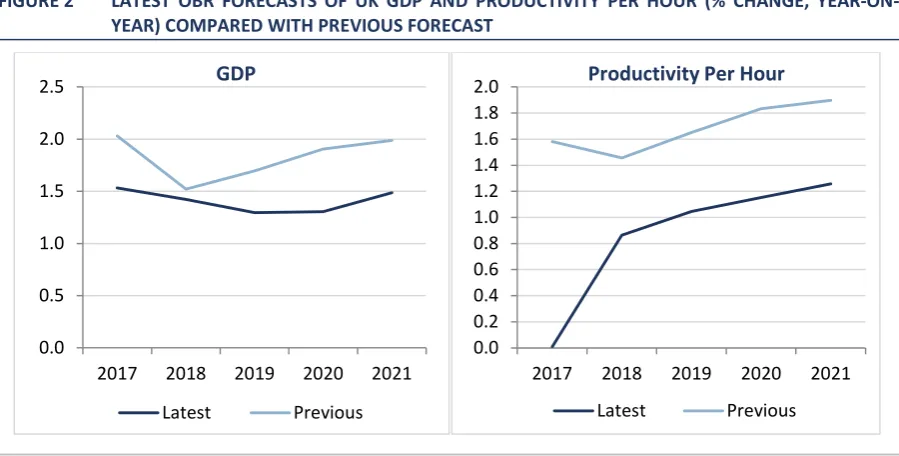
REXITThe recent revised estimates of growth for the UK released by the Office for Budget Responsibility (OBR)5 clearly demonstrate that the UK economy is slowing
down. Figure 2 summarises the OBR growth outlook for both GDP and productivity per hour and compares the forecast with the previous estimate. Arguably the most important forecast is the expected continued stagnation of UK productivity rates. Previously, the OBR had assumed that productivity rates would return to pre financial crisis rates. However, in this forecast, that assumption is no longer made.
5 Forecasts were released as part of the UK Budget. See
http://budgetresponsibility.org.uk/efo/economic-fiscal-outlook-november-2017 for more details.
-2 -1 0 1 2 3 4
2012 2013 2014 2015 2016 2017 2018 -2
-1 0 1 2 3 4
2012 2013 2014 2015 2016 2017 2018 -2
-1 0 1 2 3 4
FIGURE 2 LATEST OBR FORECASTS OF UK GDP AND PRODUCTIVITY PER HOUR (% CHANGE, YEAR-ON-YEAR) COMPARED WITH PREVIOUS FORECAST
Source: Office for Budget Responsibility.
While many argue this is a symptom of the uncertainty surrounding the recent Brexit referendum, it must be kept in mind that this slowdown had emerged in the UK economy since early 2015. Comparing the recent performance of the UK economy to comparator countries yields insights into developments since the Brexit referendum. The UK is now experiencing one of the weakest growth rates amongst its G7 counterparts with a quarter-on-quarter growth rate of 0.4 per cent for Q3 2017. In comparison, the EU28 average growth is 0.6 per cent. Recent year-on-year quarterly results show the UK as one of the poorest performers in the advanced world during what can otherwise be regarded as a global upswing in growth.
Figure 3 below demonstrates this trend, wherein the net difference between UK, European and US growth rates has only become negative quite recently.
0.0 0.5 1.0 1.5 2.0 2.5
2017 2018 2019 2020 2021 Latest Previous
GDP
0.0 0.2 0.4 0.6 0.8 1.0 1.2 1.4 1.6 1.8 2.0
2017 2018 2019 2020 2021 Latest Previous
FIGURE 3 UK QUARTERLY GROWTH DIFFERENCES (PERCENTAGE POINT DIFFERENCE, YEAR-ON-YEAR)
Source: OECD.stat, Quarterly National Accounts.
Within the UK economy there is conflicting evidence across sectors as to the current performance. For example, on a quarterly basis, the construction sector contracted by 0.9 per cent for Q3 2017 whereas a strong counteracting force is the continued growth in the services sector of 0.4 per cent. This reinforces the continued growth in the services sector within the UK economy. With a weight of 79.3 per cent in Q3 2017, the services industry accounts for the largest share of gross domestic product. In the uncertain post Brexit climate, this trend may prove to be a key vulnerability, given the relatively mobile nature of services compared to the manufacturing or construction sectors. This is particularly true for financial services which accounts for 41.5 per cent of total services in the UK as of August 2017.6
Given the heightened uncertainty due to Brexit, it is informative to assess trends in the international investment position of the UK economy. In particular, major changes in the investment position have resulted in a substantial re-allocation of investment of UK equity to the rest of the world. Most notably, in 2016 there was a £489.8 billion downward revision in the net investment position, which represents 20 per cent of the UK economy.
6 Office of National Statistics, UK index of services: August 2017.
(2.00) (1.50) (1.00) (0.50) 0.50 1.00 1.50 2.00 2.50 3.00 3.50 Q 1-201 2 Q 2-201 2 Q 3-201 2 Q 4-201 2 Q 1-201 3 Q 2-201 3 Q 3-201 3 Q 4-201 3 Q 1-201 4 Q 2-201 4 Q 3-201 4 Q 4-201 4 Q 1-201 5 Q 2-201 5 Q 3-201 5 Q 4-201 5 Q 1-201 6 Q 2-201 6 Q 3-201 6 Q 4-201 6 Q 1-201 7 Q 2-201 7 Q 3-201 7
FIGURE 4 REVISIONS TO UK NET INTERNATIONAL INVESTMENT POSITION, 2006 TO 2016 (£ BILLION)
Source: Office of National Statistics (ONS) and www.ons.gov.uk/economy/nationalaccounts/uksectoraccounts/articles/
nationalaccountsarticles/impactofmethodchangestothenationalaccountsandsectoraccountsquarter11997toquarter22017.
Note: Impact of method changes to the National Accounts and sector accounts: Quarter 1, 1997 to Quarter 2, 2017.
This indicates a significant increased diversification away from UK corporate bonds and towards overseas holdings. Referring to Figure 5, in 2016 a historically large net disinvestment of £53 billion was recorded. To keep this in perspective, the investment gains made in 2014 and 2015 combined only account for 75 per cent of this value. Significant levels of investment have been pouring into overseas government securities, the largest flows seen since the dataset began in 1986. This has occurred in tandem with seven consecutive quarters of disinvestment away from UK corporate securities. This suggests significant concerns amongst investors vis-à-vis the future performance of the UK economy.
-600 -400 -200 0 200 400 600
FIGURE 5 NET INVESTMENT BY UK FINANCIAL INSTITUTIONS (£ BILLION)
Source: Office of National Statistics (ONS).
In summary, the performance of the UK economy is expected to weaken in 2017 as high inflation and uncertainty due to Brexit negotiations are set to adversely impact consumers’ expenditure. In November, in a move not seen in a decade, the Bank of England (BoE) increased the policy rate to 0.5 per cent in an attempt to curb high inflation. However, the move may compound the UK’s weak growth outlook. Wren-Lewis,7 for example, suggests these increases will contribute
towards expectations of low growth in the future as certain firms will continue to underinvest compared to firms elsewhere. This will restrict increases in investment in the UK economy and place further downward pressure on UK productivity rates.
I
MPLICATIONS FORI
RISHE
XPORTS,
I
MPORTS AND THEB
ALANCE OFP
AYMENTSIn Figure 6 the year-on-year growth rate of quarterly total Irish exports and imports is displayed. A key characteristic of Ireland’s export performance in 2016 was the difference between services and goods exports. Services exports increased by over 10 per cent in 2016 and show signs of even greater growth in 2017 with increases averaging 14.9 per cent through Q2 2017. Goods and services import growth rates have been steadily decreasing however, with services contracting by 3.5 per cent and goods imports falling by 4.5 per cent. The significant reduction in goods exports in 2016, compared with 2015, was mainly attributable to the reduced levels of contract manufacturing. FitzGerald (2015)
7 https://mainlymacro.blogspot.ie/2017/11/the-brexit-interest-rate-increases-and.html.
attributes contract manufacturing amongst other factors as one of the key problems in terms of interpreting the Irish National Accounts.8
FIGURE 6 ANNUAL GROWTH RATE (%) IN TOTAL IRISH EXPORTS AND IMPORTS
Source: Central Statistics Office.
Given the difficulties in understanding recent movements in the Irish terms of trade, in the next box we summarise some of the conceptual issues related to national accounting treatment of trade flows.
BOX 2 OWNERSHIP-BASED ADJUSTMENTS TO CROSS-BORDER TRADE IN IRELAND
Conventionally trade is seen as the exchange of goods and services across the borders of different nations. More recently however, the production of goods can depend upon a globalised network of supply chains with key components sourced from a variety of different countries. Much of the production process for specific goods owned by Irish firms can take place outside of the country and in some cases foreign activities can encompass the entirety of the goods’ production cycle. Even though Irish-resident firms maintain ownership of the goods, they may lease out the production process to an entity in a different country. The sale of such goods between two entities in foreign countries is still considered an export of goods if ownership is retained by the Irish firm, even if the entire production process took place outside the Irish jurisdiction. This, along with other
8 FitzGerald, J. (2015). ‘Problems Interpreting National Accounts in a Globalised Economy – Ireland’, ESRI: Special
Article.
-10.0 -5.0 5.0 10.0 15.0 20.0 25.0 30.0 35.0 40.0 45.0 50.0
types of ownership trade, can cause differences in total trade balances compared with what international trade would imply. Below are the key components of trade on an ownership basis which contribute to the differences between international and total trade values.
Contract Manufacturing:This process involves contracting a foreign manufacturer who will handle the processing of intermediate goods which are intended to be sold thereafter. These production arrangements include (a) goods sent abroad for further processing, (b) goods received from abroad for processing in Ireland and (c) goods purchased and processed abroad. Often referred to as ‘factoryless production’, contract manufacturing maintains ownership of the processed goods by Irish-resident firms (or companies abroad when Irish resident companies are contracted for processing goods), with the sale of the final product being recorded as an Irish export (or Irish import) when the change of ownership occurs at the end of the production cycle.
Merchanting of Goods: This aspect of ownership-based adjustments to trade incorporates the total value of goods resold internationally without ever interacting with the Irish border. Values are calculated on a net basis wherein the purchase and resale values are taken into account and a net exports value is combined together.
Other Conceptual Adjustments: These are other adjustment processes used to adjust Balance of Payment values and include estimates for the purchases of aviation fuel, illegal cross-border trade, as well as various adjustments to merchandise values and repair contracts.
The ‘c.i.f. to f.o.b.’ adjustment: Importing goods will require transportation and insurance costs. These costs linked to getting goods across the border are factored out, resulting in the free on-board value. For further detail on these items, see CSO (2016).
Reference:
Central Statistics Office, Explaining Goods Exports and Imports 2012-2016.
FIGURE 7 GOODS EXPORTS AND IMPORTS BY TYPE (€MILLION)
Source: Central Statistics Office.
Focusing on the components of international trade, exports of food and live animals increased by 13 per cent year-on-year for the period January to September. Medical and pharmaceutical product exports rose by 18 per cent in the same period, netting an increase of €4.6 billion. Organic chemicals, however, saw the largest drop in levels by €3.5 billion (-25 per cent). Medical and pharmaceutical product imports grew 36 per cent, increasing by €2.5 billion on a year-to-year basis in 2017. Road vehicle and other transport equipment imports saw the largest combined decrease of €2.9 billion (10 and 28 per cent respectively) between the same periods.
In terms of net trade, these levels too differ as a result of adjustments previously discussed. The differences, however, are far more dramatic. Figure 8 displays net surpluses for both categories. It is clear Ireland’s cross-border trade balance has been falling steadily since 2014. As of 2016, cross-border net exports are worth €583 million whereas adjusted net exports are valued at €61,138 million.
-30,000 -20,000 -10,000 10,000 20,000 30,000 40,000 50,000 60,000
FIGURE 8 CROSS-BORDER AND ADJUSTED NET EXPORTS OF GOODS AND SERVICES (€MILLION)
Source: Central Statistics Office.
The CSO has recently produced cross-border trade values specifically between the UK and Ireland.9 Between merchandise and services, Irish-UK cross-border
trade netted surpluses to the Irish economy of €8,896 million and €9,567 million for 2015 and 2016 respectively. This underscores the vulnerability of the domestic economy to a hard Brexit type outcome.
Another point of interest in terms of the vulnerability of the domestic economy to a hard Brexit is how the trade of domestically-owned Irish firms is diversified. Between domestic and foreign-owned Irish firms, the split is exactly 50:50 in terms of total trade to the UK. As Lawless et al. (2017)10 highlight, between 2011
and 2015, 41.5 per cent of Irish non-food exports and 49 per cent of Irish food exports were destined for the UK. Given that 14 per cent of total exports are destined for the UK, this suggests foreign-owned firms operating in Ireland are more richly diversified in terms of export destinations, leaving domestically-owned firms particularly exposed to UK specific risk. The study also identifies Irish domestically-owned firms as being far less likely to survive as exporters in general. Focusing on the cross-border trade of goods, Lawless and Studnicka (2017)11 show that a WTO arrangement would result in UK cross-border trade
flows shrinking by 9 to 17 per cent in value, with the food sector likely to be most affected.
9 Central Statistics Office, Balance of International Payments Quarter 2, 2017.
10 Lawless, M., I. Siedschlag and Z. Studnicka (2017). ‘Expanding and diversifying the manufactured exports of
Irish-owned enterprises’, Evidence for Policy, ESRI, Department of Jobs, Enterprise & Innovation and Enterprise Ireland.
11 Lawless, M. and Z. Studnika (2017). ‘Potential impacts of WTO tariffs on cross-border trade’, InterTradeIreland,
available online at: www.intertradeireland.com.
10,000 20,000 30,000 40,000 50,000 60,000 70,000 80,000 90,000 100,000
FIGURE 9 ANNUAL UK SHARE OF TOTAL EXPORTS AND IMPORTS (%)
Source: Central Statistics Office.
Whilst shares of total trade are falling with respect to the UK, changes in these exports and imports for the period January to September remain relatively stable as shown in Table 1 compared to the same period in 2016. Exports and imports of Chemicals and related products saw the largest changes, of 36 and 30 per cent respectively. Machinery saw a slight fall of 6 per cent in exports to the UK. There was also a significant increase in trade with the US, while there was relatively little growth overall in trade with the rest of the EU for the same period.
5 10 15 20 25 30
2005 2006 2007 2008 2009 2010 2011 2012 2013 2014 2015 2016 UK Goods Export, % of Total UK Goods Import, % of Total
TABLE 1 JANUARY-SEPTEMBER ANNUAL CHANGE (%) IN GOODS EXPORTS AND IMPORTS FOR THE UK, THE US AND THE REST OF EU FOR MAJOR COMMODITIES
Exports Imports
Total – UK 11 8
Food and live animals 8 5 Chemicals and related products 36 30 Machinery and transport equipment -6 0 Miscellaneous manufactured articles 3 -2 Total – Rest of EU 1 -2 Food and live animals 19 9 Chemicals and related products 0 14 Machinery and transport equipment -2 -12 Miscellaneous manufactured articles -11 -2
Total – US 4 6
Food and live animals 36 -11 Chemicals and related products 10 85 Machinery and transport equipment -29 -24 Miscellaneous manufactured articles 15 -3
Source: Central Statistics Office.
FIGURE 10 IMPORT AND EXPORT GROWTH (2017 - 2018 FORECASTS)
Source: QEC calculations.
As of Q2 2017, the current account balance was a €872 million deficit, half the value for the same period last year. This improvement is attributed to a year-on-year increase in the net exports of services. The outflow of primary income, however, is now at a particularly high level after a sudden rise in the outflow of portfolio income on equity by 30 per cent over a single quarter. This is likely due to improving financial conditions for investment funds resulting in greater profit repatriation from Ireland. Figure 11 depicts the current account by its various categories of income flows.
FIGURE 11 CURRENT ACCOUNT BALANCE, QUARTERLY (€MILLION): 2011 - 2017
Source: Central Statistics Office.
-5 0 5 10 15 20 25 30 35 40 45
2009 2010 2011 2012 2013 2014 2015 2016 2017 2018 Exports Imports -30,000 -20,000 -10,000 10,000 20,000 30,000 40,000 20 11Q 1 20 11Q 2 20 11Q 3 20 11Q 4 20 12Q 1 20 12Q 2 20 12Q 3 20 12Q 4 20 13Q 1 20 13Q 2 20 13Q 3 20 13Q 4 20 14Q 1 20 14Q 2 20 14Q 3 20 14Q 4 20 15Q 1 20 15Q 2 20 15Q 3 20 15Q 4 20 16Q 1 20 16Q 2 20 16Q 3 20 16Q 4 20 17Q 1 20 17Q 2
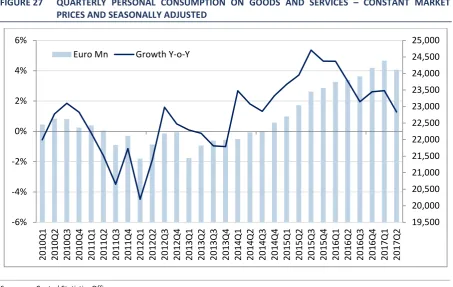
[image:30.595.76.523.82.326.2]The Domestic Economy
O
UTPUTThe Domestic section of the Commentary is organised as follows; we initially review the outlook for output growth before discussing developments in the Irish monetary and financial sectors. Prices and earnings in the economy are then discussed, followed by a review of demand-side factors such as consumption and housing market issues. On the supply side, we then examine developments in investment and the labour market before concluding with an analysis of the public finances.
The latter part of the year has seen strong growth in taxation revenues across nearly all items. This, allied to the continuing robust performance of the Irish labour market where the unemployment rate is now expected to be less than 6 per cent by the end of the year, results in our overall estimate of output growth of 5 per cent in 2017.
While this is broadly unchanged since the last Commentary, the expected composition of growth has altered somewhat. As explained in the International section we have revised downwards our outlook for both exports and imports somewhat. However, the overall impact on domestic growth via the terms of trade is relatively unchanged. Domestic factors, consumption and investment, are expected to be the main sources of growth in both 2017 and 2018. For 2018, we are forecasting a marginally stronger increase in output of 4.2 per cent than envisaged in the previous Commentary.
FIGURE 12 ACTUAL (2016) AND FORECAST (2017, 2018) GDP GROWTH RATES FOR SELECT EUROPEAN ECONOMIES
Sources: QEC calculations for Ireland, AMECO estimates for all other countries.
M
ONETARY ANDF
INANCIALC
ONDITIONSIn line with the broader trends in the Eurozone, macro-financial conditions in Ireland have continued to improve in the most recent quarters. The extensive monetary policy stimulus undertaken by the ECB, in particular through the non-standard asset purchase programmes, have compressed sovereign, financial institution and large corporate borrowing costs. Negative yields on overnight interest rates (Figure 13) have provided a stabilising factor for market stresses and, despite the rise in geopolitical uncertainties surrounding the policies of the US administration, Eurozone elections, and the ongoing Brexit discussions, financial markets appear to be experiencing a relative calm (ECB, 2017).12
12 European Central Bank (2017), ‘Financial Stability Review’, (1), May 2017, Frankfurt.
-1.00 0.00 1.00 2.00 3.00 4.00 5.00 6.00
FIGURE 13 EURO OVERNIGHT INDEX AVERAGE (%)
Source: European Central Bank, Statistical Data Warehouse
However, while the European economy has begun to show signs of a cyclical recovery thus providing a boost to the macro-financial backdrop, the degree to which accommodative monetary policy is reducing market tensions may lead to risks arising if the ECB pull back towards a more normalised monetary policy stance. At their most recent governing council, the ECB held benchmark rates at historic low levels but reduced the scope of asset purchases. The implications of these developments for Ireland are discussed in detail in Box 3.
One of the implications of the expansionary monetary policy has been a compression of sovereign bond yields. The Public Sector Asset Purchase Programme has been purchasing government securities on the secondary market since March 2015, putting downward pressure on yields. Ireland has been a major beneficiary with a net cumulative €23 billion worth of bonds purchased to date (net of redemptions). Coupling the monetary policy stance with the economic recovery and the successful completion of the official financing support programme, the cost of debt for the Irish sovereign has declined to historic lows, and remains only a number of percentage points above the benchmark German rate (Figure 14).
FIGURE 14 TEN-YEAR GOVERNMENT BOND YIELD (%)
Source: St. Louis Fed database.
Trends in lending
While the overall financing environment has become more benign in recent months, what matters for Irish economic growth is how these developments translate in new flows of lending and the cost of borrowing for Irish households and firms. Figure 15 presents the growth rates of credit to households from Irish resident credit institutions. The data are split by loans for house purchase and other personal loans (auto finance, credit cards, student loans etc.). Overall, the change in credit for house purchase continues to decline, down -0.6 per cent year-on-year to Q2 2017. However, a distinguishing feature of 2016 and the first quarter of 2017 has been a reduction in the pace of deleveraging or credit contraction; the rate of decline has moderated from -2.2 per cent in Q2 2017, pointing towards a further stabilisation of the sector.
In Q2 2017, we observe an increase in the growth rate of lending for non-housing related household loans, which are now up 6.2 per cent on a year-on-year basis. As these loans are mainly for consumption purposes and auto financing, the broader recovery in household spending is undoubtedly leading to an increase in demand for this type of financing.
-5.00 0.00 5.00 10.00 15.00 20.00 25.00 30.00 35.00
FIGURE 15 YEAR-ON-YEAR GROWTH RATE OF CREDIT TO HOUSEHOLDS (%)
Sources: Central Bank of Ireland, Credit, Money and Banking Statistics.
Notes: Data are taken from Central Bank of Ireland data release A.18, growth rates series codes 777 and 1,252.
Turning to the provision of credit to non-financial corporations, the overall stock of credit is continuing to decline, down by -11 per cent in Q2 2017 year-on-year. As noted in the previous Commentary, this represents an acceleration in the pace of deleveraging which runs counter to the findings for households. However, there is an important compositional factor to consider with this series. Credit to firms outside the financial and property related sectors, which can be thought of as finance for the real economy, in fact grew by 1.9 per cent in Q2 2017 which represents an acceleration relative to 0.6 per cent growth in Q1 2017. In terms of financing growth for Irish businesses following the crisis, it is noteworthy to see credit flows beginning to pick up. The overall fall in private sector enterprise credit continues to be driven by deleveraging amongst financial sector and property related firms.
-20 -10 0 10 20 30 40
FIGURE 16 YEAR-ON-YEAR GROWTH RATE OF CREDIT TO PRIVATE SECTOR ENTERPRISES (%)
Sources: Central Bank of Ireland, Credit, Money and Banking Statistics.
Notes: Data are taken from Central Bank of Ireland data release A.14, growth rates series codes 17, 17.1 and 17.2.
While monitoring the stock of lending is important from the perspective of risk, understanding new lending flows is critical for growth as these funds directly cover new investments and spending. In terms of new mortgage lending, the significant increase in house prices in the past number of months has begun to coincide with greater rates of mortgage lending. In Q3 2017, the volume of new mortgage drawdowns increased by 16 per cent year-on-year and the value of mortgages increased by 29 per cent year-on-year. The relatively higher growth rate in the value relative to the volume of loans represents the fact that borrowers are drawing down larger and larger loans given rising house prices. The average loan size for mortgages was €221,748 in Q3 2017 which is 87 per cent of the peak value in Q1 2008. Indeed, the value of new drawdowns exceeded €2 billion for the third quarter of 2017, for the first time since 2009, which is an indication of heightened credit market activity. McQuinn (2017) finds that Irish house price growth in the recovery has occurred without a significant increase in credit expansion. With the credit market beginning to grow rapidly, strict monitoring of these developments is required to ensure a house price-credit spiral does not materialise.
-20.0 -10.0 0.0 10.0 20.0 30.0 40.0 50.0
Total
Total ex Financial Intermediation
FIGURE 17 YEAR-ON-YEAR GROWTH RATE OF NEW MORTGAGE DRAWDOWNS (%)
Sources: Banking and Payments Federation Ireland.
The increase in mortgage lending, and greater loan sizes, must be assessed in terms of the potential financial stability risk. Given the low base from which mortgage credit is growing, and the current credit conditions under which lending is taking place, we continue to hold the view of the previous Commentary that the credit risk of new lending is low and as such does not at present pose a threat to banking sector stability.
The most recent mortgage market overview provided by Kinghan et al. (2017)13
covers lending for the first six months of this year, the first period in which banks have been operating under the changes to the macroprudential regulations announced in November 2016. It is also a period in which the Government Help-to-Buy scheme was fully operational. A number of insights from this research are important to highlight. First, the banks appear to be fully exploiting the allowances to exceed the mortgage caps – 18 per cent of the value of loans were allowed to breach the LTI limit (max 20 per cent) and 20 per cent of second time borrowers were allowed an LTV over 80 per cent which is also at the regulatory maximum. While the average LTI and LTV ratios for FTBs and SSBs remain well below the macroprudential restrictions, there does appear to be some drift towards higher leverage across all borrowers. For example Figure 3 of Kinghan et al. (2017), shows that nearly 40 per cent of first time buyers are drawing down loans at 90 per cent LTV which is an increase on the previous year. An excessive
13 Kinghan, C., P. Lyons and Y. McCarthy (2017). ‘Macroprudential Measures and Irish Mortgage Lending: Insights from
H1 2017’, Central Bank of Ireland, Economic Letter No. 13.
-80.0 -60.0 -40.0 -20.0 0.0 20.0 40.0 60.0 80.0 100.0
concentration of high LTV loans can leave borrowers exposed to the risk of moving into negative equity following any reduction in property prices. However, the recent Household Credit Market Report shows very few loans are being extended with a repayment burden above 25 per cent of gross monthly income. This evidence would appear to indicate conservative credit risk assessment.
On the current evidence, credit risks would appear to be moderate given the credit conditions of new lending. While the drift towards a higher share of FTBs at 90 per cent LTV is noteworthy, the income restriction at 3.5 times gross income is lower than international peers thus providing good protection against borrowers over-extending themselves in an affordability context. Therefore, there would appear to be little evidence to suggest a policy tightening is required over and above the changes just announced by the Central Bank.
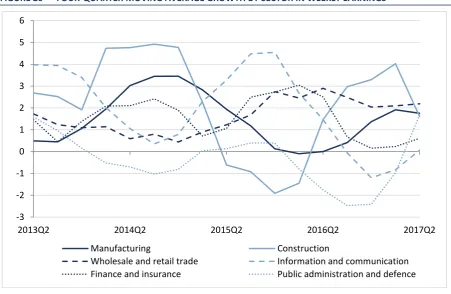
Another aspect of new lending that provides a guide to the health of the domestic economy is lending to small business. More recently, loans to Irish small- and medium-sized enterprises (SMEs) have grown steadily in 2016 (Figure 18). This continues the trend in overall SME lending which began to increase in 2015 from mid-2014 lows. Gross new lending was €1,230 billion in Q2 2017, up from €1,173 million one year earlier. Of note is the sectoral allocation of new financing which has begun to re-orientate towards the construction and domestically non-traded sectors more recently. Increased credit extension to these sectors is consistent with the broadening of the recovery in the domestic economy.
FIGURE 18 QUARTERLY NEW LENDING TO IRISH SMES BY SECTOR (FOUR-QUARTER ROLLING AVERAGE)
Sources: Banking and Payments Federation Ireland.
0 200 400 600 800 1000 1200 1400 20 10Q 4 20 11Q 2 20 11Q 4 20 12Q 2 20 12Q 4 20 13Q 2 20 13Q 4 20 14Q 2 20 14Q 4 20 15Q 2 20 15Q 4 20 16Q 2 20 16Q 4 20 17Q 2 Other
Business Services including ICT and Finance
Hotels and Restaurants Wholesale and Retail Construction and Real Estate Manufacturing, Transport and Utillities
Interest rates and the cost of finance
The cost of finance in Ireland for both corporate and household credit has been high by European standards. The standard variable rate on new mortgage loans in Ireland stood at 3.41 per cent as of Q3 2017; this is down slightly year-on-year from 3.47 in Q3 2016 but a moderate increase over the first two quarters of 2017. However, comparing Irish new house purchase loans relative to other Eurozone economies, it can be seen that new lending rates are the highest of the comparison group (Figure 19). As of August 2017, interest rates on new house purchase in Ireland were nearly 1.2 per cent higher than the median of the other countries presented. This gap has widened since mid-2014 when Irish interest rates began to decouple from the ECB policy rate.
FIGURE 19 INTEREST RATES ON NEW HOUSE PURCHASE LOANS TO HOUSEHOLDS – EUROPEAN COMPARISON
Source: ECB MFI data.
Notes: Countries included are: AT, BE, EE, ES, FI, FR, IE, IT, LT, NL, PT, SI. These countries are selected due to data availability. Data differ between this chart presented and the text as the ECB comparison data include restructured mortgages whereas the new business standard variable rate is only for new drawdowns.
A similar picture emerges in relation to corporate interest rates. Figure 20 presents the interest rates on new business loans for non-financial corporations in Ireland relative to the average for the Eurozone. Two series are presented: 1) covering all loans and 2) capturing loans of < €250,000, which is used as a proxy for loans for SMEs. In August 2017, the average rate on new loans for all Irish corporates was 2.54 per cent and the Eurozone average was 1.74 per cent. For small Irish corporate loans, the interest rate in June 2017 was 5.2 per cent
0 1 2 3 4 5 6 7 8
compared to the Eurozone average of 2.52 per cent. Interest rates are down year-on-year for small corporates but remain considerably higher than for their European peers.
FIGURE 20 INTEREST RATES ON LOANS TO NON-FINANCIAL CORPORATIONS – EUROPEAN COMPARISON
Sources: ECB MFI data. Small loans refer to loans less than €250,000.
The very evident dislocation in the transmission of policy rates to lending rates in Ireland which has occurred since 2014 poses challenges for the effectiveness of monetary policy. Box 3 below discusses the implications for Ireland of the current ECB policy stance and what risks might accompany a normalisation of policy rates.
BOX 3 TOWARDS A NORMALISATION OF MONETARY POLICY? UNDERSTANDING THE ECB POLICY STANCE AND ITS IMPLICATIONS FOR IRELAND
Overview
In line with moves by the US Federal Reserve, Bank of England and Bank of Japan, the European Central Bank began lowering policy rates in response to the dramatic deterioration in financial and economic conditions following the collapse of Lehman Brothers in 2008. The ECB aggressively reduced policy rates between July 2008 and May 2009 by 325 basis points to just over 1 per cent (MRO).14 Figure A below plots the
evolution of the three main ECB policy rates (MRO, deposit facility and MLF) from 2003
14 Stark (2009) ‘Monetary policy, before, during and after the financial crisis’, Speech at Tubingen University.
0 1 2 3 4 5 6 7 8
to present. The explicit objective of the European Central Bank in terms of monetary policy operations is to ensure price stability as measured by a Eurozone inflation rate of close to, but below, 2 per cent over the medium term. However, the ongoing sovereign debt and banking crises, coupled with the backdrop of muted inflation, led to a major expansion in both the toolkit and the monetary policy stance of the ECB. Further rate reductions followed through to March 2016 when the deposit rate was set to -0.4 per cent, the MRO to 0, and the MLF to 0.25 per cent.15
FIGURE A EVOLUTION OF ECB POLICY RATES (%)
Source: European Central Bank.
Faced with the dual challenge of operating monetary policy at the zero lower bound as well as the unprecedented financial and economic crisis in the Eurozone, the ECB introduced a range of unconventional monetary policy instruments to address the risks to persistent low inflation. The most extensive of these was the series of Asset Purchase Programmes which act to purchase public and private securities in the secondary market. Four main programmes are operational: a corporate sector purchase programme; a public sector purchase programme; an asset backed securities purchase programme; and a series of covered bond purchase programmes. Across the programmes, between April 2016 to March 2017, the monthly net purchases amounted to €80 billion up from €60 billion over the period March 2015 to March
15 The ECB maintains three key interest rates. First, the interest rate on the main refinancing operations (MRO),
provides the bulk of liquidity to the banking system. Second, the rate on the deposit facility for banks to make overnight deposits with the Eurosystem and finally the rate on the marginal lending facility, which offers overnight credit to banks from the Eurosystem.
-0.5 0.5 1.5 2.5 3.5 4.5 5.5 6.5
Jan Jul Jan Jul Jan Jul Jan Jul Jan Jul Jan Jul Jan Jul Jan Jul Jan Jul Jan Jul Jan Jul Jan Jul Jan Jul Jan Jul Jan Jul
2016. While a full overview of these programmes and their effectiveness is outside the scope of this box, the measures can certainly be said to have stabilised financial markets as well as providing a reduction in borrowing costs for banks and sovereigns across the Eurozone.16
Recent Monetary Policy Developments
At the recent Governing Council meeting in October, the ECB voted to maintain key policy interest rates at historic levels and their forward guidance indicated rates would remain at the current level for the foreseeable future, more specifically past the duration of the current asset purchase programme.17 However, in a first move towards weaning the European
economy off the extensive monetary stimulus, in relation to the APP, the ECB indicated a reduction in the level of net asset purchases from the current €60 billion per month to €30 billion per month out to end September 2018. The adjustment to the asset purchase programme reflects the ECB’s growing confidence in the gradual convergence of inflation rates towards the stated objective. This confidence is fuelled by the ongoing recovery as well as the increase in observed measures of underlying inflation. However, the ECB noted that domestic price pressures continued to be muted and the economic outlook as well as the path of inflation continue to require extensive monetary support. They also indicated a willingness to re-invigorate the APP and increase the size of the intervention if the outlook deteriorates or if financial conditions become inconsistent with a sustained adjustment in the inflation path.
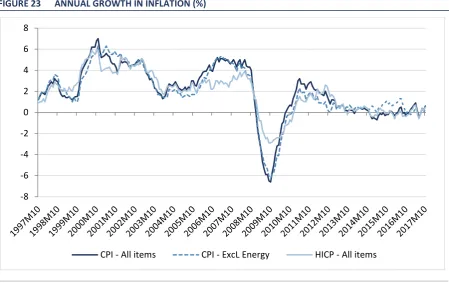
FIGURE B EUROZONE INFLATION (%)
Sources: ECB Statistical Data Warehouse.
16 European Central Bank (2015) ‘The Governing Council’s Expanded Asset Purchase Programme’, Box 1, Monthly
Bulletin, Issue 1.
17 European Central Bank (2017), Press Release to Accompany Governing Council Briefing, 27/10/2017.
-1 0 1 2 3 4 5 19 97J an 19 97Se p 19 98M ay 19 99J an 19 99Se p 20 00M ay 20 01J an 20 01Se p 20 02M ay 20 03J an 20 03Se p 20 04M ay 20 05J an 20 05Se p 20 06M ay 20 07J an 20 07Se p 20 08M ay 20 09J an 20 09Se p 20 10M ay 20 11J an 20 11Se p 20 12M ay 20 13J an 20 13Se p 20 14M ay 20 15J an 20 15Se p 20 16M ay 20 17J an 20 17Se p
Given the 2017 moves by the US Federal Reserve to raise base policy rates and provide forward guidance for future rate rises, the focus must be on when the ECB will begin the process of further normalisation.
Exploring the consequences for Ireland
While it is not necessarily on the immediate horizon, it is noteworthy to explore what the consequences of any re-normalisation of monetary policy operations would be for Ireland. The effects of a reduction in non-standard instruments as well as increases in policy interest rates, by decreasing the volume of liquidity and increasing the cost of finance, are twofold: 1) they have an impact on sovereign and financial institution funding and lending and 2) they have an impact on real economic activity through households and firms.
In terms of the funding activity, the Irish State has been a beneficiary of the ECB asset purchase programme as this has reduced yields on government debt allowing a reduction in the cost of servicing the state liabilities. The low funding cost environment also provides financial institutions with the opportunity to lower their cost of financing – in particular on low yielding deposits – and increase their lending margins. If monetary policy was to become less accommodative and funding costs were to rise, this would inevitably increase the cost of financing to the State as well as increasing the cost of funds for financial institutions which have a negative influence on the public finances, as well as potentially act as a limiting factor on lending. From a fiscal policy perspective, this would limit the fiscal space available in future budgets. However it must be noted that the overall economy and the public finances are in a much better position currently so any reversal in rates may not lead to a significant increase in sovereign borrowing costs.
In regard to the real activity of households and enterprises, if any increase in the policy rate were to be passed through to households or firms this would ultimately act to reduce their consumption of goods and services as well as moderating the investment activity of firms. This would occur primarily though the cost of new loans but it would also increase the debt service burden of Irish households’ and firms’ existing liabilities. As both of these groups are highly indebted from the Irish crisis, any increase in the cost of credit could lead to higher levels of loan defaults. In particular for households with large debt overhangs from the crisis, any increase in rates could seriously affect their ability to service debts and in turn lower their consumption.
contribution of consumption to Irish growth currently, any such reduction in loan affordability may act as a drag on household spending.
Assessing the extent to which rate rises would be passed through is complicated in Ireland due to the current structure of the banking market. The interest rates on most mortgage, consumer and corporate loans in Ireland are variable in nature, thereby allowing financial institutions to pass through rate changes directly to households. The Central Bank’s most recent Household Credit Market Report shows that approximately 86 per cent of mortgages are on a variable interest rate (either standard variable or tracker). While historically Irish banks would pass on policy rate changes (both positive and negative) to customers, since the beginning of 2009, this transmission channel has broken down and lending rates have remained stubbornly high in the face of ECB rate reductions. Figure C below clearly shows how the policy rate pass-through to loans across all types of borrower (consumer, mortgage and corporate) has broken down in recent years.
FIGURE C ECB POLICY RATE PASS-THROUGH TO IRISH LENDING RATES (%)
Sources: ECB and Central Bank of Ireland.
While a number of factors are undoubtedly contributing to the high lending rates in Ireland such as high credit risk, cost of funding and regulatory changes, and the high share of loss making tracker loans on the banks’ books, the reduction in the degree of competition in the market is undoubtedly playing a role (Goggin et al., 2011). McQuinn and Morley (2015) find that the main reason for the breakdown in pass-through between the policy rate and the standard variable rate in Ireland is weak competition in the Irish financial sector.