O R I G I N A L A R T I C L E
Adaptive sequence evolution is driven by biotic stress in a
pair of orchid species (
Dactylorhiza
) with distinct ecological
optima
Francisco Balao
1,2|
Emiliano Trucchi
1,3|
Thomas M. Wolfe
1,4|
Bao-Hai Hao
1|
Maria Teresa Lorenzo
1,2|
Juliane Baar
1|
Laura Sedman
5|
Carolin Kosiol
6,7|
Fabian Amman
8|
Mark W. Chase
9,10|
Mikael Hedr
en
11|
Ovidiu Paun
11
Department of Botany and Biodiversity Research, University of Vienna, Vienna, Austria
2Departamento de Biolog
ıa Vegetal y
Ecologıa, University of Seville, Sevilla, Spain
3
Department of Life Sciences and Biotechnologies, University of Ferrara, Ferrara, Italy
4
Vienna Graduate School of Population Genetics, Vienna, Austria
5
Gregor Mendel Institute for Plant Molecular Biology, Vienna, Austria
6Institut f€
ur Populationsgenetik, Vetmeduni Vienna, Vienna, Austria
7
Centre of Biological Diversity, School of Biology, University of St Andrews, St Andrews, UK
8
Department of Chromosome Biology, University of Vienna, Vienna, Austria
9
Royal Botanic Gardens Kew, Richmond, UK
10
School of Plant Biology, University of Western Australia, Crawley, Perth, WA, Australia
11
Department of Biology, Lund University, Lund, Sweden
Correspondence
Ovidiu Paun, Department of Botany and Biodiversity Research, University of Vienna, Vienna, Austria.
Email: [email protected]
Abstract
The orchid family is the largest in the angiosperms, but little is known about the
molecular basis of the significant variation they exhibit. We investigate here the
transcriptomic divergence between two European terrestrial orchids,
Dactylorhiza
incarnata
and
Dactylorhiza fuchsii
, and integrate these results in the context of their
distinct ecologies that we also document. Clear signals of lineage-specific adaptive
evolution of protein-coding sequences are identified, notably targeting elements of
biotic defence, including both physical and chemical adaptations in the context of
divergent pools of pathogens and herbivores. In turn, a substantial regulatory
diver-gence between the two species appears linked to adaptation/acclimation to abiotic
conditions. Several of the pathways affected by differential expression are also
tar-geted by deviating post-transcriptional regulation via sRNAs. Finally,
D. incarnata
appears to suffer from insufficient sRNA control over the activity of
RNA-depen-dent DNA polymerase, resulting in increased activity of class I transposable
ele-ments and, over time, in larger genome size than that of
D. fuchsii
. The extensive
molecular divergence between the two species suggests significant genomic and
transcriptomic shock in their hybrids and offers insights into the difficulty of
coexis-tence at the homoploid level. Altogether, biological response to selection,
accumu-lated
during
the
history
of
these
orchids,
appears
governed
by
their
microenvironmental context, in which biotic and abiotic pressures act synergistically
to shape transcriptome structure, expression and regulation.
K E Y W O R D S
abiotic stress, defence, ecological divergence, positive selection, small RNAs, transcriptomics
Funding information
Austrian Science Fund, Grant/Award Number: Y661-B16; Marie Curie IEF Fellowship, Grant/Award Number: PERG-GA-2011-299608-TRANSADAPTATION
-This is an open access article under the terms of the Creative Commons Attribution License, which permits use, distribution and reproduction in any medium, provided the original work is properly cited.
©2017 The Authors.Molecular EcologyPublished by John Wiley & Sons Ltd.
1
|
I N T R O D U C T I O N
The orchid family represents an extraordinary biological
diversifica-tion, containing over 8% of all flowering plant species, making
Orchidaceae the largest family of angiosperms (Chase et al., 2015;
Givnish et al., 2015). They are distributed from equatorial lowlands
to arctic and alpine locations, through a remarkable variability,
affecting their morphology, ecology, genomes and life history
strategies (Benzing, 1986). Orchids are particularly renowned for
their specialized and diverse pollination systems (Darwin, 1877),
and pollinator-driven isolation is often discussed as a main factor
driving their diversification (Benzing, 1986; Cozzolino & Widmer,
2005). However, a third of all orchids are estimated to be
polli-nated on a deceptive basis (i.e., they offer no reward, Tremblay,
Ackerman, Zimmerman, & Calvo, 2005), often with the help of
unspecific pollinators. Indeed, pollinator-mediated reproductive
iso-lation has been shown to play little or no role in food-deceptive
orchids (Moccia, Widmer, & Cozzolino, 2007).
Other factors put forward to explain orchid diversity range from
epiphytism (Gravendeel, Smithson, Slik, & Schuiteman, 2004;
Sil-vera, Santiago, Cushman, & Winter, 2009), low fruiting success
set-ting the stage for a dynamic interplay between drift and natural
selection (Tremblay et al., 2005), obligate orchid–mycorrhiza
interac-tions (Tupac Otero & Flanagan, 2006), CAM photosynthesis and
tropical distribution (Silvera et al., 2009) or a combination of these
factors (Givnish et al., 2015). In general, orchid species diversity
has been reported to correlate to area size and, even more
strongly, with habitat heterogeneity (e.g., with maximum island
ele-vation as a surrogate for habitat diversity in the Caribbean,
Acker-man, Trejo-Torres, & Crespo-Chuy, 2007), indicating that ecological
conditions may be a major driver of diversity in the family.
How-ever, only little is known about the molecular factors underlying
divergence between orchid species, mainly due to
disproportion-ately limited genomic data in public databases despite the recent
availability of a reference genome for Phalaenopsis equestris (Cai
et al., 2015).
The molecular basis of biodiversity can reside in both amino acid
sequence variation (Nielsen, 2005) and regulatory divergence that
triggers protein abundance shifts (Wray, 2007), and these molecular
components may evolve at different rates. For example,
accumulat-ing evidence suggests a role for divergent small RNAs (sRNAs) and
other regulatory elements in postzygotic reproductive isolation, and
the hybrid incompatibility they trigger is predicted to evolve
rela-tively early in the speciation process (Ha, Pang, Agarwal, & Chen,
2008; Hollister et al., 2011; Kitano, Yoshida, & Suzuki, 2013;
McManus et al., 2010; Michalak, 2008). Small RNAs, including plant
microRNAs (miRNAs), secondary small interfering RNAs (siRNAs)
and heterochromatic small interfering RNAs (hetsiRNAs, Borges &
Martienssen, 2015), are involved in (post)transcriptional gene
regula-tion, RNA-directed DNA methylation and chromatin remodelling,
playing major roles in the maintenance of genome stability and
function (Zhang, 2008). Importantly, regulatory divergence is
gener-ally dynamic, potentigener-ally exposing phenotypes to natural selection
differentially across time and environmental conditions. Biological
responses to selection depend heavily on the environmental
con-text, with regard to biotic and abiotic conditions that can act
indi-vidually or synergistically to either accelerate or constrain trait
evolution (Anderson, Wagner, Rushworth, Prasad, & Mitchell-Olds,
2014). Understanding the extent and timescale of the interactions
between different molecular levels in response to the plethora of
characteristics of complex environments is a primary goal of
evolu-tionary biology.
In this study, we aimed to investigate the molecular basis of
adaptation to specific microenvironments inDactylorhiza fuchsii and
D. incarnata, two terrestrial, food-deceptive orchid species (Sletvold,
Grindeland, &Agren, 2010) that provide a suitable model to trace
effects of natural selection. The two orchid species broadly share
geographical distribution (northern and central Europe and Western
Asia, Tutin et al., 1980) and often grow in proximity. However,
they have clearly distinct morphologies and also differ in their
eco-logical preference (Paun et al., 2011). Dactylorhiza fuchsii inhabits
grasslands, open woods and disturbed habitats such as road
mar-gins, whereasD. incarnata prefers marshes, fens and bog habitats.
The genetic structure of the two species has most likely been
shaped by different histories as, in contrast to D. fuchsii, D.
incar-nataappears to have experienced a dramatic reduction in
popula-tion size that homogenized its genetic variapopula-tion at neutral markers
(Balao, Tannh€auser, Lorenzo, Hedren, & Paun, 2016; Hedren, 1996;
Pillon et al., 2007), despite its current wide distribution and its
sig-nificant morphological heterogeneity. The two species have
hybri-dized on multiple occasions, producing an array of ecologically
divergent allotetraploid sibling species (Devos, Raspe, Oh, Tyteca, &
Jacquemart, 2006; Hedren, 1996; Hedren, Fay, & Chase, 2001;
Pil-lon et al., 2007), several of which are also broadly distributed in
Europe.
With RNAseq across several replicates originating from
different European regions, we searched for genes with
lineage-specific evolutionary patterns shaped by positive selection, and
tested for differential expression (DE) that correlate to phenotypic
divergence between the two species (De Wit, Pespeni, & Palumbi,
2015). We further aimed to time the divergence between the
two species and tested whether the coding single nucleotide
polymorphism (cSNP) patterns obtained follow the low neutral
genetic diversity in D. incarnata. Finally, we sequenced sRNAs
to track divergent post-transcriptional gene regulation (Ehrenreich
& Purugganan, 2008). One specific aim within the latter analysis
was to search for a potential deviating negative control of
transposable elements (TEs) that may have resulted in the
differ-ence in genome size between the two species (1C values:
3.55 pg forD. incarnata vs. 2.98 pg for D. fuchsii, Aagaard, Sastad,
Greilhuber, & Moen, 2005). Besides understanding in detail the
molecular divergence between the diploid orchid species, this
work is also setting a foundation for further studies of the
molec-ular principles underlying widespread allopolyploidy in this orchid
group and its impact on evolutionary novelty and ecological
2
|
M A T E R I A L S A N D M E T H O D S
2.1
|
RNAseq and de novo transcriptome assemblies
We sequenced leaf RNAseq libraries (see Appendix S1) of five wild
individuals each of D. fuchsii and D. incarnata from different
Euro-pean regions (Table 1, Fig. S1) after they had been transplanted and
grown in a common garden in Vienna, Austria, for at least one
growth cycle in order to remove temporary environmental effects.
Every year, Dactylorhiza plants produce a new tuber that carries
them through to the next year. We focused on leaves as an
ecologi-cally relevant tissue, which also avoids potential contamination by
mycorrhizal fungi associated with orchid roots. Across the individuals
analysed, the directional RNA sequencing generated almost 1.5
bil-lion pairs of 100-bp reads (Table 1).
As the closest assembled genome (P. equestris, Cai et al., 2015) is
highly divergent fromDactylorhiza(their most recent common
ances-tor lived 55–70 Ma, Givnish et al., 2015), we have assembled de
novo withTrinity(Haas et al., 2013) a combined reference
transcrip-tome for bothDactylorhizaspecies (for details see Appendix S1 and
Fig. S2). The individual transcriptomes are available from GenBank
Transcriptome Shotgun Assembly (TSA) Database (Accession nos.:
GFHX00000000 and GFJV00000000 forD. fuchsiiandD. incarnata,
respectively). The combined final transcriptome is available from
https://plantgenomics.univie.ac.at/downloads/. Due to its low
num-ber of assembled contigs pointing to a technical depletion of
com-plexity, and due to its outlier position in ordination analyses, the
individual fA6 was excluded from all further RNAseq analyses.
2.2
|
Variant discovery and assessment of genetic
diversity
In order to conduct evolutionary analyses, the filtered RNAseq reads
were mapped to an available, closely related outgroup reference, the
transcriptome ofOrchis italica(De Paolo, Salvemini, Gaudio, & Aceto,
2014), which is a member of the same orchid subtribe (Chase et al.,
2015). The mapping has been performed with the second-pass
approach (Engstrom et al., 2013) of€ STAR V2.4.1d (Dobin et al., 2013),
by lowering the maximum allowed ratio of mismatches to read
length to 0.11. The best practices recommendations (DePristo et al.,
2011; Van Auwera et al., 2013) for GATKversion 3 (McKenna et al.,
2010) have been followed, but with a hybrid approach between
RNA and DNA sequencing as the analyses have been performed on
a reference transcriptome, not a full genome. After processing the
BAM files by adding read groups and removing duplicates with
PI-CARD TOOLS (v.1.119, http://broadinstitute.github.io/picard/), we split
the reads into exon segments and reassignedSTARmapping qualities.
TheINDELREALIGNERmodule fromGATK v3.5-0-g36282e4 was used to
improve local alignments around indels, downsampling to a maximum
of 1009 coverage. Variants were further called for each sample in
the GVCF mode of theGATK HAPLOTYPECALLERto generate an
interme-diate gVCF, by ignoring any soft clipped bases in the reads to
mini-mize false positives and negative calls. Next, we processed all
samples in the cohort in a joint genotyping analysis with
GENOTYPE-GVCFSwith the minimum Phred-scaled confidence threshold of 20 at
which variants should be called and emitted, following GATK best
practices recommendations for RNAseq. After retaining only SNPs
with theSELECTVARIANTSmodule ofGATKto avoid later uncertainties in
alignments, variants have been further filtered out if any of the
fol-lowing criteria were fulfilled: the quality normalized by the coverage
(QD) was <2.0, the Phred-scaled p-value for Fisher’s exact test to
detect strand bias (FS) was>60.0, or the root mean square of
map-ping quality across all samples (MQ) was <40. Diversity measures
were calculated with VCFTOOLS V.0.1.14 (Danecek et al., 2011) with
the options–het (for the per-individual heterozygosity and
inbreed-ing coefficientF),–site-pi (for per site nucleotide divergencep) and–
singletons (for private alleles).
T A B L E 1 Details of the leaf samples analysed in this study
Region No. Acronym Collectors Latitude/Longitude
Raw pairs of RNAseq reads (M)
Raw sRNAseq reads (M) D. fuchsii
Pannonian 1566 fA6 GS, OP 47°53041″N 19°52001″E 226.8 16.7
Pyrenees 1001 fP1 MC, MF, OP 43°12043″N 0°49050″E 79.4 23.8
Pyrenees 1707 fP7 OP 42°53040″N 1°55046″E 166.0a 21.8
Britain 1804 fB4 FB, OP 54°15010″N 0°41006″W 107.1 18.6
Britain 1855 fB5 FB, OP 57°40003″N 7°14032″W 224.3 10.4
D. incarnata
Alps 1586 iA6 OP 47°16054″N 11°11004″E 199.8 5.3
Scandinavia 1904 iS4 MH 57°20026″N 18°19016″E 82.0 13.1
Scandinavia 1908 iS8 MH 57°49001″N 18°53043″E 201.1 8.9
Britain 1176 iB6 RB 57°40019″N 7°14017″W 101.0
-Britain 1870 iB0 FB, OP 57°40014″N 7°14022″W 75.4 7.7
Collector abbreviations are FB, Francisco Balao; GS, Gabor Szramko; MC, Mark Chase; MF, Michael Fay; MH, Mikael Hedren; OP, Ovidiu Paun and RB, Richard Bateman.
[image:3.595.44.556.508.699.2]For visualizing genetic relationships between individuals, we
fil-tered out withVCFTOOLSthe variants with data in less than six (of the
nine)Dactylorhizaindividuals. The 449,518 retained SNPs were
fur-ther concatenated to a Phylip file withPGDSPIDER V.2.0.9.2 (Lischer &
Excoffier, 2012), summarizing heterozygosities as IUPAC ambiguities.
A maximum-likelihood phylogenetic tree with 1,000 rapid bootstrap
inferences and a GTRCAT substitution model were inferred with
RAXML V.7.2.8 (Stamatakis, 2014) and the results were graphically
visualized with FIGTREE V.1.4.2 (available from http://tree.bio.ed.ac.
uk/software/figtree/).
The genetic similarity among individuals of the two Dactylorhiza
species was also visualized with a principal component analysis
(PCA). The data were first filtered with VCFTOOLS by retaining only
SNPs with the minor allele present in at least two individuals. The
retained 129,511 biallelic SNPs were imported in theBIOCONDUCTOR
(Huber et al., 2015) withGDSFMT, and the PCA was finally drawn with
theRpackageSNPRELATE(Zheng et al., 2012).
2.3
|
Rates of sequence evolution and targets of
selection
Synthetic transcripts of each sample have been generated from the
GATK-filtered vcf file with theGATK FASTAALTERNATEREFERENCEMAKER, using
IUPAC encodings for heterozygote states. We further used for each
sample theGATK CALLABLELOCI with default settings to filter only the
callable transcriptomic intervals. These have been intersected with
BEDTOOLS V.2.25.0 (Quinlan & Hall, 2010) with exonic regions of the
O. italicareference predicted withTRANSDECODER(v.2.0.1, https://trans
decoder.github.io/). BEDTOOLS GETFASTAhas been used to retain from
each individual only the target intervals. Finally, indel-free coding
DNA sequence (CDS) alignments of at least 150-bp coding regions
have been retained for positive selection analyses.
Nonsynonymous (Ka) and synonymous (Ks) substitution rates for
CDS alignments of pairwise combinations of sequences ofD. fuchsii,
D. incarnataandO. italicawere first calculated using an approximate
method (MYN) modified after Yang and Nielsen (2000) and
imple-mented in the software packageKAKS_CALCULATOR V.2.0 (Zhang, Li, &
Yu, 2006). The level of significance of Fisher’s exact tests was
adjusted with the false discovery rate (FDR) approach with theP.
AD-JUSTfunction inR. The contigs shown to be under positive selection
(i.e., Ka/Ks>1) between D. incarnata and D. fuchsii within an FDR
level <0.1 have been confirmed by estimating pairwise dN/dS (x)
with a maximum-likelihood method implemented in CODEML of the
PAMLpackage v.4.8a (Danecek et al., 2011). To test for statistical
sig-nificance (p<.05), a likelihood ratio test was applied against a model
with fixedx=1 (Wong, Yang, Goldman, & Nielsen, 2004). We
fur-ther aimed to detect the particular branch on which positive
selec-tion acted by performing branch-site model tests M1a versus M2a
(Zhang, Nielsen, & Yang, 2005) in CODEML, comparing models with
estimatedɷversus the corresponding null models with fixedx=1
along theD. fuchsiibranch, and theD. incarnatabranch, respectively.
A simple phylogenetic tree has been used for the inference as
((D. fuchsii, D. incarnata), O. italica)). Using the initial list of tested
contigs as reference set and the genes under positive selection on
each branch as the test sets, GO term enrichments were determined
with Fisher’s exact tests and ap-value<.01 inBLAST2GOto place the
genes in a meaningful context. The GO terms were summarized with
REVIGOas explained above.
2.4
|
Abundance estimation
For analyses of DE, the filtered RNAseq reads were mapped to the
Dactylorhiza reference usingSTAR V.2.4.1b (Dobin et al., 2013) with
default settings allowing for up to 20 multiple mapping reads. A
uni-gene-level table of counts was obtained withCORSET V.1.04 (Davidson
& Oshlack, 2014), by filtering out any transcripts with fewer than 18
reads aligning over the nine samples.CORSETuses multimapping reads
to hierarchically cluster similar transcripts based on their expression
patterns and proportion of shared reads. Three different methods
within BIOCONDUCTOR were used for DE analyses, DESEQ2 V. 1.6.3
(Anders & Huber, 2010),BAYSEQ V. 2.0.50 (Hardcastle & Kelly, 2010)
and EDGER V. 3.8.6 (Robinson, McCarthy, & Smyth, 2010). Clusters
were considered DE if they were detected in each of the three
methods used at an FDR<0.05, in order to reduce the rate of false
positives. Using a custompythonscript, the longest transcript from
eachCORSET cluster was extracted and used for further GO
enrich-ment analyses in BLAST2GO V.3.2.7 (Conesa & G€otz, 2008). Fisher’s
exact tests were implemented at a thresholdp-value of .01, using as
the reference set the list of the longest contigs for each cluster in
the data. Overrepresented GO terms were then summarized using
REVIGO(http://revigo.irb.hr, Supek, Bosnjak,Skunca, & Smuc, 2011),
applying thinning based on semantic similarity with theSimRel
algo-rithm (Schlicker, Domingues, Rahnenf€uhrer, & Lengauer, 2006).
2.5
|
Small RNA analysis
For the sameDactylorhiza individuals used in the RNA sequencing
experiment (i.e., including individual fA6, but excluding iB6, for which
not enough leaf material was still available at this stage), we also
sequenced leaf sRNAseq libraries as multiplexed 50-bp single-end
Illumina libraries (see Appendix S1 and Table 1). After demultiplexing
and adapter removal, we selected for each accession the reads with
lengths from 20 to 22 nucleotides (hereafter“mi/tasiRNA”) and,
sep-arately, of 24 nucleotides (hereafter“siRNA”) and analysed them as
two classes. Length-selected sRNA reads were mapped to the
Dacty-lorhiza reference transcriptome using STAR V2.5.1b (Dobin et al.,
2013) not allowing for any mismatch (–outFilterMismatchNmax 0)
and discarding any read mapping to more than one contig (–
outFil-terMultimapNmax 0). These settings for mapping on theDactylorhiza
reference transcriptome were chosen to include only unambiguous
signals in further analyses. A replicated analysis allowing for one
mis-match produced consistent results. Read counts per contig were
fur-ther summarized in CORSET with default settings and the resulting
tables of counts were then imported intoR. Those contigs showing
less than 10 reads in at least three individuals in one of the two
RpackageEDASEQ(BIOCONDUCTOR) was used for sequencing depth
nor-malization among samples applying a nonlinear full quantile method.
A further normalization step based on a factor analysis of putative
nondifferentially regulated genes was performed. First, a set of
non-differentiated empirical control genes was produced in silico by
run-ning a preliminary analysis in EDGER (Robinson et al., 2010) and
selecting all genes scored as undifferentiated (FDR>0.95). This list
of empirical genes was then used as negative control in the RUVg
normalizing function in theR packageRUVSEQ(Risso, Ngai, Speed, &
Dudoit, 2014) removingk=2 factors of unwanted variation (k=1
or 3 were also tested). Results of the applied normalization were
checked by plotting the relative log expression (plotRLEfunction) and
the PCA (plotPCAfunction) across samples using theR package
EDA-SEQ. The model resulting from theRUVg analysis was then used in
EDGER, together with the group assignation, to implement the design
of the differential regulation analysis betweenD. fuchsiiandD.
incar-nata. TheglmLRTfunction was used inEDGERand a FDR<0.05 was
applied as a threshold for identifying differentially regulated
tran-scripts. Differentially overregulated contigs were used in GO
enrich-ment analyses in BLAST2GO. All transcriptome contigs were set as a
reference in Fisher’s exact tests and ap-value of .01 was applied as
a threshold. Overrepresented GOs were then visualized in REVIGO
as explained above.
2.6
|
Assessment of ecological divergence
We finally aimed to characterize interspecific ecological divergence
and place our transcriptomic results in this context. Locality
informa-tion was collected fromGlobal Biodiversity Information Facility(GBIF)
using the R package RGBIF (available from https://cran.r-project.org/
web/packages/rgbif). For robustness, we restricted the data set to
localities with known herbarium vouchers. A few additional localities
from our personal observations were also added. The geographical
information was converted into decimal degrees and cleaned by
removing exact duplicate localities. Locally dense sampling was finally
reduced by thinning the records to one per 10-km2grid cell. Based on
occurrence information at 298 localities for D. fuchsii and 393 for
D. incarnata, spatial environmental data were extracted withRASTER
(available from https://cran.r-project.org/web/packages/raster) from
Bioclim (www.worldclim.org/bioclim) and Landsat Tree Cover (http://
glcf.umd.edu/data/landsatTreecover/). We removed highly correlated
bioclimatic variables in the obtained data set using a threshold of 0.80
using the package CARET (available from https://cran.r-project.org/
web/packages/caret). This retained only seven of the 19 Bioclim
vari-ables for further analyses: annual mean temperature (BIO1), mean
diurnal temperature range (BIO2), isothermality (BIO3), mean
temper-ature of wettest quarter (BIO8), annual precipitation (BIO12),
precipi-tation seasonality (BIO15) and precipiprecipi-tation of warmest quarter
(BIO18). Ecological niche overlap between the two species was tested
withECOSPATv.1.1 (available from https://cran.r-project.org/web/pac
kages/ecospat). This method calculates the kernel smoothing
densi-ties of species occurrences and climatic variables along environmental
axes from a PCA. Then, niche overlap along these axes was assessed
with three statistical tests: niche similarity/equivalency (Broennimann
et al., 2012), Schoener’s D metric (Schoener, 1970) and a niche
diver-gence test (McCormack, Zellmer, & Knowles, 2010) based on the
dif-ferences in PCA scores between species in comparison with the
differences in scores for distinct“background regions”for each
spe-cies. For these tests, we extracted climate data from 2,000 randomly
selected points (background region). These points were randomly
selected from polygons around the projected coordinate occurrences
with a 10-km buffer. For the null distribution of D statistics, we used
1,000 replicates and a grid environmental value of 100. For the
differ-ences in PCA scores in the niche divergence test, to calculate the
95% confidence interval, we used a resampling approach based on
1,000 replicates of 500 samples for each species’background region.
Finally, soil pH at ca. 7 cm depth near 45 D. incarnata and 19
D. fuchsii plants has been measured with a Direct Soil pH Meter
HI99121 (Hanna Instruments) across nine and, respectively, five
pop-ulations from Britain, Scandinavia, Alps and Pyrenees between 2010
and 2015. The data have been summarized with box plots, and
sig-nificance of the differences between the pH preferences of the two
species has been tested with attest inR.
3
|
R E S U L T S
3.1
|
Variation analyses and rates of sequence
evolution
Mapping efficiency on theOrchisreference transcriptome ranged from
77% (fP1) to 87% (fB5) inD. fuchsiiand from 82% (iB0) to 87% (iA6)
forD. incarnataindividuals. Initially, theGATK(McKenna et al., 2010)
variant calling pipeline identified 23,185 indels and 727,350 SNPs in
the data. After retaining only SNPs and implementing a set of variant
filters in GATK, we retained 682,118 high-quality SNPs, of which
11,583 were multiallelic across the Dactylorhiza–Orchis group. The average transition/transversion rate found was 1.61. Heterozygosity
was higher in D. fuchsii individuals than in D. incarnata (Figure 1),
resulting in increased inbreeding coefficientFinD. incarnata(Table 2).
00
.1
D. fuchsii D. incarnata
0.05
Between individuals, diversity measures and the number of private
alleles were also higher inD. fuchsiiindividuals than those inD.
incar-nata(Table 2). A maximum-likelihood phylogenetic tree (Fig. S3) and a
PCA based on cSNPs (Fig. S4a) separated clearly the two species. Less
significant, but clear geographical patterns were also visible.
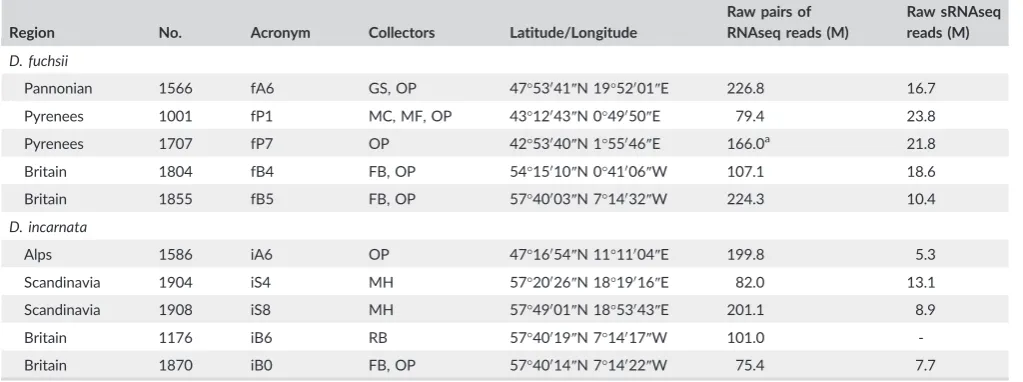
The positive selection analyses included 5,082, 3,290 and 2,923
indel-free pairwise CDS alignments longer than 150 bp forD.
fuch-sii–O. italica, D. incarnata–O. italica and D. fuchsii–D. incarnata, respectively (Table 3). The average values ofKsandKa, as indicated
by KAKS_CALCULATOR (Zhang et al., 2006) analyses, were similar for
bothDactylorhiza–Orchiscomparisons (i.e.,Ks=0.1 and, respectively,
Ka=0.02), whereas for theD. fuchsii–D. incarnatacomparison lower
values have been obtained as expected because of their more recent
divergence (Ks=0.062,Ka=0.014; Fig. S5). Based on theKsvalues
and the divergence time of ca. 16.75 Ma previously estimated for
the splitDactylorhiza–Orchis (Givnish et al., 2015; Inda, Pimentel, & Chase, 2012), the ancestral lineages of the twoDactylorhizaspecies
split around 10.4 Ma. Between 61% and 67% of transcripts with
alignments showed signs of purifying selection (i.e., Ka/Ks<1,
FDR<0.1; Table 3). For the pairD. fuchsii–D. incarnata,41 putative CDS were inferred to be under positive selection by the approximate
MYN method implemented in KAKS_CALCULATOR (i.e., Ka/Ks>1,
FDR<0.1), of which 35 (Appendix S2) were confirmed (i.e., x>1,
p<.05) with the maximum-likelihood approach implemented inPAML
(Yang, 2007). Among them,CODEMLbranch-site model tests have
indi-cated 18 CDS to be under positive selection on theD. fuchsiibranch
and 14 on theD. incarnata branch. Enrichment tests found for the
D. fuchsiiandD. incarnata branches 27 and 56 enriched GO terms,
respectively (Appendix S2), related mostly to response to stress,
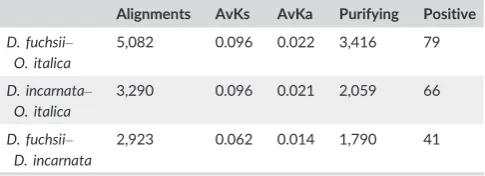
pri-marily biotic, but also abiotic (Figure 2, Fig. S6).
3.2
|
Abundance estimation and DE analyses
The table of counts included 41,851 retained clusters (i.e., unigenes).
A PCA (Fig. S4b) drawn withEDGERconfirmed that gene expression
variation between the twoDactylorhizaspecies explained the largest
principal component (70.5% of the total variation), but some
geo-graphical structure was also evident, in particular in D. incarnata.
Reflecting the substantial interspecific expression variation, DE tests
indicated a significant difference in expression between the two
Dactylorhizaspecies (Fig. S7), ranging from 14,165 clusters (EDGER) to
14,866 clusters (BAYSEQ). A total of 13,157 DE clusters were present
in each of the three tests at an FDR<0.05; of these, 47% were
found to be overexpressed inD. fuchsii. Some of these genes have
not yet been characterized, but Fisher’s exact tests on annotated
genes identified 184 enriched GO terms with overexpressed
ele-ments inD. fuchsiiand 133 in D. incarnata (Appendix S3). The GO
terms that had elements affected by DE were of a broad spectrum
(Figure 3, Fig. S8): photosynthesis, chlorophyll and pigment binding,
ribosome biogenesis, generation of precursor metabolites and
energy, protein–chromophore linkage, structural molecule activity
and tetrapyrrole binding were some of the significantly enriched GO
terms in upregulation of bothD. fuchsii andD. incarnata, but
repre-senting different transcripts. Enriched GO terms specifically
overex-pressed inD. fuchsiiincluded, for example, response to temperature,
carbohydrate storage, systemic acquired resistance, organonitrogen
metabolism and cysteine biosynthetic process (Figure 3a, Fig. S8a).
ForD. incarnata, specific enriched overexpressed GO terms included
a variety of fluid transmembrane transport-related GO terms, light
harvesting in photosystem I, carbohydrate catabolic processes, DNA
integration, RNA-dependent DNA polymerase activity, but also,
per-haps importantly, the induced systemic resistance, detection of
stim-ulus and nitric oxide signal transduction (Figure 3b, Fig. S4b).
3.3
|
Small RNA analysis
After selection by length, we retained an average of 3.1 million
20-to 22-nt-long reads per sample and an average of 1.5 million
24-nt-long reads per sample, respectively. Average mapping efficiency of
these two categories of reads to the Dactylorhiza reference
tran-scriptome was 30.1% (SD=2.8%) and 21.3% (SD=6.7%),
respec-tively. This is in line with the expectation that an important part of
T A B L E 2 Summary of cSNP diversity measures in the Dactylorhizatranscriptomes
HO F P p
fB4 0.12 0.73 0.40
fB5 0.09 0.79 0.24
fP1 0.08 0.81 0.16
fP7 0.12 0.72 0.25
D. fuchsii 0.1 0.76 0.26 .077
iA6 0.03 0.92 0.06
iB6 0.05 0.89 0.19
iB0 0.03 0.92 0.14
iS4 0.03 0.94 0.11
iS8 0.05 0.89 0.19
D. incarnata 0.04 0.91 0.14 .037
HO, observed proportion of heterozygous SNPs;F, per-individual
inbreed-ing coefficient;P, ratio of private variants (i.e., singletons or doubletons) to total number of variant sites;p, nucleotide diversity per species aver-aged over all biallelic SNP positions with more than two genotypes pre-sent per group. Species values are given in bold.
T A B L E 3 Summary of theKAKS_CALCULATORanalysis of rates of sequence evolution in pairwise alignments over 150 bp of the Dactylorhizaspecies andO. italica
Alignments AvKs AvKa Purifying Positive
D. fuchsii– O. italica
5,082 0.096 0.022 3,416 79
D. incarnata– O. italica
3,290 0.096 0.021 2,059 66
D. fuchsii– D. incarnata
2,923 0.062 0.014 1,790 41
[image:6.595.46.289.73.243.2] [image:6.595.47.290.611.699.2]sRNAs target genomic regions outside of the transcriptome (e.g.,
introns, repetitive elements and promoters), albeit some of the active
repetitive elements and parts of introns can be represented in the
reference transcriptome constructed from a total RNA library.
Clustering of the samples (Fig. S4c,d), based on the siRNAs and,
respectively, the mi/tasiRNAs confirmed a significant divergence in
regulation between the two species. The differential regulation tests
resulted in 1,232 contigs overregulated by mi/tasiRNAs inD. fuchsii
and 1,449 contigs in D. incarnata over a total of 9,848 transcripts
passing initial filters. Enrichment tests identified 48 enriched GO
terms with mi/tasiRNA overregulated elements inD. fuchsiiand 38 in
D. incarnata. DNA integration, DNA metabolism, nitrogen
metabo-lism, RNA-directed DNA polymerase (RdDp) activity, nucleic acid
binding, heterocyclic and organic cyclic compound binding are some
of the significantly enriched GO terms in the set of contigs
overregu-lated inD. fuchsii(Fig. S9). InD. incarnata, several of the enriched GO
terms were related to organelle function (e.g., light harvesting in
pho-tosystem I, protein–chromophore linkage, chlorophyll and pigment
binding) and some to iron transmembrane transport. Concerning the
siRNA, 6,001 contigs passed initial filters and 855 and 1,045 contigs
were overregulated in D. fuchsiiandD. incarnata, respectively.
Fish-er’s exact tests gave evidence for 35 GO terms (Fig. S10) with
ele-ments overregulated by siRNAs inD. fuchsiiand 30 inD. incarnata. In
this case, the most significant GO terms enriched in both species
appeared related to DNA integration, DNA metabolism, nucleic acid
metabolism, binding, nucleic acid binding, zinc ion binding, cation
binding and heterocyclic and organic cyclic compound binding
(Fig. S10). Several GO terms specifically overregulated in D. fuchsii
included metabolism and modifications of small nuclear (snRNA),
small nucleolar RNAs (snoRNA) and pseudouridine synthesis.
3.4
|
Ecological differentiation
As Bioclim parameters have a resolution of 30 arc seconds (ca.
1 km2), they are considered representative for the macrohabitat
preference of each species. A test of climatic niche overlap
(Broennimann et al., 2012) indicated that overall, the (macro)habitats
of the two species were similar (D=0.75; similarity tests in both
directions withp<.01), but an equivalency test (p=.002) indicated
that the climatic niches of the two species were not completely
identical. Accordingly, a divergence test of the climatic niches
(McCormack et al., 2010) showed a significant differentiation on the
PC2 niche axis (mean divergence=0.36, null hypothesis=0.21
to 0.13; paired samples Student’st=3.650,df=624.5,p<.001),
summarizing annual mean temperature (BIO1), isothermality (BIO3),
mean temperature of wettest quarter (BIO8), annual precipitation
(BIO12) and precipitation seasonality (BIO15), but not on PC1 axis
(mean divergence=0.23, null hypothesis=0.15–0.55; paired
sam-ples Student’s t=2.437,df=632.84,p=.01) including mean
diur-nal temperature range (BIO2) and precipitation of warmest quarter
(BIO18).
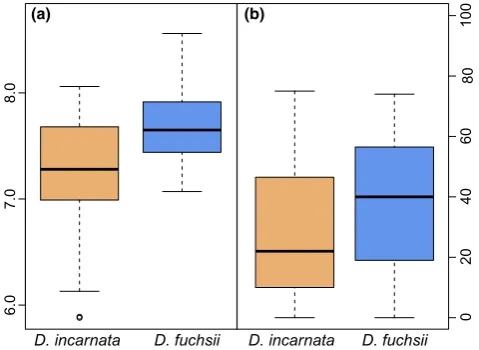
The tree cover data of 30-m resolution are considered here a
microhabitat descriptor. Significant differences in tree cover were
apparent between the localities occupied by the two species
(Stu-dent’s t=6.776, df=641.11, p<.001; Figure 4). Another
micro-habitat descriptor soil pH directly measured in the immediate vicinity
of plants indicated a significantly divergent preference for soil acidity
(Student’st=3.535,df= 62,p<.001, Figure 4).
4
|
D I S C U S S I O N
Orchids make up the largest angiosperm family, but the molecular
variation shaping this important biodiversity is still little understood
(Givnish et al., 2015). Here, we have identified thousands of
tran-scripts with distinct alleles, expression patterns and/or
post-tran-scriptional regulation between two food-deceptive, terrestrial orchid
species that are currently parapatric across Europe. We show that
despite their generally shared distribution area, the twoDactylorhiza
species inhabit distinct niches, as the microenvironmental conditions
they prefer differ significantly with regard to soil acidity and tree
cover (Figure 4), but also with respect to temperature evenness over Cell killing
Methionine MPr Killing of cells of other organism
Polysaccharide localization Cuticle
development Endoplasmic reticulum unfolded protein response
Molybdate ion transport Very long−chain fatty
acid MPr
Potassium ion transport S−adenosylmethionine
MPr
Defence response by callose deposition
Semantic space Y
−2.0 −1.6
semantic space X
(a)
Phenylpropanoid MPr
Phosphate Ion transport
S−adenosylmethionine biosynthetic Pr
Base excision repair
Alkaloid MPr Alkaloid biosynthetic Pr
Response to glucose Hexose transport
Tyrosine MPr Aromatic AA MPr
−2.0 −1.4
(b)
[image:7.595.49.547.52.215.2]the year and annual precipitation. If maintained over generations,
such deviating ecological preferences likely triggered distinct
selec-tion that in combinaselec-tion to specific demographic histories have
moulded different genomic landscapes between the two species
(Slotte, Foxe, Hazzouri, & Wright, 2010).
The current prevalence ofD. incarnatawithin small, localized
pop-ulations (i.e., subhabitat specialization) over a highly fragmented
distri-bution resulting in a Wahlund effect (Hedren & Nordstrom, 2009) is€
corroborated here with considerable levels of inbreeding of this taxon.
In turn,D. fuchsii, which currently grows in larger, diffuse populations
(Kull & Hutchings, 2006), exhibits higher levels of heterozygosity and,
in general, higher genetic diversity (Table 2). We estimate the lineages
leading toD. fuchsiiandD. incarnatato have diverged in the second
half of Miocene, most probably within the first million years after
Dactylorhizasplit from its sister clade (Givnish et al., 2015). An early
split of the clades of the two species has previously been
demon-strated in phylogenetic (Bateman et al., 2003) and population genetic
studies (Balao et al., 2016; Hedren, 1996) that described significant
genetic divergence between them. The twoDactylorhizaspecies
stud-ied here can therefore be considered to be representative for the
depth of molecular variation in the genus, retaining effects of natural
selection throughout their evolutionary histories.
4.1
|
Protein sequence evolution, positive selection
and biotic pressure
Nonsynonymous mutations may trigger novel functions and new
phenotypes and are hence expected to be under strong selective −8
−4
Water transport
Photosynthesis, light harvesting in photosystem I
Ribosome biogenesis
Detection of stimulus
Protein– chromophore linkage
Organ morphogenesis
Generation of precursor metabolites and energy Carbohydrate catabolic
Pr
Nucleoside diphosphate MPr
Photosynthesis
Cellular chemical homeostasis macromolecule
MPr phenol−containing C biosynthetic Pr
DNA integration Pyridine− containing C MPr
Glycerol transport
Cellular nitrogen C MPr
Fluid transport Pyruvate MPr
Induced systemic resistance
Detection of endogenous stimulus Nitric
oxide-mediated signal transduction Cytoplasmic
translation Response to
temperature stimulus
Photosynthesis Ribosome
biogenesis
Carbohydrate storage
cellular hormone MPr
Glucose 6−phosphate MPr
Protein−chromophore linkage
Photosynthesis, light reaction
Cysteine biosynthetic Pr
Carbohydrate derivative MPr
Generation of precursor metabolites and energy
Retinoid MPr Sulphur C MPr
Secondary MPr
Pigment MPr
Oxidation−reduction Pr
Primary alcohol MPr Organonitrogen
C MPr
Pyridine−containing C MPr
Response to
cadmium ion Systemicacquired
resistance Cellular
component
biogenesis Pentose−
phosphate shunt Secondary metabolite
biosynthetic Pr
Semantic space X
Semantic space Y
(a)
(b)
−6 −3
[image:8.595.135.469.48.479.2]pressure, either purifying or positive. Along the deep histories of the
twoDactylorhiza species, we observe significant effects of purifying
selection, targeting close to 70% of genes. However, the estimated
overall ratio of nonsynonymous to synonymous substitutions of 1:5
appears in line to those recorded for example betweenArabidopsis
thaliana and A. lyrata (diverged 5–10 Ma, Yang & Gaut, 2011) or
Gossypium arboreum and G. raimondii (diverged 7–11 Ma, Senchina
et al., 2003).
Our results further bring evidence that positive selection
elevated the interspecificKa/Ksratios across at least 1.2% of
orthol-ogous genes. This estimate is, however, limited to a cohort of
pro-tein-coding sequences that were expressed in both Dactylorhiza
species at the time of tissue sampling in the common garden and also
had an ortholog in the O. italica reference. Hence, our inferences
may be mainly representative for constitutively expressed
genes/ex-ons, rather than those transcribed only as direct response to stimuli
or stressors. In addition, given the long history of the two species
and therefore the substantial amount of synonymous substitutions
that could have accumulated, our test for positive selection requires
a fairly large number of codons per gene to be affected by positive
selection in order for Ka/Ks to significantly exceed one. Therefore,
the stringent approach we used likely uncovers rather extreme cases
where positive selection is operating (Roth & Liberles, 2006).
Consistent with a dynamic evolution of protein sequences
shaped by exposure to habitat-specific pathogens and herbivores
(Brown & Tellier, 2011), the most frequent and overrepresented
functions among the selected genes along the phylogenetic branches
of the two Dactylorhiza species are linked to biotic responses. The
type and strength of biotic stress imposed on plants depends heavily
on both geography and environmental context, but also on host
genotype and ability of plants to resist particular stressors (Tiffin &
Moeller, 2006). For example, given the open versus more forested
habitats specific forD. incarnataandD. fuchsii, respectively, each of
these species had most probably to adapt to distinct herbivores.
Plant responses to herbivores and pathogens (i.e., host–pathogens
interactions, leading to pathogen recognition and host defence
sys-tems; Chisholm, Coaker, Day, & Staskawicz, 2006) are generally
con-text dependent, moulded by the surrounding plant communities,
local nutrient conditions and the plant metapopulation dynamics and
structure, likely distinct in the long-term between the two species
investigated here (Hedren & Nordstrom, 2009; Pillon et al., 2007).€
Aiming to minimize frequency and impact of attack, the diverse
defences that plants specifically evolved appear to include both
physical and chemical adaptations. The specific genes that have been
found to be under lineage-specific positive selection with our
approach (see Section“2”) and their GO term enriched in the
respec-tive test are discussed below.
On theD. fuchsiibranch (Figure 2a, Fig. S6a), evidence for
adap-tive evolution is found for a homolog ofDEFENSIN J1-2, known to
inhibit the growth of pathogenic fungi by modifying their
morphol-ogy or physiolmorphol-ogy, disrupting or killing exogenous cells (Thomma,
Cammue, & Thevissen, 2002). Another candidate gene for adaptive
evolution on theD. fuchsiibranch is a homolog of HAI1
PHOSPHA-TASE 2C 78, which is involved in defence response mechanisms by
deposition of callose, a polysaccharide produced as a response to
wounding, but also in response to drought and salt stress (Zhang
et al., 2013). HAI1is further involved in the pathway of the
endo-plasmic reticulum response to an accumulation of unfolded or
mis-folded proteins on stress (Wahyu Indra Duwi, Lee, & Lee, 2013). A
D. fuchsii homolog of TETRAKITIDE a-PYRONE REDUCTASE 2 also
shows a significantly elevatedKa/Ksratio. This is part of the
DIHY-DROKAEMPFEROL 4-REDUCTASE activity with a role in flavonoid
biosynthesis, again potentially linked to plant defence. Finally, a
homolog of 3-KETOACYL-SYNTHASE 10, with a role in developing
cuticular wax, is also evidenced as a target of positive selection on
theD. fuchsii branch, potentially in response to viral pressure (Lolle
et al., 1997).
On the other hand, along the history of D. incarnata(Figure 2b,
Fig. S6b), positive selection acted on a POLYPHENOL OXIDASE
homolog with a putative role in the activity ofCATECHOL OXIDASE
as a response to plant tissue damage, producing
ortho-benzoqui-nones that further polymerize to form melanins, protecting plant
wounds against further microbial attack (Queiroz, Mendes Lopes,
Fialho, & Valente-Mesquita, 2008). Adaptive evolution also appears
to have affected a PRIMARY AMINE OXIDASE homolog potentially
involved in cell wall maturation and lignification during development,
as well as wound healing and cell wall reinforcement during
patho-gen invasion (Cona, Rea, Angelini, Federico, & Tavladoraki, 2006).
The S-ADENOSYLMETHIONINE SYNTHETASE orthologs appear to
have undergone specific adaptive evolution, independently during
bothD. fuchsiiandD. incarnatahistories. S-adenosylmethionine acts
as a universal methyl group donor in transmethylation reactions, but
also serves as a precursor to the phytohormone ethylene, implicated
in the control of numerous developmental processes, and regulating
resistance to bacterial and fungal pathogens, nematodes and
lepi-dopteran herbivores (Wang, Li, & Ecker, 2002).
6.0
7.0
8.0
D. fuchsii D. incarnata
(a)
0
204
06
0
80
100
(b)
D. fuchsii D. incarnata
[image:9.595.46.286.51.226.2]Further adaptive evolution specific to the D. incarnata history
has affected elements of phenylpropanoid biosynthesis, namely a
LACCASEhomolog with a putative role in formation of lignin and a
PHENYLALANINE AMMONIA-LYASE (PAL) homolog potentially
involved in alkaloid biosynthesis. Apart their role in defence
mecha-nisms against herbivores and pathogens, phenylpropanoids have
been shown, for example in the orchidPhalaenopsis, to enhance
pro-tection to UV light (Ali, Khatun, Hahn, & Paek, 2006), potentially
rel-evant forD. incarnata given its preference for more open habitats
compared toD. fuchsii. In this context, we also detected adaptive
evolution along the D. incarnata branch of a homolog of
TRANS-MEMBRANE 9 SUPERFAMILY MEMBER 4with a putative role in base
excision repair, a cellular DNA repair mechanism.
Elevated evolution of further protein-coding sequences
poten-tially related to abiotic-imposed selection in D. incarnataincludes a
SUGAR CARRIER C homolog, potentially involved in hexose
trans-membrane transport likely linked to hypoxia (Gharbi, Ricard, Smiti,
Bizid, & Brouquisse, 2009) that the roots ofD. incarnatamay suffer,
given the high soil moisture to which this species adapted (Paun
et al., 2011). Preferences for distinct soil chemistry (i.e., organic vs.
mineral soil typically preferred byD. incarnataandD. fuchsii,
respec-tively) and soil pH may be linked to elevated rates of evolution of an
INORGANIC PHOSPHATE TRANSPORTER 1-8homolog inD. incarnata
and ofPOTASSIUM TRANSPORTER 9inD. fuchsii. Finally, a
MOLYB-DATE TRANSPORTER 2homolog underwent adaptive evolution along
theD. fuchsii history. Molybdate is an essential plant micronutrient
that regulates, for example, nitrate reduction to nitrite and plays a
role in redox reactions, and its availability and efficiency of its
uptake from soil are highly dependent on soil pH (Tomatsu et al.,
2007). Altogether, these candidates open up the ground for further
research to identify the specific functional impact of codon
evolu-tion, its physiological implications and potential transferability of
defence gene variants to cultivated orchids.
4.2
|
Divergent regulation of expression and abiotic
preference
We further explored differentiation in gene expression rates between
the twoDactylorhizaspecies in a common garden setting. Our results
estimate around a third of the identified orthologous genes show
sig-nificant DE. This extensive expression divergence could be the result
of both adaptation and drift and appears mid-range compared to
other pairs of plant species that diverged within a similar time frame
(Brassica rapaandB. oleraceadiverged ca. 13 Ma and show ca. 22%
DE, Jiang et al., 2013; e.g.,Gossypiumspecies diverged 5–10 Ma and
show up to 53% DE, Rapp, Udall, & Wendel, 2009).
The uncovered DE between the two orchid species affected
genes involved in various biosynthetic and metabolic processes—
with several GO term enrichments that may be consistent with
adaptation (i.e., long-term constitutive expression divergence) and/or
acclimation to multiple abiotic (and biotic) stresses, some of them
likely specific for the conditions of the common garden. We further
exemplify gene ontology terms of a potential ecological relevance,
which have been found to be enriched within the group of DE
genes.
The shaded common garden mimicked more closely the light
pref-erences ofD. fuchsii. Light is one of the most important
environmen-tal factors for plants, providing an energy source, but also governing
their developmental programme (Neff, Fankhauser, & Chory, 2000).
Our tree cover analysis shows a significant difference in preference
for the openness of the habitats forD. incarnataandD. fuchsii
(Fig-ure 4b). The need to enhance efficiency of light absorption
corrobo-rates an observed overexpression inD. incarnata of 14 chlorophyll
binding transcripts, part of the light harvesting pathway in
photosys-tem I, which is the most significantly enriched biological process
(p=6.29108) for upregulation in this species (Figure 3b). This
fur-ther correlates to a significant increase in mi/tasiRNAs targeting of
this pathway in D. incarnata (i.e., affecting five chlorophyll binding
transcripts; enrichmentp=3.19104). This may indicate a dynamic
regulation of acclimation to shaded conditions inD. incarnata. Further
gene expression differences potentially increasing photosynthetic
efficiency, this time in the way light is used to reduce molecules in
light reaction, are visible in 63 transcripts overexpressed inD. fuchsii
(or with decreased expression inD. incarnata, corresponding also to
increased targeting by mi/tasiRNAs of 15 transcripts in this pathway,
enriched atp=1.19104). Broadly, transcripts with a putative role
in photosynthesis appear to have higher expression (Figure 3a;
enriched atp=1.691010) and to be less targeted by mi/tasiRNAs
(Fig. S9b; enriched at p=6.19107) in D. fuchsii in comparison withD. incarnata—a pattern that may mirror the long-term
prefer-ence of the former for more shaded environments.
In turn, the location of the common garden has likely featured
rather alien temperature conditions forD. fuchsii(i.e., higher
temper-ature in summer, limited snow cover in winter), given that no
popu-lation of this species grows within at least 50 km radius around the
city, whereas someD. incarnata stands are present even within the
city boundary (e.g., compare distributions on www.gbif.at). Indeed,
forD. fuchsiiwe identified a significant overexpression of 55
anno-tated transcripts putatively involved in a response to temperature
(enriched atp=.0011). This abiotic stress can trigger misfolding of
newly synthesized proteins and denaturation of existing proteins
(Barnabas, J€ager, & Feher, 2008). Genes known to be upregulated as
response to high temperature stress (e.g., Altenbach, 2012) and
hav-ing a homolog found to be overexpressed inD. fuchsii include, for
example, heat-shock proteins (i.e., HSP70 kDa17 and DNAJ HSP40
homologs), a GLYCERALDEHYDE-3-PHOSPHATE DEHYDROGENASE
(GADPH A), a GALACTINOL SYNTHASE and a TRIOSEPHOSPHATE
ISOMERASEhomolog involved in glycolysis. The uncovered ecological
divergence in bioclimatic variables such as annual mean temperature
(BIO1) is congruent with a significant divergence in expression of
genes related to a temperature response.
4.3
|
Genome stability and small RNA regulation
Gene expression is generally governed by a complex combination of
factors and miRNAs (Warnefors & Eyre-Walker, 2011). The
compara-tive analysis of sRNA profiles confirms that the extensive differences
in gene expression between the Dactylorhiza species are
comple-mented by divergent post-transcriptional regulations. miRNAs
func-tion as negative regulators of gene expression via translafunc-tional
repression or mRNA cleavage (Borges & Martienssen, 2015) and are
known to mediate response to genomic or environmental stresses
(Ding, Tao, & Zhu, 2013; Ivashuta et al., 2011). From the transcripts
that were targeted by miRNAs and/or tasiRNAs, 27.2% were found
to be differentially regulated between the two orchid species, with
deviating post-transcriptional regulation of metabolism (e.g., nucleic
acids, aromatic compounds, tetrapyrrole and alkaloid metabolism
tar-geted inD. fuchsii, and DNA and tetrapyrrole metabolism targeted in
D. incarnata) and binding (Fig. S9). As discussed above, we observed
an increased targeting by mi/tasiRNA of photosynthetic pathways in
D. incarnata, potentially as an acclimation response to the shaded
conditions in the common garden. Likely in connection to its
photo-synthetic activity, the starch transitory breakdown including maltose
metabolism is also overregulated in D. incarnata. Starch represents
an overflow of photosynthetically fixed carbon that is exported from
chloroplasts at night, predominantly as maltose (Lu & Sharkey,
2006). Inhibition of maltose metabolism slows down starch
degrada-tion, which has been reported to be a response to changes in
pho-toperiod length, circadian clock and temperature (Lu & Sharkey,
2006).
Importantly, our results point to distinct strategies and efficiency
in the maintenance of genome stability between the two orchid
spe-cies. In the RNAseq data, RdDp activity (enriched atp=.0016; with
60 transcripts overexpressed, representing in particular Ty3-gypsy
subclass), mainly associated with retrotransposons and retroviruses,
together with the process of DNA integration (193 transcripts,
enriched atp=9.19106) appear to be overexpressed inD.
incar-nata (Figure 3, Fig. S8). Moreover, the RdDp activity shows
increased control by mi/tasiRNAs in D. fuchsii (20 transcripts,
enriched atp=.003; Fig. S9c). These suggest a significant increase
in activity of class I TEs inD. incarnatacompared toD. fuchsii, which
over time may have triggered their difference in genome size. In this
context, it is notable that the two species exhibit different effective
population sizes (Balao et al., 2016), reflected in higher inbreeding in
D. incarnata that may correlate also with less efficient purging of
active insertions of TEs.
On the other hand, we also detect divergent regulation of 31.7%
of the transcripts that are targeted by siRNAs in the two
Dacty-lorhizaspecies. GO enrichment analyses of overregulated siRNAs for
each species revealed that the most meaningful biological processes
appear related to DNA integration, DNA metabolism and other
cesses related to nucleic acid binding (Fig. S10). These biological
pro-cesses are congruent with the presumed defence function of siRNAs
in plants against the proliferation of endogenous TEs or invading
viruses through transcriptional or post-transcriptional gene silencing
(Carrington & Ambros, 2003). However, siRNAs could also indirectly
affect gene expression of adjacent genes in the proximity of TEs
(Hollister et al., 2011). Thus, changes in expression in sRNAs could
ultimately be adaptive and evolve quickly under natural selection
(Chapman & Carrington, 2007).
4.4
|
Implications
Altogether, the distinct responses to selection accumulated during
the history of the two parapatric Dactylorhiza species investigated
here appear governed by their divergent microenvironmental
con-text, in which biotic and abiotic pressures act synergistically to
shape transcriptome structure, expression and regulation. Apart
from adaptation to divergent abiotic conditions, distinct habitat
affiliation of nascent species requires divergent adaptation to
abi-otic conditions, if they exceed possibilities granted by phenotypic
plasticity. However, distinct microhabitat preferences readily
require divergent defence strategies in order to detect and respond
to specific pathogens and herbivores (e.g., Turcotte, Davies,
Thom-sen, & Johnson, 2014). The divergent mechanisms of biotic
responses apparent between the two Dactylorhiza species both at
the level of coding sequence evolution, but also in the rates of
expression across the systemic acquired resistance (upregulated in
D. fuchsii, enriched at p<.005) and the induced systemic
resis-tance (overexpressed in D. incarnata, enriched at p<.01), are
remarkable given their obligate orchid–mycorrhiza interactions
(Tupac Otero & Flanagan, 2006). Modulation of plant defence
responses could have detrimental secondary effects on their
symbi-otic relationship. On the other hand, the plant mechanism of
myc-orrhiza recognition may constitutively activate systemic plant
immune responses (Pozo, Verhage, Garcıa-Andrade, Garcıa, & Azcon-Aguilar, 2009). Such activation can lead to a primed state of
the plant that allows for a more efficient defence mechanisms in
response to attack by potential enemies. Although Dactylorhiza
species associate with a wide range of common and generalist
mycorrhizal fungi, these two species show an incipient
differentia-tion in mycorrhizal spectra (Jacquemyn, Deja, De hert, Cachapa
Bailarote, & Lievens, 2012).
The detailed transcriptome knowledge for Dactylorhizagathered
in this study provides critical resources to understand evolution
after hybridization and whole-genome duplication, phenomena
especially frequent in this genus. In particular, the hybridization of
the two species analysed here iteratively formed a myriad of
mor-phologically and ecologically distinct sibling allopolyploids (Pillon
et al., 2007). We demonstrate here an extensive molecular
diver-gence between the two diploids, which suggests an extensive
genomic and transcriptomic shock in their hybrids (McClintock,
1984) and offers potential insights into the difficulties of
coexis-tence for these two genomes at the homoploid level (Paun, Forest,
Fay, & Chase, 2009). In turn, whole-genome duplication was
pro-posed to alleviate the transcriptomic shock of hybridization
between divergent progenitors (Hegarty et al., 2006). The present
study hence contributes useful resources and background
informa-tion to further explore allelic interacinforma-tions between parental
gen-omes when combined in a single duplicated nucleus. This notably
dominance and transgressive patterns that may promote metabolic
and developmental changes, stress tolerance and increased fitness
in allopolyploids (Chen, 2013).
A C K N O W L E D G E M E N T S
We are grateful to R. Bateman, C. Czepe, D. Diehl, M. Fay, O.
Mit-telsten Scheid and G. Szramko for their contribution to the results
presented here. Illumina sequencing was performed at the VBCF
NGS Unit (www.vbcf.ac.at/ngs). The computational results have been
achieved [in part] using the Vienna Scientific Cluster (VSC). This
work was funded by an Austrian Science Fund (FWF) project
(Y661-B16) awarded to OP and a Marie Curie IEF Fellowship
(PERG-GA-2011-299608-TRANSADAPTATION) to FB.
D A T A A C C E S S I B I L I T Y
The raw RNAseq data have been deposited into the Short Read
Archive (SRA) of the NCBI under Accession nos. SRR3330392–
SRR3330400 and SRR3330403–SRR3330404. The raw sRNA data
files have been deposited into the NCBI SRA under Accession nos.
SRR3331132–SRR3331133, SRR3331136, SRR3331143, SRR3331149–
SRR3331151, SRR3331195 and SRR5365231. The Transcriptome
Shotgun Assembly project has been deposited at DDBJ/EMBL/
GenBank under the Accession nos. GFHX00000000 and
GFJV00000000.
A U T H O R C O N T R I B U T I O N S
OP designed the research. F.B., M.H. and O.P. collected the sample
material. M.T.L. and J.B. carried out the wet laboratory work with
advice from O.P. and L.S. B.H.H. assembled the reference genome.
F.B. and T.W. carried out the D.E. analyses, with input from F.A. O.P.
performed the cSNP analyses, with input from C.K. E.T. performed the
sRNA analyses. F.B. carried out the ecological analyses. M.W.C. and
M.H. contributed to data interpretation. O.P., F.B. and E.T. drafted the
manuscript. All authors revised and approved the final manuscript.
R E F E R E N C E S
Aagaard, S. M., Sastad, S. M., Greilhuber, J., & Moen, A. (2005). A sec-ondary hybrid zone between diploidDactylorhiza incarnatassp. cru-entaand allotetraploidD. lapponica(Orchidaceae).Heredity,94, 488– 496.
Ackerman, J. D., Trejo-Torres, J. C., & Crespo-Chuy, Y. (2007). Orchids of the West Indies: Predictability of diversity and endemism.Journal of Biogeography,34, 779–786.
Ali, M. B., Khatun, S., Hahn, E.-J., & Paek, K.-Y. (2006). Enhancement of phenylpropanoid enzymes and lignin in Phalaenopsis orchid and their influence on plant acclimatisation at different levels of photosyn-thetic photon flux.Plant Growth Regulation,49, 137–146.
Altenbach, S. B. (2012). New insights into the effects of high tempera-ture, drought and post-anthesis fertilizer on wheat grain develop-ment.Journal of Cereal Science,56, 39–50.
Anders, S., & Huber, W. (2010). Differential expression analysis for sequence count data.Genome Biology,11, R106.
Anderson, J. T., Wagner, M. R., Rushworth, C. A., Prasad, K. V. S. K., & Mitchell-Olds, T. (2014). The evolution of quantitative traits in com-plex environments.Heredity,112, 4–12.
Balao, F., Tannh€auser, M., Lorenzo, M. T., Hedren, M., & Paun, O. (2016). Genetic differentiation and admixture between sibling allopolyploids in theDactylorhiza majaliscomplex.Heredity,116, 351–361. Barnabas, B., J€ager, K., & Feher, A. (2008). The effect of drought and
heat stress on reproductive processes in cereals.Plant, Cell & Environ-ment,31, 11–38.
Bateman, R. M., Hollingsworth, P. M., Preston, J., Luo, Y. B., Pridgeon, A. M., & Chase, M. W. (2003). Molecular phylogenetics and evolution of Orchidinae and selected Habenariinae (Orchidaceae).Botanical Journal of the Linnean Society,142, 1–40.
Benzing, D. H. (1986). The genesis of orchid diversity: Emphasis on floral biology leads to misconceptions.Linleyana,1, 73–89.
Borges, F., & Martienssen, R. A. (2015). The expanding world of small RNAs in plants.Nature Reviews Molecular Cell Biology,16, 727–741. Broennimann, O., Fitzpatrick, M. C., Pearman, P. B., Petitpierre, B.,
Pel-lissier, L., & Yoccoz, N. G.,. . .Guisan, A. (2012). Measuring ecological niche overlap from occurrence and spatial environmental data.Global Ecology and Biogeography,21, 481–497.
Brown, J. K. M., & Tellier, A. (2011). Plant-parasite coevolution: Bridging the gap between genetics and ecology.Annual Review of Phytopathol-ogy,49, 345–367.
Cai, J., Liu, X., Vanneste, K., Proost, S., Tsai, W. -C., & Liu, K. -W.,. . .Liu, Z. -J. (2015). The genome sequence of the orchidPhalaenopsis eques-tris.Nature Genetics,47, 65–72.
Carrington, J. C., & Ambros, V. (2003). Role of MicroRNAs in plant and animal development.Science,301, 336–338.
Chapman, E. J., & Carrington, J. C. (2007). Specialization and evolution of endogenous small RNA pathways.Nature Reviews Genetics,8, 884–896. Chase, M. W., Cameron, K. M., Freudenstein, J. V., Pridgeon, A. M.,
Sala-zar, G., vanden Berg, C., & Schuiteman, A. (2015). An updated classifi-cation of Orchidaceae.Botanical Journal of the Linnean Society, 177, 151–174.
Chen, Z. J. (2013). Genomic and epigenetic insights into the molecular bases of heterosis.Nature Reviews Genetics,14, 471–482.
Chisholm, S. T., Coaker, G., Day, B., & Staskawicz, B. J. (2006). Host-microbe interactions: Shaping the evolution of the plant immune response.Cell,124, 803–814.
Cona, A., Rea, G., Angelini, R., Federico, R., & Tavladoraki, P. (2006). Functions of amine oxidases in plant development and defence. Trends in Plant Science,11, 80–88.
Conesa, A., & G€otz, S. (2008). Blast2GO: A comprehensive suite for func-tional analysis in plant genomics.International Journal of Plant Geno-mics,2008, 12.
Cozzolino, S., & Widmer, A. (2005). Orchid diversity: An evolutionary consequence of deception? Trends in Ecology & Evolution, 20, 487– 494.
Danecek, P., Auton, A., Abecasis, G., Albers, C. A., Banks, E., & DePristo, M. A., . . .Durbin, R. (2011). The variant call format and VCFtools. Bioinformatics,27, 2156–2158.
Darwin, C. (1877).The various contrivances by which orchids are fertilized by insects. London: John Murray.
Davidson, N. M., & Oshlack, A. (2014). Corset: Enabling differential gene expression analysis for de novo assembled transcriptomes. Genome Biology,15, 410.
De Paolo, S., Salvemini, M., Gaudio, L., & Aceto, S. (2014).De novo tran-scriptome assembly from inflorescence of Orchis italica: Analysis of coding and non-coding transcripts.PLoS One,9, e102155.
De Wit, P., Pespeni, M. H., & Palumbi, S. R. (2015). SNP genotyping and population genomics from expressed sequences—Current advances and future possibilities.Molecular Ecology,24, 2310–2323.