OPEN ACCESS
Institute of Physics and Engineering in Medicine Physics in Medicine and Biology Phys. Med. Biol.59(2014) 697–713 doi:10.1088/0031-9155/59/3/697
Impact of respiratory motion correction
and spatial resolution on lesion detection
in PET: a simulation study based on real
MR dynamic data
Irene Polycarpou
1, Charalampos Tsoumpas, Andrew P King
and Paul K Marsden
Division of Imaging Sciences and Biomedical Engineering, School of Medicine, King’s College London, St Thomas’ Hospital, Westminster Bridge Road, SE1 7EH, UK
E-mail:[email protected]
Received 5 June 2013, revised 7 December 2013 Accepted for publication 10 December 2013 Published 20 January 2014
Abstract
The aim of this study is to investigate the impact of respiratory motion correction and spatial resolution on lesion detectability in PET as a function of lesion size and tracer uptake. Real respiratory signals describing different breathing types are combined with a motion model formed from real dynamic MR data to simulate multiple dynamic PET datasets acquired from a continuously moving subject. Lung and liver lesions were simulated with diameters ranging from 6 to 12 mm and lesion to background ratio ranging from 3:1 to 6:1. Projection data for 6 and 3 mm PET scanner resolution were generated using analytic simulations and reconstructed without and with motion correction. Motion correction was achieved using motion compensated image reconstruction. The detectability performance was quantified by a receiver operating characteristic (ROC) analysis obtained using a channelized Hotelling observer and the area under the ROC curve (AUC) was calculated as the figure of merit. The results indicate that respiratory motion limits the detectability of lung and liver lesions, depending on the variation of the breathing cycle length and amplitude. Patients with large quiescent periods had a greater AUC than patients with regular breathing cycles and patients with long-term variability in respiratory cycle
1 To whom correspondence should be addressed.
Phys. Med. Biol. (2014) 697 I Polycarpouet al
or higher motion amplitude. In addition, small (less than 10 mm diameter) or low contrast (3:1) lesions showed the greatest improvement in AUC as a result of applying motion correction. In particular, after applying motion correction the AUC is improved by up to 42% with current PET resolution (i.e. 6 mm) and up to 51% for higher PET resolution (i.e. 3 mm). Finally, the benefit of increasing the scanner resolution is small unless motion correction is applied. This investigation indicates high impact of respiratory motion correction on lesion detectability in PET and highlights the importance of motion correction in order to benefit from the increased resolution of future PET scanners.
Keywords: PET-MR, breathing pattern, motion model, motion correction, lesion detection, numeric observer, receiver operating characteristic analysis (Some figures may appear in colour only in the online journal)
1. Introduction
Across the world a million people die every year from lung and liver cancer (Ferlayet al2010). For more advanced stages of cancer, the treatment options become limited and survival rates decrease. Consequently precise and early detection of small cancerous lesions is important in order to prolong and improve the survival of cancer patients. Studies have reported increases in the survival rate among patients who have undergone therapy at the earliest stage of cancer (Henschkeet al2003, Adam and Vinet2004). Moreover, apart from detecting the lesions, accurate staging is important to decide what sort of therapy is best.
Medical imaging techniques such as positron emission tomography (PET) play an essential role in the diagnosis, staging, radiotherapy planning and therapy response assessment of cancer (Vansteenkiste and Stroobants2001, Rohrenet al2004). One of the biggest clinical applications of PET in oncology is staging of disease for which it is necessary to detect small and low uptake lesions with as high sensitivity as possible. However, lesion detection in PET is inherently limited by the spatial resolution of the scanner which underlines the importance of improved resolution in future scanners (Sch¨afers2008). Despite the improvements in PET scanner technology, respiratory motion is an unavoidable factor that severely degrades the effective spatial resolution (Xuet al2011) limiting lesion detection performance for chest and abdominal imaging. Respiratory motion typically causes displacements of less than 10 mm for lung lesions but this may increase to more than 20 mm for lung and liver lesions close to the diaphragm (Seppenwooldeet al 2002, Langen and Jones2001). Considering that many conventional PET scanners have a spatial resolution of approximately 6 mm, motion of that range effectively reduces the spatial resolution. With the potential improved resolution of future scanners the effects of motion are likely to become relatively more important (Daou 2008).
Phys. Med. Biol. (2014) 697 I Polycarpouet al
in terms of its diagnostic utility and lesion detectability in particular. A study by Marache-Fransiscoet al(2010) has shown that MC can improve detectability in the liver, but only a small effect is seen in the lungs, and this may be attributed to the extent of the displacement caused by motion that varies with the location of the lesions or the accuracy of the motion fields used for correction. Another recent study by Parket al(2012) reported significantly larger detection performance for lung lesions after MC. However, in both these studies the extent of the improvement as a function of lesion characteristics was not investigated while the study was restricted to one respiratory signal (i.e. motion amplitude and breathing pattern) and assumed conventional PET scanner resolution.
The aim of the current study is to understand the impact of respiratory MC and spatial resolution in PET on detecting lesions in the lungs and liver as a function of lesion size, tracer uptake, breathing pattern and displacement. Real respiratory signals were combined with a motion model formed from real dynamic thorax MR data (Kinget al2011) to simulate multiple dynamic thorax PET datasets acquired from a continuously moving subject. However, a realistic breathing cycle is not perfectly periodic and may have cycle-to-cycle variations in magnitude, as well as longer-term variations in both magnitude and period (Sonkeet al2008, von Siebenthalet al2007). Consequently, in contrast with other studies, real respiratory signals representative of three breathing patterns expected to be observed during a PET acquisition (Liu et al2009) are used with variable motion amplitude in order to provide a better understanding of the extent of motion blurring in both normal and extreme breathing cases and define when motion is important or not. Furthermore, the dynamic PET data were sorted to generate amplitude based gated data and finally reconstructed with a conventional image reconstruction method and with respiratory motion compensation using motion information obtained from similarly simulated gated MR data. The improvement in detectability performance resulting from MC was quantified using receiver operating characteristic (ROC) methodology with a channelized Hotelling observer (CHO). All evaluations of the impact of MC on the detectability were performed for both a simulated 6 mm full width half maximum (FWHM) scanner spatial resolution and for 3 mm FWHM spatial resolution in order to determine the relative importance of MC as new higher resolution scanners are developed.
2. Materials and methods
2.1. Respiratory signal database
Phys. Med. Biol. (2014) 697 I Polycarpouet al
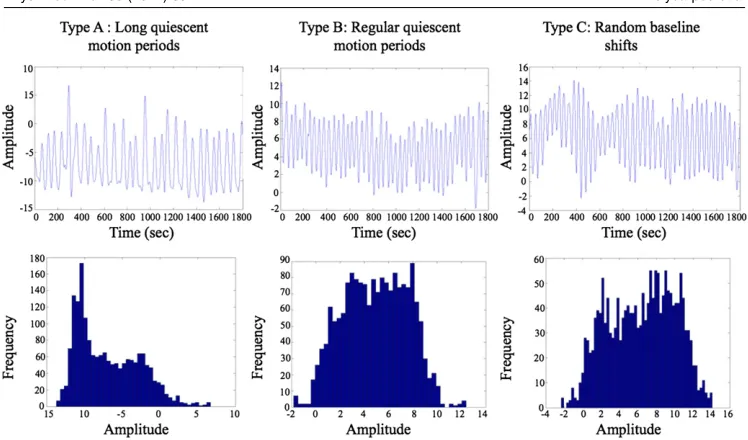
Figure 1. Breathing curves and corresponding displacement histograms for the three breathing types: (a) long quiescent motion periods (type-A) accounting for approximately 60% of the patients, (b) regular quiescent motion periods (type-B) accounting for approximately 20% of the patients and (c) random baseline shifts (type-C) accounting for approximately 20% of the patients.
2.2. Simulated dynamic PET data
To simulate dynamic PET data a numerical phantom was firstly created by manually segmenting a 3D MR image of the thorax into different tissue types and assigning to each tissue 18F-fluorodeoxyglucose (FDG) SUVs as typically measured in a clinical acquisition: air 0, lung tissue 0.5, soft tissue 1, bone 2.3, liver 2.5 and myocardium 3.2. Similarly, an anatomical attenuation map was generated with attenuation values: air 0 cm−1, lung tissue 0.03 cm−1, soft
tissue 0.099 cm−1, bone 0.15 cm−1. The numerical phantom consisted of 2 mm isotropic voxel
Phys. Med. Biol. (2014) 697 I Polycarpouet al (b)
(a)
[image:5.595.94.469.80.419.2](c) (d)
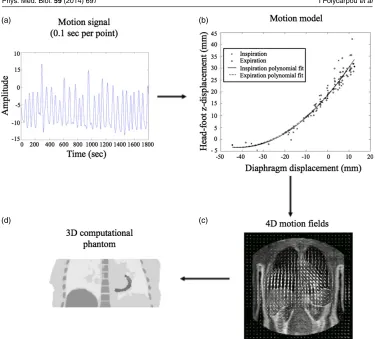
Figure 2.The 4D simulation is based around a motion model that describes the 3D trajectory (b) of each point in a grid covering the torso (c) as a function of the displacement of the diaphragm (a). The 4D description of the motion in the torso is then used to create the 4D radionuclide distribution model (d).
Real time 4D PET datasets with time-continuous motion were simulated by transforming each of the 3D numerical phantoms according to transformations calculated from a motion model for a given respiratory signal (no tracer kinetic was included in the current 4D model). To do this for each breathing type and motion amplitude the corresponding respiratory signal was combined with a motion model (Kinget al2011) derived from real dynamic MR data. Given a respiratory signal, the motion model is used to calculate motion fields necessary to transform the reference distribution (i.e. the 3D tracer uptake distribution) to the relevant respiratory positions and generate a 4D phantom. Therefore, for each given 3 min acquisition signal (0.1 s each point), the motion model calculated transformations for all 1800 sampling points and the FDG distribution was warped to 1800 positions to create a 4D dataset of a 3 min acquisition with 0.1 s temporal resolution as illustrated in figure2. Similarly, the motion fields were applied to the anatomical attenuation maps to create dynamic datasets. Dynamic datasets were created for each of the 16 phantoms, 2 simulated resolutions, 3 breathing types and 9 motion amplitudes resulting in 864 investigated cases.
Phys. Med. Biol. (2014) 697 I Polycarpouet al
and motion amplitude, the corresponding amplitude histogram was firstly divided into eight equal amplitude bins (i.e. gates) and then each of the 1800 images in a dynamic phantom based on the respiratory position was stored in the corresponding gate. An averaged image was then formed for each gate creating a 4D dynamic FDG distribution comprising eight gated images. Since, the PET acquisition system model is linear, averaging the FDG distributions prior to simulating the projection data will give the same result as simulating continuous projection data and gating afterwards. Finally, each gated image was used as input to an analytic simulation of a PET acquisition to create projection data as described by Tsoumpaset al(2011). The projection data accounted for photon attenuation, scatter (approximately 33% of the total counts) and resolution effects (Gaussian kernel of 6 or 3 mm) but not for random coincidences. Each of the eight gates was forward projected simulating a 3D acquisition (maximum ring difference: 43, span: 3) for the Philips Gemini PET scanner. Statistical (Poisson) noise was added to the projection data such that the overall counts of the whole dataset correspond to 50 million unscattered coincidences (i.e. 3–5 min 3D PET clinical thorax acquisition). To add noise in the gated projection data, based on the corresponding amplitude based histogram, each of the eight sinograms was weighted according to the dwell time at each displacement (i.e. histogram value). Sixty noise realizations were obtained for each investigated case.
2.3. Reconstruction algorithms
Each dataset was reconstructed without motion correction (No-MC) and with motion correction (MC) using the ordered subsets expectation maximization (OSEM) algorithm. The motion corrected images were obtained by incorporating the motion information within the reconstruction via the forward/backward transformation operators, as described by Polycarpou et al(2012). The transformation operators describing the motion between the gated data (i.e. eight positions of the respiratory cycle) were estimated using voxel-wise deformation vectors, which were produced by co-registration of MR gated datasets with a non-rigid registration algorithm based on a composition of hierarchical local affine registrations recently developed by Buergeret al(2011). The transpose motion matrix operation of MCIR was approximated by warping the image with the inverted motion fields which were numerically estimated from the same motion vectors (Crumet al2007). Finally, reference datasets (zero motion amplitude) were created by reconstructing only the reference gate with the same standard count statistics as for the entire gated dataset. All iterative reconstructions were performed with 23 subsets and for a low number of iterations (i.e. 2) as typically used in the clinic. Each slice consisted of 250×250 pixels with size 2×2 mm each, and the entire volume consisted of 87 slices with 2 mm thickness.
2.4. Detectability performance
Phys. Med. Biol. (2014) 697 I Polycarpouet al
(Myers and Barrett1987, Yao and Barrett1992). Channelized models compute the correlation between each channel and the image data and the classification decision is determined by a linear combination of all channel responses providing equivalent performance to the Hotelling observer (Gallas and Barrett2003). CHO have been proven to be good predictors of human visual performance in detecting lesions in images with correlated noise such as PET (Kadrmas et al2009, Lartizienet al2004, Shidaharaet al2006, and Nuytset al2009).
The CHO used in this study consisted of five radially symmetric octave wide frequency channels with 3D processing (Freyet al 2002) while the frequency and width of the first channel was 1/64 cycles per voxel as has been used in previous studies and that has shown good correlation with human observer performance. Knowing the position of the lesions the center of the channels was matched to the center of the lesion for each investigated case. The CHO was applied by estimating first order (mean) and second order (covariance) statistics using a number of different noise realizations of lesion-present and lesion-absent reconstructed images. In order to ensure accurate estimates of the ensemble statistics, a preliminary study was firstly conducted to estimate the minimum number of noise realizations that would stabilize the variance of the background. Variance estimations for the background image indicate approximately 60 noise realizations yield a stable result. Consequently, the ensemble statistics were calculated by using a sum of 60 realizations for each combination of lesion size and lesion to background ratio.
After calculating the ensemble statistics, each reconstructed image was processed through the frequency channels to estimate the likelihood of lesion present or lesion absent. The likelihood values were used as continuously distributed to create multiple ROC curves (Swensson1996, Metz1986) in order to evaluate and rank the lesion detection performance MC and No-MC. It must be noted that to derive the ratings and generate the ROC curves, the number of noise realizations used was the same with that used to calculate the ensemble statistics of the CHO in order to have similar statistical properties. Assuming a binormal model, an ROC curve was fitted to the given data using a maximum-likelihood technique. Furthermore, the area under each ROC curve (AUC) was calculated as the figure of merit of the detectability performance. An AUC value of 0.5 represents random detectability while 1 represents perfect detectability. An ROC curve was created for each case investigated; 2 regions of interest (i.e. lungs and liver)×2 reconstruction methods (No-MC or MC)×4 size values×4 tracer uptake values (i.e. 3:1–6:1)×9 lesion motion amplitudes×3 breathing types. In addition, a ROC curve was created for the reference image for two regions of interest (i.e. lungs and liver)×4 size values×4 tracer uptake values (i.e. 3:1–6:1). Finally, the significance of the differences between two different ROC curves was statistically tested using the Pearson correlation coefficient.
3. Results
3.1. Impact of respiratory motion on lesion detectability for three breathing types
Phys. Med. Biol. (2014) 697 I Polycarpouet al (a)
[image:8.595.93.467.84.456.2](b)
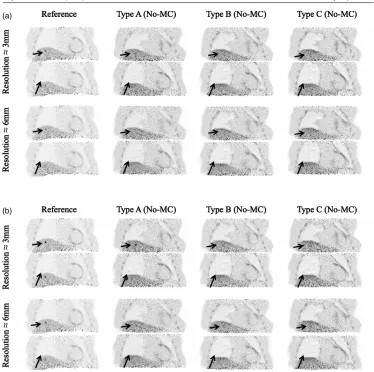
Figure 3.Coronal planes after reconstruction of the reference image and prior to motion correction (No-MC) of 20 mm under breathing of type-A, type-B and type-C. The lesions, indicated with arrows, are characterized with a diameter of 8 mm with a lesion to background ratio of: (a) 3:1 and (b) 6:1. The results are displayed for a PET scanner resolution of 6 and 3 mm. The lesions are easily detectable in the reference image but hardly or not detectable in images with motion.
breathing type-A are more easily detectable compared with images representing breathing type-C especially for a scanner resolution of 3 mm.
Phys. Med. Biol. (2014) 697 I Polycarpouet al
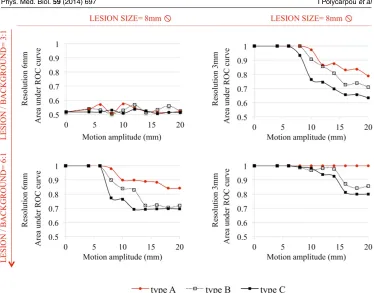
Figure 4.Area under the ROC curve (AUC) as a function of the motion amplitude prior to correction of motion (No-MC) under breathing of type-A, type-B and type-C. The results are displayed for the liver lesions of 8 mm diameter and for 3:1 and 6:1 lesion to background ratio values. The impact of motion in lesion detection is higher for respiration with higher amplitudes and long-term variability as compared with longer quiescent motion periods.
type-C. Similarly, for a high PET resolution (i.e. 3 mm) motion of 20 mm for small lesions (e.g. 8 mm diameter) and low (i.e. 3:1) lesion to background ratio may result in a degradation of detectability performance of up to 21% under breathing of type-A, up to 29% for type-B and up to 37% for type-C. Similar trends have been observed for the lung and liver lesions and therefore only the results for liver are presented.
3.2. Impact of respiratory motion correction on lesion detectability as a function of lesion characteristics
Phys. Med. Biol. (2014) 697 I Polycarpouet al
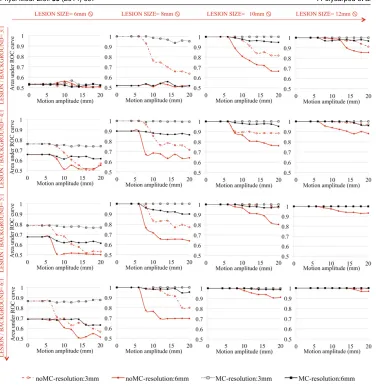
Figure 5.Area under the ROC curve (AUC) as a function of the motion amplitude after reconstruction prior to motion correction (No-MC) and after motion correction (MC) under breathing of type-C. The results are displayed for a PET scanner resolution of 6 and 3 mm. Motion correction significantly increases the detectability performance for small lesions (less than 10 mm diameter).
Phys. Med. Biol. (2014) 697 I Polycarpouet al
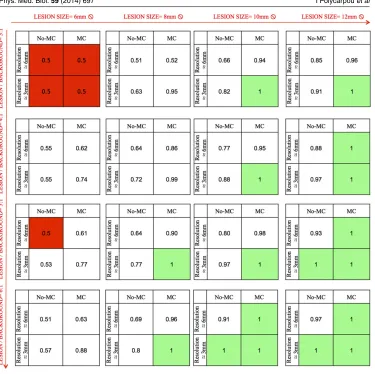
Figure 6.Area under the ROC curve (AUC) for lesion motion amplitude of 20 mm after reconstruction prior to motion correction (No-MC) and after motion correction (MC) for PET scanner resolutions of 6 and 3 mm. After MC the 3 mm resolution has superior detection performance to the 6 mm resolution. The benefit of increasing the scanner resolution is small unless MC is applied.
type-A and type-B (results not shown) and therefore only type-C is presented which is the case expected to be more beneficial from MC as shown in the previous subsection.
3.3. Improvement in lesion detectability with respiratory motion correction and scanner resolution
Phys. Med. Biol. (2014) 697 I Polycarpouet al
almost perfectly detectable if motion is corrected (AUC=0.95). The combination of increased scanner resolution and MC results in substantial improvement in detectability.
4. Discussion
4.1. Impact of respiratory motion on lesion detectability for three breathing types
Visual interpretation of Figure 3 shows blurring and inferior lesion contrast in PET reconstructed images with motion compared to the motion-free-reference images. Lesions in the lungs and liver may be hardly detectable in the images No-MC whereas they are clearly detectable in the reference image. However, the detectability performance differs among the three breathing pattern types; motion blurring is more important for acquisitions under respiration with long-term amplitude variability (i.e. type-B and type-C) as compared with longer quiescent motion periods (i.e. type-A).
Quantitative analysis of lesion detection performance as measured by the AUC presented in Figure 4 confirms the visual observation and shows the extent of the impact of motion blurring in detectability for the variable breathing cycles length and amplitude among the different breathing types. For any breathing type, respiratory motion degrades the detectability performance, with the greatest impact of motion blurring observed for type-C whereas the minimum is observed for type-A. The discrepancies among the three breathing pattern types are expected since respiration becomes progressively more irregular from type-A to type-C. The patients in type-A tend to breathe to a similar end-expiration location and spend a higher amount of time near that location while patients with type-B respiration have similar inspiration and expiration positions but spend similar amounts of time in inspiration and expiration. On the other hand, patients with type-C respiration cycle breathe irregularly with long term variation of the breathing cycles length and amplitudes and therefore type-C is expected to have the highest motion content in the acquired data with type-A the lowest. However, it must be noted that approximately 60% of the patients are expected to breath with a type-A pattern whereas only 20% of patients are expected to breath with type-C.
4.2. Impact of respiratory motion correction on lesion detectability as a function of lesion characteristics
Comparing the various plots in figure 5 we are able to see the difference resulting from respiratory motion correction as lesion size and tracer uptake increase. Motion correction significantly increases the detectability performance for small (less than 10 mm diameter) lesions (p-value less than 0.01). The greatest improvement from motion correction was achieved for the smaller lesions and lesions with low metabolic activity as long as the detectability was not limited by the scanner resolution. Large diameter or high tracer uptake lesions are less subject to motion and more easily detectable yielding little improvement by using motion correction. This is expected due to the fact that motion blurring spreads out and decreases the apparent tracer uptake (i.e. lesion contrast) (Liuet al2009) and therefore smaller lesions which are more susceptible to partial volume effect will be more affected. Consequently the required tracer uptake in order to detect the lesions varied with the motion amplitude and lesion size.
Phys. Med. Biol. (2014) 697 I Polycarpouet al
and to correct for motion. Simulations are derived from real-time respiratory curves whereas motion fields for correction were derived from registration of gated MR data simulated as simultaneously acquired with PET. Therefore the results are prone to any errors in the motion estimation (e.g. interpolation) introduced by the registration algorithm. Another possible explanation is the limited number of gates used as each gate is representative of a specific moment of the motion cycle, the different gates have different motion content especially under breathing with high variability between the different breathing cycles. Consequently, a higher number of gates, or real time motion correction, may be required to limit the content of motion in each gate and capture extreme phases such as a deep inspiration or expiration. In the current study eight gates have been used as is common in clinical practice. However, the optimal number of gates is expected to be correlated with the scanner resolution and motion amplitude (Dawoodet al2009) but this is beyond the scope of this study.
4.3. Improvement in lesion detectability with respiratory motion correction and scanner resolution
The results indicate that in order to take advantage of the potential increased spatial resolution of future PET scanners, it becomes important to account for respiratory motion assuming that acquisition protocols remain largely similar to those currently used and investigated in this study. In particular, considering a small tumour for the current standard of 6 mm PET resolution (i.e 6 mm lesion diameter) even if it has very high tracer uptake (i.e. 6:1) it cannot be detected due to the inherently limited resolution (AUC=0.5). However, although it is likely to be recovered with a next generation scanner of 3 mm (i.e. AUC=0.88 for zero motion amplitude) the motion effect limits this benefit (i.e. AUC=0.57 in the non motion corrected images). Similarly, considering a very low tracer uptake (3:1) of 8 mm diameter, it is not detectable with a 6 mm resolution (AUC=0.51) whereas although it is likely to be recovered with a next generation scanner of 3 mm resolution (i.e. AUC=1 for zero motion amplitude) the motion effect limits this benefit (i.e. AUC=0.63 in the non motion corrected images). Consequently, improving spatial resolution allows not only the detection of smaller tumours but also the detection of tumours with low metabolic activity and contrast (i.e. metastases)— the detection of small and lower uptake lesions may prove important for early detection and staging.
Prior studies have shown that for a conventional PET scanner resolution (i.e. 6 mm) motion correction can improve detectability (Marache-Fransiscoet al2010, Parket al2012) but did not study the effect of the lesion characteristics or extent of motion. In addition, in parallel of this work another similar investigation by Geramifar et al(2013) was made aiming to study the impact of respiratory motion on lung and liver tumor quantification and delineation by applying different attenuation maps such as end exhalation, end inhalation or average of the respiratory cycle. Similar with our study the results were compared for various diaphragm displacement and tumor size with location using a numerical phantom but only the type-A respiratory pattern was investigated. The results have shown high errors in tumor quantification, tumor misdisplacement and volume overestimation using attenuation correction involving the end exhalation or end inhalation compared with the respiration averaged.
Phys. Med. Biol. (2014) 697 I Polycarpouet al
better image quality and could affect detectability performance therefore limiting any possible positive false findings that might occur due to the high noise observed in OSEM reconstructed images. However, this is beyond the scope of the current study. Another limitation is the spherical shape of the lesions and the homogeneity in the anatomy (uniform FDG distribution) of the simulations simplifying the detection task especially in liver. In addition, bulk motion during acquisition (i.e. unpredictable random patient motion) was not taken into account. Furthermore, the numerical observer was applied in the center of the lesion eliminating the possibility of false positives in surrounding regions. Finally, the statistical power of this study was limited by the number of images used. Although, a preliminary study was conducted to estimate the minimum required number of noise realizations in order to ensure sufficient statistical power to differentiate between the different methods with high confidence, increasing the number of realizations may yield a better estimate of the ensemble statistics and decrease the statistical uncertainty in the AUC estimates.
5. Conclusions
This investigation indicates that respiratory motion correction has a high impact on lesion detectability. Patients with large quiescent motion periods are less subject to the effects of motion than patients with regular breathing cycles or with long-term variability in respiratory cycles and higher motion amplitudes. Furthermore, lesion detection performance is correlated with the lesion size, position and tracer uptake. Motion blurring particularly influences small size (less than 10 mm) or low metabolic activity lesions highlighting that respiratory motion correction could play a key role in detecting marginally detectable lesions. Finally, this study underlines the importance of handling respiratory motion in order to benefit from the potential improved spatial resolution of future PET scanners.
Acknowledgments
This study is part of the Sublima project (www.sublima-pet-mr.eu) supported by the European Union under the seventh framework program (241711) and the National Institute for Health Research (NIHR) Biomedical Research Centre at Guy’s and St Thomas’ NHS Foundation Trust and King’s College London. The views expressed are those of the authors and not necessarily those of the NHS, the NIHR or the Department of Health. We wish to acknowledge Dr Volkmar Schulz (Philips Healthcare) and Dr Lefteris Livieratos (KCL) and Dr Suleman Surti (University of Pensylvania) for motivating discussions. Special thanks also to Dr Miho Shidahara (University of Tohoku) for discussions on the channelized Hotelling observer, Dr Paul Schleyer for providing us the respiratory signal data and Dr Anastasia Chalkidou (KCL) for performing the FDG uptake values measurements from clinical PET/CT acquired data. The algorithms are based on the release 2.4 of the open source STIR library (http://stir.sf.net).
References
Adam R and Vinet E 2004 Regional treatment of metastasis: surgery of colorectal liver metastases Ann. Oncol.15103–6
Alessio A M, Stearns C W, Shan T, Ross S G, Kohlmyer S, Ganin A and Kinahan P E 2010 Application and evaluation of a measured spatially variant system model for PET image reconstructionIEEE Trans. Med. Imaging29938–49
Phys. Med. Biol. (2014) 697 I Polycarpouet al Barrett H H, Yao J, Rolland J P and Myers K J 1993 Model observers for the assessment of image quality
Proc. Natl Acad. Sci. USA909758–65
Buell P E 1971 The importance of tumor size in prognosis for resected bronchogenic carcinomaJ. Surg. Oncol.3539–51
Buerger C, Sch¨aeffter T and King A P 2011 Hierarchical adaptive local affine registration for fast and robust respiratory motion estimationMed. Image Anal.15551–64
Chun S Y, Reese T G, Ouyang J, Guerin B, Catana C, Zhu X, Alpert N M and El Fakhri G 2012 MRI-based nonrigid motion correction in simultaneous PET/MRIJ. Nucl. Med.531284–91
Crum W, Camara O and Hawkes D 2007 Methods for inverting dense displacement fields: evaluation in brain image registrationMedical Image Computing and Computer-Assisted Intervention (MICCAI) ed N Ayacheet al(Berlin: Springer) pp 900–7
Daou D 2008 Respiratory motion handling is mandatory to accomplish the high-resolution PET destiny Eur. J. Nucl. Med. Mol. Imaging351961–70
Dawood M, Buther F, Stegger L, Jiang X, Schober O, Sch¨afers M and Sch¨afers K P 2009 Optimal number of respiratory gates in positron emission tomography: a cardiac patient studyMed. Phys.
361775–84
Dey J and King M A 2009 Theoretical and numerical study of MLEM and OSEM reconstruction algorithms for motion correction in emission tomographyIEEE Trans. Nucl. Sci.562739–49
Farquhar T H, Llacer J, Hoh C K, Czernin J, Gambhir S S, Seltzer M A, Silverman D H, Qi J, Hsu C and Hoffman E J 1999 ROC and localization ROC analyses of lesion detection in whole-body FDG PET: effects of acquisition mode, attenuation correction and reconstruction algorithmJ. Nucl. Med.
402043–52
Ferlay J, Shin H R, Bray F, Forman D, Mathers C and Parkin D M 2010 GLOBOCAN 2008 version1.2, Cancer Incidence and Mortality Worldwide: IARC CancerBaseNo. 10 (Lyon: International Agency for Research on Cancer)
Frey E C, Gilland K L and Tsui B M W 2002 Application of task-based measures of image quality to optimization and evaluation of three-dimensional reconstruction-based compensation methods in myocardial perfusion SPECTIEEE Trans. Med. Imaging211040–50
Gallas B D and Barrett H H 2003 Validating the use of channels to estimate the ideal linear observer J. Opt. Soc. Am.A201725–38
Geramifar P, Zafarghandi M S, Ghafarian P, Rahmim A and Ay M R 2013 Respiratory-induced errors in tumor quantification and delineation in CT attenuation-corrected PET images: effects of tumor size, tumor location, and respiratory trace: a simulation study using the 4D XCAT phantomMol. Imaging Biol.15655–65
Gifford H C, King M A, de Vries D J and Soares E J 2000 Channelized Hotelling and human observer correlation for lesion detection in hepatic SPECT imagingJ. Nucl. Med.41514–21
Henschke C I, Wisnivesky J P, Yankelevitz D F and Miettinen O S 2003 Screen-diagnosed small stage I cancers of the lung: genuineness and curabilityLung Cancer39327–30
Kadrmas D J, Casey M E, Black N F, Hamill J J, Panin V Y and Conti M 2009 Experimental comparison of lesion detectability for four fully-3D PET reconstruction schemesIEEE Trans. Med. Imaging28523–34
Kim J S, Kinahan P E, Lartizien C, Comtat C and Lewellen T K 2004 A comparison of planar versus volumetric numerical observers for detection task performance in whole-body PET imagingIEEE Trans. Nucl. Sci.5134–40
King A P, Tsoumpas C, Buerger C, Schulz V, Marsden P and Sch¨aeffter T 2011 Real-time respiratory motion correction for simultaneous PET-MR using an MR-derived motion modelIEEE Nucl. Sci. Symp. Med. Conf. Rec.pp 3589–94
Lamare F, Carbayo M J L, Cresson T, Kontaxakis G, Santos A, Le Rest C C, Reader A J and Visvikis D 2007 List-mode-based reconstruction for respiratory motion correction in PET using non-rigid body transformationsPhys. Med. Biol.525187–204
Langen K M and Jones D T 2001 Organ motion and its management Int. J. Radiat. Oncol. Biol. Phys.50265–78
Lartizien C, Kinahan P E and Comtat C 2004 A lesion detection observer study comparing 2-dimensional versus fully 3-dimensional whole-body PET imaging protocolsJ. Nucl. Med.45714–23
Li T, Thorndyke B, Schreibmann E, Yang Y and Xing L 2006 Model-based image reconstruction for four-dimensional PETMed. Phys.331288–98
Phys. Med. Biol. (2014) 697 I Polycarpouet al Marache-Fransisco S, Lamare F, Fayad H, Visvikis D, Prost R, Rouet J M and Lartizien C 2010 Impact of respiratory motion correction on the detection of small lesions in whole-body PET imaging: a simulation studyIEEE Nucl. Sci. Symp. Med. Conf. Rec.pp 3531–3
Martini N, Bains M S, Burt M E, Zakowski M F, McCormack P, Rusch V W and Ginsberg R J 1995 Incidence of local recurrence and second primary tumors in resected stage I lung cancerJ. Thorac. Cardiovasc. Surg.109120–9
McClelland J R, Hawkes D J, Sch¨aeffter T and King A P 2013 Respiratory motion models: a review Med. Image Anal.1719–42
Metz C E 1986 ROC methodology in radiologic imagingInvest. Radiol.21720–33
Metz C E, Herman B A and Roe C A 1998 Statistical comparison of two ROC-curve estimates obtained from partially-paired datasetsMed. Decis. Making18110–21
Myers K J and Barrett H H 1987 Addition of a channel mechanism to the ideal-observer modelJ. Opt. Soc. Am.42447–57
Nehmeh S A and Erdi Y E 2008 Respiratory motion in positron emission tomography/computed tomography: a reviewSemin. Nucl. Med.38167–76
Nuyts J, Michel C, Brepoels L, De Ceuninck L, Deroose C, Goffin C, Mottaghy F M, Stroobants S, Van Riet J and Verscuren R 2009 Performance of MAP reconstruction for hot lesion detection in wholebody PET/CT: an evaluation with human and numerical observersIEEE Trans. Med. Imaging2867–73
Park J, Lee T S, Chen S, Fung G and Tsui B 2012 Evaluation of 4D PET reconstruction with motion correction using channelized Hottelling observer for lesion detectionJ. Nucl. Med.532376 Polycarpou I, Tsoumpas C and Marsden P K 2012 Analysis and comparison of two methods for motion
correction in PET imagingMed. Phys.396474–83
Qiao F, Pan T, Clark J W and Mawlawi O R 2006 A motion-incorporated reconstruction method for gated PET studiesPhys. Med. Biol.513769–83
Rohren E M, Turkington T G and Coleman R E 2004 Clinical applications of PET in oncology Radiology231305–32
Sch¨afers K P 2008 The promise of nuclear medicine technology: status and future perspective of high-resolution whole-body PETPhys. Med.2457–62
Schleyer P, O’Doherty M J and Marsden P K 2011 Extension of a data-driven gating technique to 3D, whole body PET studiesPhys. Med. Biol.563953–65
Seppenwoolde Y, Shirato H, Kitamura K, Shimizu S, van Herk M, Lebesque J V and Miyasaka K 2002 Precise and real-time measurement of 3D tumor motion in lung due to breathing and heartbeat, measured during radiotherapyInt. J. Radiat. Oncol. Biol. Phys.53822–34
Shidahara M et al 2006 Predicting human performance by channelized Hotelling observer in discriminating between Alzheimer’s dementia and controls using statistically processed brain perfusion SPECTAnn. Nucl. Med.20605–13
Sonke J J, Lebesque J and van Herk M 2008 Variability of four-dimensional computed tomography patient modelsInt. J. Radiat. Oncol. Biol. Phys.70590–8
Swensson R G 1996 Unified measurement of observer performance in detecting and localizing target objects on imagesMed. Phys.231709–25
Tang J, Hall N and Rahmim A 2012 MRI assisted motion correction in dual-gated 5D myocardial perfusion PET imagingIEEE Nucl. Sci. Symp. Med. Conf. Rec.pp 4054–7
Thielemans K, Tsoumpas C, Mustafovic S, Beisel T, Aguiar P, Dikaios N and Jacobson M W 2012 STIR: software for tomographic image reconstruction release 2Phys. Med. Biol.57867–83
Tong S, Alessio A M and Kinahan P E 2010 Noise and signal properties in PSF-based fully 3D PET image reconstruction: an experimental evaluationPhys. Med. Biol.551453
Tsoumpas C, Buerger C, King A P, Mollet P, Keereman V, Vandenberghe S, Schulz V, Schleyer P, Sch¨aeffter T and Marsden P K 2011 Fast generation of 4D PET-MR data from real dynamic MR acquisitionsPhys. Med. Biol.566597–613
Tsoumpas C, Mackewn J, Halsted P, King A, Buerger C, Totman J, Schaeter T and Marsden P K 2010 Simultaneous PET MR acquisition and MR-derived motion fields for correction of non-rigid motion in PETAnn. Nucl. Med.24745–50
Tsoumpas C, Polycarpou I, Thielemans K, Buerger C, King A P, Sch¨aeffter T and Marsden P K 2013 The effect of regularization in motion compensated PET image reconstruction: a realistic numerical 4D simulation studyPhys. Med. Biol.581759–73
Phys. Med. Biol. (2014) 697 I Polycarpouet al von Siebenthal M, Szekely G, Gamper U, Boesiger P, Lomax A and Cattin P 2007 4D MR imaging of
respiratory organ motion and its variabilityPhys. Med. Biol.521547–64
Wang G and Qi J 2012 Penalized likelihood PET image reconstruction using patch-based edge-preserving regularizationIEEE Trans. Med. Imaging312194–204
Xu Q, Yuan K and Datian Y 2011 Respiratory motion blur identification and reduction in ungated thoracic PET imagingPhys. Med. Biol.564481–98