This is a repository copy of An ultrasonic method for measuring fluid penetration rate into threaded contacts.
White Rose Research Online URL for this paper: http://eprints.whiterose.ac.uk/121010/
Version: Accepted Version
Article:
Vail, J.R., Mills, R.S., Stephen, J.T. et al. (2 more authors) (2013) An ultrasonic method for measuring fluid penetration rate into threaded contacts. Tribology International, 67. pp. 21-26. ISSN 0301-679X
https://doi.org/10.1016/j.triboint.2013.06.011
Article available under the terms of the CC-BY-NC-ND licence (https://creativecommons.org/licenses/by-nc-nd/4.0/)
[email protected] https://eprints.whiterose.ac.uk/
Reuse
This article is distributed under the terms of the Creative Commons Attribution-NonCommercial-NoDerivs (CC BY-NC-ND) licence. This licence only allows you to download this work and share it with others as long as you credit the authors, but you can’t change the article in any way or use it commercially. More
information and the full terms of the licence here: https://creativecommons.org/licenses/
Takedown
If you consider content in White Rose Research Online to be in breach of UK law, please notify us by
An ultrasonic method for measuring fluid penetration rate into threaded contacts
Tribology International 11/2013, 67:21‐26
J.R. Vail, R.S. Mills, T. Stephen, M.B. Marshall, R.S. Dwyer‐Joyce
Leonardo Tribology Centre Sir Frederick Mappin Building Mappin Street
University of Sheffield Sheffield, United Kingdom S1 3JD
Abstract
Various methods have been employed to study the efficacy of multipurpose penetrating oils but these techniques do not investigate the rate which these oils penetrate surfaces. This paper outlines a novel, non‐invasive ultrasonic method that provides a direct means of mapping fluid penetration in threaded systems.
An apparatus with piezoelectric elements was developed to pulse ultrasonic waves into a nut specimen where the waves reflected from the threaded interface. The reflected signal amplitude shifted as fluid penetrated the thread, allowing the fluid to be mapped to provide a measure of ingress rate. The results for three fluid samples are presented. Measurements suggest the fluid tracks helically down the unloaded side of the thread and radially into the loaded thread surfaces.
Keywords
Ultrasound, penetrating oils, threaded connection
Abbreviations
B bulk modulus, Pa
h film thickness, m
K spring stiffness, Nm‐3
P pressure, Pa
R reflection coefficient
u displacement, m
ω angular frequency of ultrasonic pulse, Hz
1.0 Introduction Multi‐Purpose penetrating oils are low viscosity fluids used to lubricate machine parts and provide resistance to corrosion. These oils move through small spaces, around particulates and dissolve residue between surfaces that may otherwise inhibit shearing of the contact. Frequently dispensed as an aerosol, these oils can be applied to otherwise difficult to reach places such as threaded fasteners. Desirable properties, such as low viscosity, low surface tension and high wettability, allow the fluid to penetrate into narrow spaces and provide lubrication where more traditional lubricants are precluded. Numerous experiments have investigated the loosening of fasteners including the influence of lubricants but a robust method to measure ingress of these lubricants has not yet been developed [1‐8]. Current industry standards include the nail climb test and contact angle measurements. A comparative method where multiple fluids are tested in parallel, the nail climb test measures the distance a given fluid sample travels up the surface of a vertical nail within a specified time period. Contact angle measurements can be used indirectly to determine penetration; lower angles indicate low surface tension and high surface energy which are drivers for penetration. These techniques do not offer direct measurements of the penetration rate in traditional applications such as bolted joints. Ultrasonic inspection has been used to measure the contact pressure of bolted joints [9,10]. It has proven to be a valuable method in detecting thin films of lubricant embedded between machined parts. Sound is transmitted through the machine element and reflected from the oil film. By analysing the reflected signal characteristics (such as film thickness) of the film can be determined [11]. Previously, the thickness of oil films present in components such as bearings, face seals and piston rings have been measured using ultrasound [12‐15]. Other fluid film techniques, including capacitance, laser induced fluorescence and optical interferometry, are invasive or difficult to apply to bolted joints [16‐19]. It is hypothesized that ultrasonic inspection can be used to observe fluid penetration by detecting its presence as it flows into a threaded fastener. 2.0 Theoretical When an ultrasonic wave strikes a boundary between two different materials, part of its energy is transmitted into the second material whilst the remainder is reflected back into the first material. If mode changes are neglected and the incident wave is normal to a perfectly bonded boundary, the relative amplitude of the ultrasonic wave that is reflected is described by
[1]
where z1 and z2 are the acoustic impedance of the materials either side of the boundary and
For a dry contact, the pockets of air around the asperities act as acoustic reflectors, as depicted in Fig.1(b).
[image:4.595.71.526.136.318.2]
Figure 1: Schematic representation showing how different contact conditions affect ultrasound transmission
When loaded, the asperities deform and cause the true area of contact to increase, enabling a greater proportion of the ultrasound to be transmitted through to the adjacent
component. If the amplitude of the surface roughness (Ra) is much smaller than the
wavelength of ultrasound (propagating normal to the surface), then the interfacial condition can be modeled as a surface distributed spring system [20]. Interaction by an incident ultrasonic wave results in a reflection coefficient governed by
R [2]
where K is the equivalent spring stiffness and ω is the angular frequency of the ultrasonic wave. For a dry contact, K is governed by the normal stiffness asperities alone, KS, as given in Eq.(3) [21]:
[3]
If a fluid is then introduced around the asperities, a further liquid stiffness component, KL acts in parallel to KS and is governed by the bulk modulus (B) of the fluid and its thickness (h) as shown in Eq. (4)[22].
[4]
2.1 Ultrasound and bolt geometry
When loaded, the two mating components each have one thread surface in contact and one which forms the edges of a helical void. The pitching elements were positioned such that the ultrasound was projected toward the thread at an angle of 60 degrees to the axis of the fastener. The reflected wave‐front was captured on an opposing element, as shown in Fig.3. In this setup the ultrasound underwent two reflections before reaching the sensing
[image:5.595.70.481.229.472.2]element: one from the contacting surfaces of the thread and one from the void surface. As a result, the path length is equal for the entire wave‐front, retaining its pulse structure.
Figure 2: Schematic diagram showing ultrasound path for thread geometry.
When the bolt is loaded, the free bolt and nut thread surfaces form the boundaries of a helical void such that when a liquid penetrant is introduced, capillary action draws it around the threads. As the fluid tracks down the thread, the same forces draw the fluid into the contacting surfaces, causing an increase in contact stiffness. This results in a reduction in the intensity of the reflection and consequently, the signal received by the catching
piezoelectric element.
If the ultrasonic wave‐front is considered to be projected along a radial path, it will perceive the thread as a discrete set of contacts, spaced by the pitch of the thread. As the penetrant travels helically into the threaded contact, it will pass the ultrasonically irradiated 'slice' at discrete intervals, separated by the time taken for it to perform one full rotation of the thread. Once a particular thread depth has been reached, it remains full of fluid. This
3.0 Materials and Methods
3.1 Apparatus
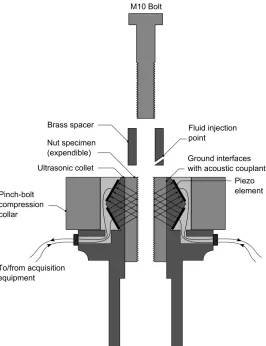
[image:6.595.74.340.315.661.2]Six plain‐wave piezoelectric transducers (10x1mm cut down from larger elements) having a center frequency of 10MHz and bandwidth of 3MHz were used in this study. They were positioned circumferentially around a collet based apparatus designed for metric 10mm bolts, shown in Figure 4. Standard untreated silver steel cylinders with a threaded interior were used for the female specimens. The male specimens were manufactured from re‐ machined M14 bolts, turned using a CNC lathe in order to increase geometric tolerances and provide uniformity not offered in off the shelf threaded fasteners. The apparatus is designed such that the male and female specimens can be cleaned and reused or replaced easily, without affecting the ultrasonic carrier. A brass spacer is used to space the mating specimens. This contained a hole to the start of the threads to enable injection of the test fluids. This was required to eliminate effect of the bolt head which would otherwise have restricted flow to the threads.
Figure 3: Sectioned schematic of test apparatus.
Each piezoelectric transducer consisted of a separate pitching and catching element and are operated using a PC mounted ultrasonic pulser receiver (UPR) as shown in Fig. 5. The
were streamed to hard disc for post processing. Though the resulting incident angle (to the thread surfaces) was at 30°, the relative effect of three different stiffness conditions on the reflected waveform was maintained.
Figure 4: Acquisition equipment schematic.
Each of the piezoelectric elements had an active area of 10x1mm resulting in an ultrasonic wave‐front projected over distance of 7 threads (i.e. 7 rotations of the thread helix), starting at a depth of 4 threads.
3.2 Procedure
To validate the method and compare the penetration rates of different products, two commercially available penetrating fluids and one solvent were tested. The penetrating fluids will be referred to as Fluids A and B, while the solvent is referred to as Fluid C. The kinematic viscosities of all fluids at 25°C are between two to three centistokes.
Prior to each test, the specimens were ultrasonically cleaned in an acetone bath for 10 minutes and then oven dried at 50°C for 10 minutes. Each test was performed at room temperature. The cleaned specimen was tightened to a torque of 40 Nm and mounted into the ultrasonic collet and clamped. In order to ensure adequate acoustic coupling between the collet and specimen, a commercial coupling gel was used. A reflection under the reference condition was captured using the acquisition system. It should be noted that this reference corresponded to the dry, loaded condition rather than an air interface. A clean pipette was used to inject 100µL of sample fluid into the application hole, at which point data collection initiated. Repeated loading and unloading of the bolt specimens at this low loading torque was found not to have a significant effect on penetration rates over
successive tests and consequently each fluid was tested five times using the same bolt/hole pair.
3.3 Analysis
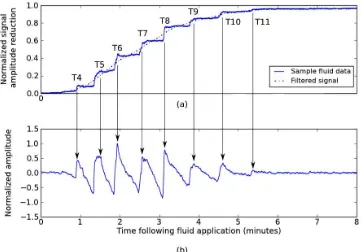
obtain Fig.7. The slower ingression provided greater data clarity to identify thread
advancement. 7a demonstrates the reduction in envelope amplitude for a given sensor as the fluid is introduced into the thread, as well as the smoothed result after low pass filtering. Subtraction of the smoothed result from the fluid data provided a signal form to which peak detection was applied (Fig.7(b)), corresponding to when a particular thread had been flooded with fluid.
[image:8.595.79.523.187.330.2]Figure 6: Data obtained using a non-penetrating oil. (a) Time domain signal response for unloaded, dry loaded and wet loaded cases, (b) Signal after filtering and normalisation.
Figure 7: Data using a non-penetrating oil. (a) Normalised reduction in signal amplitude, (b) Leveled data using filtered signal.
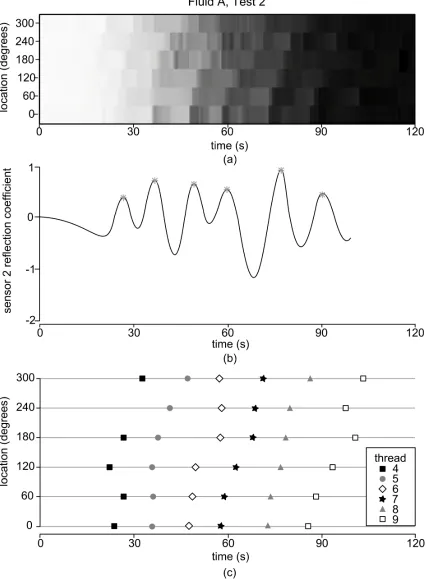
Fig.8(a) shows the response for a penetrating fluid sample plotted as an intensity map produced from the equivalent data to that shown in figure 7a. The time at which the penetrant reaches a new thread can be seen as a sudden jump in intensity. Such plots provide a useful method to quickly compare the response of different fluids and are
[image:8.595.82.444.387.639.2]of the thread causes the oblique patterning of the intensity steps, while the gradual decrease in gradient indicates that the penetration rate slows with time. To quantify
Figure 8: Analysis steps, (a) Intensity map, (b) peak detection and (c) fluid penetration mapping.
compare the penetration rates of the different fluids. Each of the three fluids was tested five times in order to provide an indication of repeatability.
4.0 Results
[image:11.595.72.338.269.413.2]Mean values of τ values measured at each sensor during the five tests for Fluid A, are shown in Table 1. The relatively small standard deviations (~4% of the total travel time) for five of the six sensors, provides confidence in the uniformity of the flow structure. The larger variation associated with sensor 5 was the result of lower signal fidelity due to poorer thread mating, introducing ambiguity in identifying when the threads had completely filled with fluid.
Table 1: Mean penetration rates for fluid A.
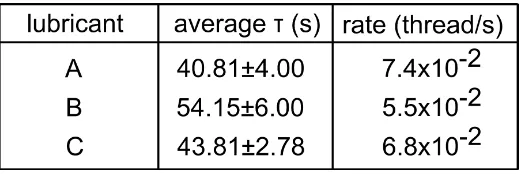
The overall mean τ values for each fluid, compiled from every sensor over all five tests, are shown in Table 2. Fluid C, a solvent, is simpler in formulation and as a result, was expected to be more repeatable than A and B, which had higher deviations.
Table 2: Mean specimen fluid penetration rates.
5.0 Discussion
[image:11.595.73.333.509.596.2]Circumferential variation in thread loading affects the rate of the fluid ingress along the bolt. This is caused by local surface waviness of the thread surfaces and gives rise to a variable thread surface separation down the length of the helix. Washburn found that the rate of ingress of a fluid is proportionally dependent on the radius of a capillary [23]; for regions under higher load, the clearance between surfaces will be reduced and produce a slower local rate of fluid ingress. An example of this can be seen as the fluid travels along thread nine and is detected by the sensors at 180° and 240° (Fig. 8(c)). Though the fluid moves helically down the capillary tube with a uniform flow, the rate at which it radially enters the contacting surfaces is sensitive to the local contact pressure shown schematically in Fig.9. The instrumentation detects the presence of the fluid within the contacting surfaces and not the capillary tube, resulting in the observed time lag is the result of the variable radial flow rate.
Figure 9: (a) Schematic representation of fluid flow and (b) effect of localised regions of high contact pressure.
The work carried out for this paper utilised initially clean thread surfaces, representing ideal conditions. Contaminants such as surface oxide or residual oils will affect the mechanisms by which the fluid is drawn into the system. These contaminants are typically present when penetrating oils are used and this experimental method has the potential to investigate such conditions.
6.0 Conclusions
[image:12.595.75.427.261.535.2][13] Dwyer‐Joyce RS, Harper P, Drinkwater BW. A method for the measurement of hydrodynamic oil films using ultrasonic reflection. Trib. Letters 2004; 17: 337‐348.
[14] Zhang J, Drinkwater BW, Dwyer‐Joyce RS. Acoustic measurement of lubricant‐film thickness distribution in ball bearings. J. Acoust. Soc. America 2006; 119:863‐871.
[15] Mills R S, Avan EY, Dwyer‐Joyce RS. Piezoelectric sensors to monitor lubricant film thickness at piston–cylinder contacts in a fired engine. Proc. Inst. Mech. Eng., Part J: J. Eng.
Trib. 2012; doi:10.1177/1350650112464833.
[16] Irani K, Pekkari M, Angstrom HE. Oil film thickness measurement in the middle main bearing of a six‐cylinder supercharged 9 litre diesel engine using capacitive transducers. Wear 1998; 207: 29‐33.
[17] Glavatskikh SB, Uusitalo O, Spohn DJ. Simultaneous monitoring of oil thickness and temperature in fluid film bearings. Trib. Intl. 2001; 34: 853‐857.
[19] Spikes HA. Thin films in elastohydrodynamic lubrication: The contribution of experiment. Proc. Inst. Mech. Eng. Par J: J. Eng. Trib. 1999; 213: 335‐352.
[19] Baba Y, Taneichi Y, Ishima T, Obokata T. Fundamental study on lubricant oil film behavior by LIF and PIV. Trans. JSME. 2006; 72: 1001‐1006.
[20] Tattersall HG. The ultrasonic pulse‐echo technique as applied to adhesion testing. J. Phys. D: Appl.Phys. 2002;7: 819.
[21] Thomas TR, Sayles RS. Stiffness of machine tool joints: A random‐process approach. J.Eng Ind. 1977; 99: 250.
[22] Dwyer‐Joyce RS, Harper P, Drinkwater BW. A method for the measurement of hydrodynamic oil films using ultrasonic reflection. Trib. Letters 2004; 17: 337‐348.