P R O C E E D I N G S
Open Access
Two-stage analyses of sequence variants in
association with quantitative traits
Jennifer H Barrett
*, Jérémie Nsengimana
From
Genetic Analysis Workshop 17
Boston, MA, USA. 13-16 October 2010
Abstract
We propose a two-stage design for the analysis of sequence variants in which a proportion of genes that show some evidence of association are identified initially and then followed up in an independent data set. We compare two different approaches. In both approaches the same summary measure (total number of minor alleles) is used for each gene in the initial analysis. In the first (simple) approach the same summary measure is used in the analysis of the independent data set. In the second (alternative) approach a more specific hypothesis is formed for the second stage; the summary measure used is the count of minor alleles in only those variants that in the initial data showed the same direction of association as was seen overall. We applied the methods to the simulated quantitative traits of Genetic Analysis Workshop 17, blind to the simulation model, and then evaluated their performance once the underlying model was known. Performance was similar for most genes, but the simple strategy considerably out-performed the alternative strategy for one gene, where most of the effect was due to very rare variants; this suggests that the alternative approach would not be advisable when the effect is seen in very rare variants. Further simulations are needed to investigate the potential superior power of the alternative method when some variants within a gene have opposing effects. Overall, the power to detect associations was low; this was also true when using a more powerful joint analysis that combined the two stages of the study.
Background
Genome-wide association studies focus on genetic loci with common minor allele frequencies (MAFs > 0.05) and are not designed to detect the effects of rare variants. However, rare variants contribute to complex diseases and might be detectable using resequencing data. Several methods for analyzing this type of data have been pro-posed [1-4], but this research area is still in development and many questions remain unanswered. Given the cost burden of sequencing a large number of subjects across the entire exome or the whole genome, we postulate that in a typical study a relatively small sample can be analyzed comprehensively, following up on regions of interest in a second data set. The test statistic threshold in the first stage should not be too restrictive, to avoid false-negative
results, while the second stage threshold should meet stringent criteria, to minimize false-positive results.
Using the simulated Genetic Analysis Workshop 17 (GAW17) data [5], we conducted analyses of quantitative traits Q1, Q2, and Q4 to evaluate the efficacy of this approach. We compared two approaches, one testing for overall evidence of association with the gene exactly as in the first analysis and the other forming a more specific hypothesis based on the initial results. Once the original simulation model was disclosed, we determined power and false-positive rates.
Methods Simple strategy
For each sequence variantiin genej, letxijkbe the num-ber of copies of the minor allele (defined as the allele with population allele frequency less than 0.5) carried by indivi-dualk(soxijk= 0, 1, or 2). Suppose that genejincludesnj sequence variants; then a summary measure for genejin individualkis formed by counting the number of minor * Correspondence: [email protected]
Section of Epidemiology and Biostatistics, Leeds Institute of Molecular Medicine, University of Leeds, Cancer Genetics Building, St. James’s University Hospital, Beckett Street, Leeds, LS9 7TF, UK
alleles:
Xjk xijk i
nj =
=
∑
1 . (1)For each replicate, we randomly split the sample into an initial set of 349 (50%) subjects and an independent set consisting of the remaining 348 subjects. We tested association between each of the three simulated quanti-tative traits Q1, Q2, and Q4 and each gene in the initial set using a linear regression model, regressing the trait onXjk and adjusting for population in three categories (156 Europeans [CEPH population or Tuscan], 321 Asians [Chinese or Japanese], and 220 Africans [Luhya or Yoruba]). Genes showing evidence of association with the trait at a significance level of 0.01 were carried for-ward to the second stage of the analysis.
Suppose that, for a particular trait and replicate, N genes were carried forward to the second stage. These genes were then tested in the same way in relation to the trait, using the remaining data for that replicate. Genes were regarded as showing association in this sec-ond stage if they met the Bonferroni-corrected signifi-cance level of 0.05/N. Each analysis (first and second stage) was repeated for each trait in the 200 replicates.
Alternative strategy: more specific hypothesis
We investigated an alternative strategy in which theN genes identified in the initial data set were tested in a different way in the remaining samples. Instead of sum-ming all minor variants in the gene, we used informa-tion on which variants were positively or negatively related to the trait in the initial data set. Specifically, for each of the N genes, the direction of association between the sum of the variants and the trait in the initial set was ascertained (i.e., whether they were posi-tively or negaposi-tively correlated). If they were posiposi-tively correlated, we identified the subset of individual variants that were positively related to the trait in this data set (i. e., positive regression coefficient but not necessarily sta-tistically significant).
LetIijbe an indicator variable such thatIij = 1 if var-ianti is positively related to the trait andIij = 0 other-wise (including for variants not observed in the data set). We calculated a new summary measure for each gene, summing over just these variants:
′ = =
∑
Xjk x Iijk ij i
nj
1
. (2)
In the second stage, we tested association with the trait by regressing the trait on X′jk, adjusting for popu-lation as before. Similarly, we analyzed negatively related
variants if the gene and the trait were overall negatively correlated.
As in the simple analysis, we regarded genes as show-ing association in this second stage if they met a signifi-cance level of 0.05/N. Results are presented for each quantitative trait for each gene that showed consistent evidence of association in the first-stage analysis (in at least 120 of the 200 replicates). Results are also pre-sented for the genes that were simulated to be asso-ciated with each trait. Analyses were conducted using programs written for this purpose in R (R Development Core Team, Vienna).
Comparison with joint analysis of the two-stage design We also considered the increase in power that could be obtained by carrying forward the samples from the first stage into the final analysis, that is, by carrying out a joint analysis of the total data set for theNgenes pas-sing stage 1 but applying a Bonferroni correction for the original number of 3,205 genes. For this design (with an equal number of samples in the two data sets and an initial significance level of 0.01), Skol et al. [6] has shown that this correction approximately preserves the overall type I error rate.
Results Q1, Q2, and Q4
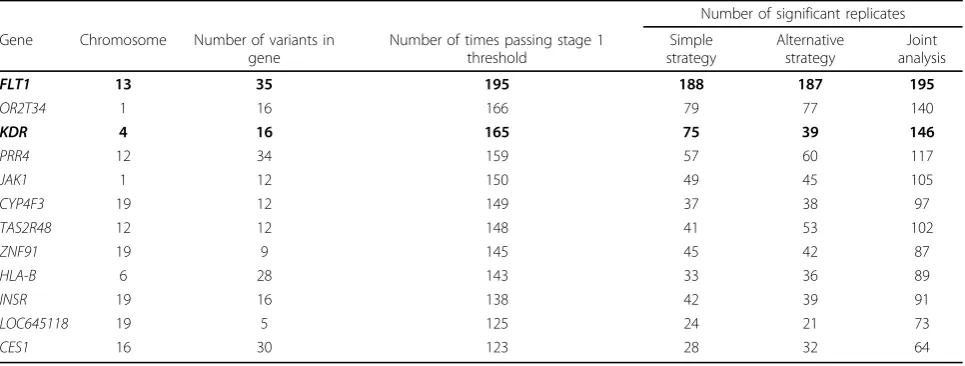
Table 1 lists the 12 genes that show association with Q1 at a significance level of 0.01 in the first stage of the analysis in at least 120 replicates. TheFLT1gene reaches this level of significance in 195 replicates, indicating a power of 97.5% with a sample size of only 349. The next two col-umns in Table 1 give the number of times a significant association is seen in the follow-up analysis using the sim-ple approach and using the alternative strategy based on a more specific hypothesis. For most genes the performance of the two strategies is similar, but association is detected considerably fewer times forKDR using the alternative strategy compared to the simple strategy (39 vs. 75 repli-cates; see later discussion).
In the list of our 12 top findings for Q1 (Table 1), 10 are false positives. With the exception ofPRR4, all these genes are on the list of 695 genes found by others to be consistently spuriously associated with the simulated dis-ease affection status, which was correlated with Q1 [7]. These genes were highly significantly more correlated with the single-nucleotide polymorphisms (SNPs) simu-lated to be causal than were the other genes in the data set [7].
method has considerably more power than either of the other approaches, in agreement with what has been shown previously [6].
Seven other genes associated with Q1 in the simulation model were not detected in our analysis using any approach. Although all met the stage 1 significance level of 0.01 in at least two replicates (ranging from 2 for HIF3Ato 28 forVEGFC), they were never significant in the follow-up analysis after applying the Bonferroni cor-rection in the simple or alternative method. (With the joint analysis, onlyFLT4ever reached significance and this happened in only one of the 200 simulations.)
All 13 genes simulated to be associated with Q2 passed the initial threshold in at least one replicate (ranging from 1 in 200 replicates forPLATandPDGFDto 70 in 200 replicates forVNN1). However, using the simple two-stage method, onlyVNN1ever reached our criterion for significance in stage 2 (in 10 replicates, among the 70 in which it passed stage 1), and onlyVNN1andSIRT1 ever reached significance under the alternative method (12 out of 70 times and 1 out of 22 times, respectively). Even when carrying out the joint staged analysis,VNN1 was significant in only 20 simulations, and no other gene was significant in more than 3 simulations. For this trait, power to detect associations was very low, and there were few false positives.
For trait Q4, no genetic effect was simulated. Because of the Bonferroni corrections applied, we would expect to find one gene meeting the final significance threshold in any particular replicate 5% of the time. In both the simple two-stage and joint analyses, the total number of signifi-cant findings in 200 replicates was 9 (experiment-wise error rate of 4.5%), which is consistent with expectation.
This suggests that the strategies have correct statistical type I error rates and that the false-positive results observed for Q1 are a result of correlation between genes.
Determinants of power to detect association
Using any strategy, we detected only a small number of the genes that were simulated. As shown in Figure 1A, the two genes we identified with highest power (FLT1 and KDR) contain 11 and 10 associated variants, respec-tively, with a total MAF greater than 0.1. Only two other associated genes, BCHE and SREBF1, have as many associated variants (13 and 10, respectively), but for these genes the total MAF of the associated variants is still low. The next most frequently detected gene was VNN1, which, along with VNN3, is one of only two other genes (both associated with Q2) for which the total MAF of the associated variants exceeds 0.1. Figure 1 shows not only that these genes contain fewer variants than the two genes detected but also that the average variant effect (simulated regression b coefficient) was smaller in these genes.
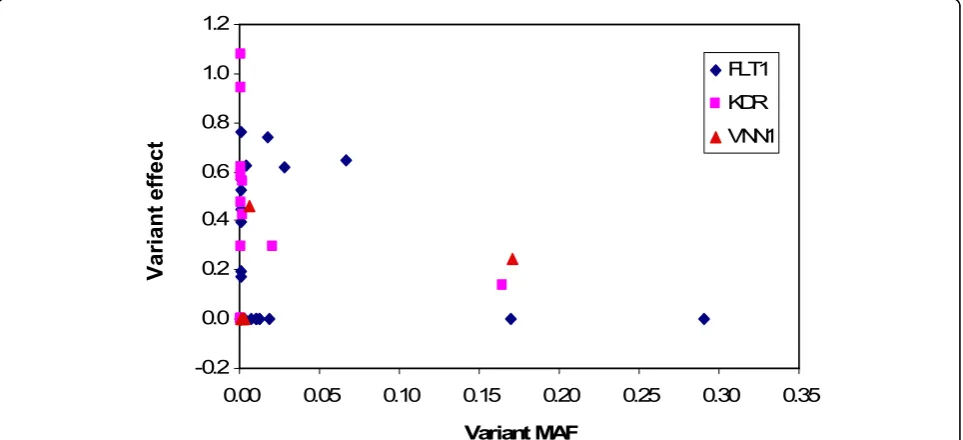
[image:3.595.57.540.111.294.2]Unsurprisingly, the critical gene characteristics deter-mining the power to detect an effect are the number of associated variants per gene, their total MAF, and the size of individual variant effects. However, the power to detect KDRwas remarkably lower than the power to detectFLT1 (Table 1), despite a similar number of variants (10 vs. 11), a higher total MAF of associated variants (0.19 vs. 0.12), and a comparable mean variant effect (0.54 vs. 0.52; see Figure 1). Figure 2 plots each variant effect withinFLT1, KDR, andVNN1 (simulated regression b coefficient) against its frequency. TheKDRvariants with strong effects (b> 0.3) are all extremely rare, in fact with no more than Table 1 Analysis of genes in relation to trait Q1 using the simple strategy, the alternative strategy based on more specific hypotheses, and the combined analysis with appropriate adjustment for multiple testing
Number of significant replicates
Gene Chromosome Number of variants in gene
Number of times passing stage 1 threshold
Simple strategy
Alternative strategy
Joint analysis
FLT1 13 35 195 188 187 195
OR2T34 1 16 166 79 77 140
KDR 4 16 165 75 39 146
PRR4 12 34 159 57 60 117
JAK1 1 12 150 49 45 105
CYP4F3 19 12 149 37 38 97
TAS2R48 12 12 148 41 53 102
ZNF91 19 9 145 45 42 87
HLA-B 6 28 143 33 36 89
INSR 19 16 138 42 39 91
LOC645118 19 5 125 24 21 73
CES1 16 30 123 28 32 64
three instances of each allele observed in the total data, whereas three of theFLT1variants with strong effects are much more common. The rarity of theKDRvariants has a drastic effect on power, although this is less marked in the combined analysis.
The two strategies for follow-up analysis performed similarly forFLT1 andVNN1 but not for KDR. This is likely again to be because most of the associated var-iants inKDR are rare; the variants that are observed in the initial data set and that are the basis of the “specific hypothesis” of the alternative strategy may not be
observed at all in the second data set. Conversely other rare variants seen only in the second data set will not be included in the test because of lack of initial information on their relevance.
Discussion and conclusions
The ability to resequence the genome or exome opens up new possibilities for the discovery of trait-associated variants whose frequencies are too rare for them to be likely to be discovered using genome-wide association studies. However, sequencing a large number of samples
KDR FLT1
VNN1 VNN3
0.2 0.4 0.6
va
riant
ef
fect
B
KDR FLT1
VNN1 VNN3
A
0.10 0.15 0.20 0.25
Undetected Detected
KDR
VNN3
FLT1 VNN1
o
ta
l MA
F
0.0
0.10 0.12 0.14 0.16 0.18 0.20
Total MAF Detected
Undetected
M
ean
0.00 0.05
0 2 4 6 8 10 12 14
Number of associated variants
[image:4.595.59.539.89.287.2]To
Figure 1Properties of the associated variants within a gene. (A) Sum of MAFs of associated variants within each of the simulated genes (9 genes for Q1 and 13 genes for Q2) as a function of the number of associated variants. (B) Mean simulated variant effect within the four genes with highest total MAF.
0.0 0.2 0.4 0.6 0.8 1.0 1.2
FLT1 KDR VNN1
Vari
ant
ef
fect
-0.2
0.00 0.05 0.10 0.15 0.20 0.25 0.30 0.35
Variant MAF
[image:4.595.58.540.490.710.2]is likely to remain expensive for the foreseeable future. We considered ways in which such approaches might be made more efficient by applying two-stage strategies. In our approach, only a small fraction of the genes (on average 140 [4.4%] for Q1, 50 [1.6%] for Q2, and 34 [1.1%] for Q4) would have to be resequenced in the sec-ond set of samples. We investigated whether further efficiency savings or possible improvements in power could be made by considering only certain variants within those genes, on the basis of the direction of asso-ciation in the initial sample. We expected that the method based on specific variants might improve power by removing from the gene’s summary statistic the noise variants that were not related to the trait (or even var-iants having an opposing effect); we also expected that power would be lost if variants were present in the training data set that were not found in the test set (pri-vate or very rare variants). Except in the case of one gene (KDR), the alternative method worked just as well as the simple strategy, even though less genotyping was required because fewer variants needed to be analyzed. Our analyses were conducted blind to the simulation models, but in fact in these models minor alleles were only ever associated with increases in trait values. Clearly, in this situation the alternative method we con-sidered would lose some of its potential advantages. Variants with no relationship to the trait would still be removed from the summary statistic (with probability 0.5), but there would be no variants with opposing effects to remove.
Because in the GAW17 data the genotypes were unchanged across replicates, we selected both the train-ing and the retest data sets from within one replicate. Of course, if extensive sequence data were available on a sample of size 697, analysis of the whole cohort making use of all data in a single stage would be considerably more powerful than any two-stage strategy, but our pur-pose was to assume that the cost of large-scale sequen-cing was the main limitation to increasing sample size. The joint analysis showed that, even with a staged design, with consequent savings in sequencing effort, if data were available on the selected genes from both stages, then it would be more powerful to incorporate all the data into the final analysis. However, there would still be a limitation in that few of the truly associated variants would pass the initial threshold. Power to detect rare var-iants was low with a sample size of 349, unless the total MAF of all the associated variants was high and the effect size strong enough. It would therefore be desirable to use a considerably larger sample size than this for the hypothesis-generating stage of a study, although it can be reasonably assumed that the cost of sequencing will stay high for some time, which makes the availability of extensive sequence data in large samples unlikely. In the
meantime, efforts must be devoted to the development of novel, more powerful methods. A recent study [8] high-lights the interest in two-stage designs, including a more in-depth sequencing of some genes or regions in the final stage.
The method we used to summarize the variants within a gene in the simple strategy included all minor alleles in the gene, which is unlikely to be the most powerful approach. In the alternative strategy (summing over spe-cific variants), the approach we used to restrict the ana-lysis to variants showing a beneficial (or deleterious) effect while reducing the impact of neutral variants was similar in spirit to the data-adaptive summation method of Han and Pan [9] (see also Dering et al. [10]). Various other approaches to reduce the number of variants tested have been proposed, such as setting a threshold allele frequency, including only nonsynonymous SNPs, or applying weighting schemes. Our purpose was to compare the specific-variant strategy with an analysis that does not utilize the information from the first-stage analysis; this strategy could easily be adapted to include further constraints on the variants, or weighting schemes, to derive alternative summary measures.
The simple strategy out-performed the alternative strat-egy for one gene, for which only very rare variants had a strong effect, suggesting that the alternative approach would not be advisable where the effect is mainly attribu-table to very rare variants. Further simulations are needed to investigate the potential superior power of the alterna-tive method when some variants within a gene have opposing effects. Consistent with previous findings, joint analysis of the stage 1 and stage 2 samples with appropri-ate correction for multiple testing is more powerful than either of the methods in which the follow-up data set is analyzed separately; this suggests that if raw data for the initial samples are available, joint analysis is the preferred method. It would be of interest to apply the alternative specific-variant method to joint analysis of the two stages, but it would be nontrivial to adjust the significance level appropriately (without complex simulation), because the stage 1 samples would be used both to define and to test the hypothesis.
Acknowledgments
We would like to thank Cancer Research UK for funding (Programme Award C588/A10589) and Mark Iles for useful discussions. The Genetic Analysis Workshop is supported by National Institutes of Health grant R01 GM031575. This article has been published as part ofBMC ProceedingsVolume 5 Supplement 9, 2011: Genetic Analysis Workshop 17. The full contents of the supplement are available online at http://www.biomedcentral.com/1753-6561/5?issue=S9.
Authors’contributions
Competing interests
The authors declare that there are no competing interests.
Published: 29 November 2011
References
1. Morris AP, Zeggini E:An evaluation of statistical approaches to rare variants analysis in genetic association studies.Genet Epidemiol2010, 34:188-193.
2. Li B, Leal SM:Methods for detecting associations with rare variants for common diseases: application to analysis of sequence data.Am J Hum Genet2008,83:311-321.
3. Price AL, Kryukov GV, de Bakker IW, Purcell SM, Staples J, Wei L-J, Sunyaev SR:Pooled association tests for rare variants in exon-resequencing studies.Am J Hum Genet2010,86:832-838.
4. Madsen BE, Browning SR:A groupwise association test for rare mutations using a weighted sum statistic.PLOS Genet2009,5:e1000384.
5. Almasy L, Dyer T, Peralta JM, Kent JW Jr, Charlesworth JC, Curran JE, Blangero J:Genetic Analysis Workshop 17 mini-exome simulation.BMC Proc2011,5(Suppl 9):S2.
6. Skol AD, Scott LJ, Abecasis GR, Boehnke M:Joint analysis is more efficient than replication analysis for two-stage genome-wide association studies. Nat Genet2006,38:209-213.
7. Luedtke A, Powers S, Peterson A, Sitarik A, Bekmetjev A, Tintle NL: Evaluating methods for the analysis of rare variants in sequence data. BMC Proc2011,5(Suppl 9):S119.
8. Liu DJ, Leal SM:Replication strategies for rare variant complex trait association studies via next generation sequencing.Am J Hum Genet 2010,87:790-801.
9. Han F, Pan W:A data-adaptive sum test for disease association with multiple common or rare variants.Hum Hered2010,70:42-54.
10. Dering C, Pugh E, Ziegler A:Statistical analysis of rare sequence variants: an overview of collapsing methods.Genetic Epidemiol2011,35(Suppl 8):12-17.
doi:10.1186/1753-6561-5-S9-S53
Cite this article as:Barrett and Nsengimana:Two-stage analyses of sequence variants in association with quantitative traits.BMC
Proceedings20115(Suppl 9):S53.
Submit your next manuscript to BioMed Central and take full advantage of:
• Convenient online submission
• Thorough peer review
• No space constraints or color figure charges
• Immediate publication on acceptance
• Inclusion in PubMed, CAS, Scopus and Google Scholar
• Research which is freely available for redistribution