Historical
influences
on
the
current
provision
of
multiple
ecosystem
services
Martin
Dallimer
a,*,
Zoe
G.
Davies
b,
Daniel
F.
Diaz-Porras
d,
Katherine
N.
Irvine
e,f,
Lorraine
Maltby
c,
Philip
H.
Warren
c,
Paul
R.
Armsworth
g,
Kevin
J.
Gaston
h aSustainabilityResearchInstitute,SchoolofEarthandEnvironment,UniversityofLeeds,LeedsLS92JT,UK
b
DurrellInstituteofConservationandEcology(DICE),SchoolofAnthropologyandConservation,UniversityofKent,CanterburyCT27NR,UK
c
DepartmentofAnimalandPlantSciences,UniversityofSheffield,S102TNSheffield,UK
dEscueladeCiencias,UniversidadAuto´noma‘BenitoJua´rez’deOaxaca,Oaxaca,Mexico e
Social,EconomicandGeographicalSciencesResearchGroup,JamesHuttonInstitute,Craigiebuckler,AberdeenAB158QH,UK
f
InstituteofEnergyandSustainableDevelopment,DeMontfortUniversity,Leicester,UK
g
EcologyandEvolutionaryBiology,UniversityofTennessee,Knoxville,TN37996,USA
h
EnvironmentandSustainabilityInstitute,UniversityofExeter,CornwallTR109FE,UK
1. Introduction
Land-usechangehasledtosubstantivealterationsintheamount andqualityofservicesthatecosystemscanprovide(Dearingetal., 2012;Tianhong et al.,2010;Zhao et al.,2006). While mapping ecosystemservicesisanecessaryfirststepindevelopingstrategies fortheirmaintenance(Chanetal.,2006;Daviesetal.,2011;Naidoo etal.,2008; Raudsepp-Hearneetal.,2010a), itpresents a static picture of current/contemporary distributions (e.g., Lautenbach
etal.,2011;Jiangetal.,2013).Tounderstandhowbesttomanage ecosystemserviceprovisioninresponsetoland-use/cover(LU/LC) change,anexpanding bodyofwork hasdeveloped model-based scenariostopredictlikelyfutureconsequences(Kareivaetal.,2011; Nelsonetal.,2009;UKNEA,2011).Thesestudiesoftenhighlighta declineinsomeservicesashumandevelopment(e.g.urbanisation, intensification ofagriculture) proceeds.Counter-intuitively, even thoughecosystemservicesareincreasinglydegraded(MEA,2005), human well-being continues to improve globally. One possible explanation may bethat time-lags exist between the effects of human-drivenlandtransformationsandpresent-dayprovisionof ecosystemservices(Raudsepp-Hearneetal.,2010b).
Indeed,time-lagsandfeedbacksareacommonandwidespread responsetoperturbationsinmanybiologicalsystems(Fosteretal., 2003;Nicholsonetal.,2009).Historicalland-usechangehasbeen showntoinfluenceecosystemfunctioninabroadrangeofstudies, ARTICLE INFO
Articlehistory: Received20April2014
Receivedinrevisedform31August2014 Accepted15January2015
Availableonline18March2015
Keywords:
Above-groundcarbon Culturalheritage Historicalecology Land-usechange Speciesrichness Urbangreenspace
ABSTRACT
Ecosystemserviceprovisionvariestemporallyinresponsetonaturalandhuman-inducedfactors,yet researchinthisfieldisdominatedbyanalysesthatignorethetime-lagsandfeedbacksthatoccurwithin socio-ecologicalsystems.Theimplicationsofthishavebeenunstudied,butarecentraltounderstanding howservicedeliverywillalterduetofutureland-use/coverchange.Urbanareasareexpandingfaster thananyotherland-use,makingcitiesidealstudysystemsforexaminingsuchlegacyeffects.Weassess theextenttowhichpresent-dayprovisionofasuiteofeightecosystemservices,quantifiedusing field-gathereddata,isexplainedbycurrentandhistorical(stretchingback150years)landcover.Fiveservices (above-groundcarbondensity,recreationaluse,birdspeciesrichness,birddensity,andametricof recreation experience quality (continuity with the past) were more strongly determined by past landcover.Time-lagsrangedfrom20(birdspeciesrichnessanddensity)toover100years(above-ground carbondensity).Historicallandcover,therefore,canhaveastronginfluenceoncurrentserviceprovision. Byignoringsuchtime-lags,weriskdrawingincorrectconclusionsregardinghowthedistributionand qualityofsomeecosystemservicesmayalterinresponsetoland-use/coverchange.Althoughsucha findingaddstothecomplexityofpredictingfuturescenarios,ecologistsmayfindthattheycanlinkthe biodiversityconservationagendatothepreservationofculturalheritage,andthatcertaincoursesof actionprovidewin-winoutcomesacrossmultipleenvironmentalandculturalgoods.
ß2015TheAuthors.PublishedbyElsevierLtd.ThisisanopenaccessarticleundertheCCBYlicense
(http://creativecommons.org/licenses/by/4.0/).
* Correspondingauthor.Tel.:+441133432846. E-mailaddresses:[email protected](M.Dallimer),
[email protected](Z.G.Davies),[email protected](D.F.Diaz-Porras),
[email protected](K.N.Irvine),l.maltby@sheffield.ac.uk(L.Maltby),
p.warren@sheffield.ac.uk(P.H.Warren),[email protected](P.R.Armsworth),
[email protected](K.J.Gaston).
ContentslistsavailableatScienceDirect
Global
Environmental
Change
j ou rna l hom e pa ge : w w w. e l s e v i e r. c om/ l o ca t e / gl oe n v cha
http://dx.doi.org/10.1016/j.gloenvcha.2015.01.015
withlegacyeffectsthatcanlasttens,hundredsoreventhousands ofyears(Fosteretal.,2003;SzaboandHedl,2011).Forexample, time-lagsinextinctionprocessesfollowinghabitatlosshavebeen documentedacrossseveral taxa (Kuussaari etal., 2009;Tilman et al.,1994). Given that many long-lived plants, or those with certainlife-historytraits(e.g.clonalpropagation,extensiveseed banks)areabletopersistforlongperiodsafterconditionsbecome unfavourable(Eriksson,1996),servicesunderpinnedbyvegetation areperhapsthemostlikelytobesubjecttoalegacyofpast land-use. For instance, plant species diversity in grassland is often heavilyinfluencedbyhistorical management(Gustavssonetal., 2007;Pa¨rteletal.,1999)and,similarly,harvestingandwildfiresin foresthabitatscanlimitannualcarbonstoredover60yearslater (Gough et al., 2007). Vegetation carbon storage is primarily determinedbytreesize(e.g.,Daviesetal.,2011)andthushasa stronglinktopastland-useandmanagement.
Likewise,legaciescanalsobeexpectedinasocialcontext,which couldinfluencetheprovisionofculturalecosystemservices,suchas thenumberofrecreationalvisitorstoaparticularlocation,orthe valuesthatpeopleassociatewithacertainsite.Forexample,inthe builtenvironment,featurescanactas‘‘icons’’(Hulletal.,1994).Such iconscanconveyaconnectionwiththepast,self-identityandasense ofcommunityfor localresidents. Indeed, a central aimof built culturalheritagepreservationistoenhancethecontinuityofthe historicalenvironment.This,inturn,helpstoconnectpeoplewith bothplaceandculture,therebycontributingtohowdesirableaplace istoliveand/ortovisit(e.g.,Ashworth,2008).
There is therefore a need to quantify the extent to which historical land-use determines the distribution of present-day ecosystemserviceprovision.Ananalysisofthistypeisparticularly pertinentwithinhuman-dominatedregions,suchasurbanareas, where shifts in landcover are dynamic, changing rapidly in responsetopolicy(Dallimeretal.,2011;McDonaldetal.,2010). Urbanisationisamajordriverofland-usechangeglobally(Seto etal.,2012),andwillcontinuetobegiventhattheproportionofthe world’spopulationthatlivesincitiesispredictedtoriseto70% overthenext40years(UnitedNations,2013).Furthermore,towns andcitiesaresettoexpanddisproportionately,asincreasesinthe areaofurbanisedlandgenerallyoutpacepopulationgrowth(Liu etal.,2003;ONS,2012b).
Urbandevelopmenthasprofoundimpactsonecosystemservice provision(Gu¨neralpetal.,2013;Setoetal.,2012;Tianhongetal., 2010;Zhaoetal.,2006),notleastbecausethecostsandbenefitsof greeninfrastructure(thenetworkofgreenspaces,waterandother vegetated features in towns and cities) are rarely considered in expandingcities.Thisisdespitetheplethoraofstudieswhichhave demonstrated the importance of urban green infrastructure in supportingthe deliveryofmultipleservices, suchastemperature mitigation(Myintetal.,2013;Parketal.,2012;Suscaetal.,2011), pollutionreduction(Manesetal.,2012;Pughetal.,2012),biological carbonstorage(Daviesetal.,2011),promotinghuman healthand well-being(MitchellandPopham,2007;Ward-Thompsonetal.,2012;
Dallimer et al., 2012a; Irvine et al., 2013, Keniger et al., 2013), facilitatinggoodsocialrelations(KuoandSullivan,2001; Sullivan etal.,2004),andtheprovisionofhabitatforbiodiversity(Daviesetal., 2011;Goddardetal.,2010;Dallimeretal.,2012b).Thesocialand culturalvalueofurbangreenspacesisalsoimportant(Barauetal., 2013;Gomez-BaggethunandBarton,2013;Tzoulasetal.,2007).
Here,forasuiteofeightecosystemservicesdeliveredbyurban greenspaces (Table 1), we examine the influence of historical landcover on present-day service provision within the city of Sheffield, UK. Using the UK National Ecosystem Assessment classification(UKNEA,2011),wedothisforoneregulatoryservice (above-ground carbon storage), multiple dimensions of two culturalservices(number of recreationalusers and the quality ofrecreationalexperience interms oftheself-reported
psycho-logical well-being of visitors to urban greenspaces) and three measuresofwildspeciesdiversity(speciesrichnessanddensityof twohighlyvisibleandcharismatictaxonomicgroups;plantsand birds).Thechoiceofserviceswasinfluencedbythedesirabilityof havinga spatiallyand temporallysynchronous primarydataset likelytospanabroadrangeofpotentialhistoricalrelationships. Wewerethusconstrainedtoacombinationofmeasuresthatwas compatible with the resources available for data collection. However, if anything, the eight measures are biased towards those witha culturaldimension, whichareoftenthoughtof as moredifficulttoquantify(UKNEA,2011).
2. MaterialsandMethods
2.1. StudySystem
Sheffield(538220N,18200W) isa typicallarge cityinEngland (JenksandJones,2010)andhasahumanpopulationof552,700 (ONS,2012a). Itliesattheconfluenceoffiverivers, theLoxley, Rivelin,Porter,SheafandDon.Asixth,theBlackburn,entersthe cityonitseasternfringeswhereitjoinstheDon(Fig.1).Therivers have a long history of human exploitation and their physical propertieshavebeencriticalindeterminingthedevelopmentof Sheffield(CrossleyandCass,1989).Riparianzonesthereforemake an ideal system to investigate land-use legacies on ecosystem serviceprovisionandformthefocusofthisstudy.
Industrialoutputandthehumanpopulationofthecitypeaked inthe1950s,andbothcontractedrapidlythroughthelatterhalfof the 20th century, resulting in large areas of vacant former industrial land by the mid-1980s (Hey, 2005), much of which hassubsequentlybeenredeveloped.Pollutionandenvironmental degradationfollowedtherapidurbanisationand,despitetheearly recognition of the importance of greenspaces associated with rivers(Abercrombie,1924),theDonremainedhighlypolluteduntil the 1980s (Firth, 1997). Much of this particular river is still dominatedbylarge-scaleindustrialandcommercialuse.Despite thishistoryofhumanexploitation,long-establishedpublicparks andnetworksoffootpathsarelocatedalongthePorter,Rivelinand Sheaf that pass through residential areas of south and west Sheffield.Morerecentredevelopmentinitiativeshave incorporat-ed new public greenspaces and access routes along the city’s waterways.In parallel, there hasbeena renewed focus on the appreciationofthehistoricalimportanceofthecity’srivers(e.g.,
Griffiths, 1999; Kendall, 2005). Given that riparian areas are distributed throughout the urban, suburban and more rural peripheryofthecity,theyhavethepotentialtodeliverarange ofecosystemservicestourbandwellersandwecanexpectthat therewouldbeanhistoricalaspecttotheirprovision.
2.2. SurveyDesign
2.3. LandcoverClassification
Wegeneratedatimelineoflandcoverforthe107sitesusing datadatingbackover150years.Thedecadeschosenreflectthe availability of historical topographical maps: the 2000s (the mostrecentmapseries),1980s,1960s,1940s,1890sand1850s (Fig. 2). Landcover at each site was recorded in one of four categories: (a) developed (buildings, roads, other impervious surfaces);(b)urban greenspace(parks,gardens,playing fields, allgreenopenspaceenclosedbyurbandevelopment);(c)open landoutside urbanareas(agriculturalland,moorland) and(d) woodland (all types of tree cover). More resolved landcover classificationwasnotpossibleduetovariabilityintheclarityof
the historical topographical maps. Equally, we restricted our datasettovariablesthatcouldbeacquiredfromalltimeperiods. As landscape-scale processes are likely to be important in determining biodiversity and ecosystem service provision in urban areas,theproportionofa circularbuffer(100mradius) around each site that was covered by urban land was also estimated.
2.4. QuantifyingPresent-dayEcosystemServiceProvision
2.4.1. Above-groundCarbonStorage
Tree density across the study sites was highly variable (0.0005–0.0797 treesm2),so we employeda variableradius
Table1
EcosystemservicesquantifiedacrossripariangreenspacesinthecityofSheffield,UK,andtheirhypothesisedrelationshipwithhistoricalland-use,coverormanagement.
Service Context Historicalinfluences Hypothesised
relationshipwith pastland-use
Above-groundcarbonstorage Animportantecosystemservicetowhich townsandcitiescancontribute.Although smallcomparedwithcarbonemissions, thesizeofurbancarbonreservoirsappears substantial(Daviesetal.,2011).
Above-groundcarbonstorageislargelydeterminedby thedensity,sizeandspeciesoftreepresent(Davies etal.,2011).Treecoverincitiesconstantlychangesdue tonaturalprocesses(growth/regeneration)andhuman decisionstoplant/removeindividualtrees(Nowakand Greenfield,2012).
Currentvegetationstructureandcoverinurbanareasis oftenbetterexplainedbypastconditions(Hopeetal., 2003;Lucketal.,2009;Pickettetal.,2008).
Strong
Wildspeciesdiversity Biodiversityisconsideredcentralto supportingallecosystemservices (Balvaneraetal.,2006),butisoftennot thoughtofasaservice(Maceetal.,2012). Weincludetherichnessoftwohighly visibleandculturallyimportantgroups (plants,birds)duetotheirassociateduse andnon-usevaluesforUKcitizens (UKNEA,2011).Largenumbersofpeople activelyparticipateincitizenscience projects(e.g.,over600,000peopletook partintheRSPB’sannual‘‘GardenBird Watch’’citizenscienceevent;and/orare membersofconservation/wildlifeNGOs (e.g.,around3.7millionpeopleare membersoftheNationalTrust).
Plantspeciesrichnessisrelatedtohistoricalland-use, managementandsocio-economiccharacteristicsacross locationsandhabitattypes(Gustavssonetal.,2007; Lucketal.,2009;Pa¨rteletal.,1999).
Althoughthepatternsarelessclearthanforplants,the persistenceofbirdspeciescanbedeterminedbypast land-usechangesandhabitatfragmentation(Fordetal., 2009;Kampetal.,2011).
Plantrichness: Strong Birdrichnessand density:Weak
Recreation(numberofusers) Governmentpolicies(EEA,2009;ODPM, 2003)seektoencourageincreased provisionandusageofurbangreenspaces.
Theeffortinvestedbyhumanvolunteersinprotected areasintheregionispositivelyrelatedtohowlongthe areahasbeenmanagedforconservation(Armsworth etal.,2013).Wethereforepostulatethatolder greenspaceswillreceivemorevisitors,perhapsbecause theyarebetterknownandvaluedbythesurrounding community.
Culturalheritagepreservationaimstoconnectpeople withplacesthroughthehistoricalcontinuityofthebuilt environment(e.g.,Ashworth,2008).WithinSheffield,a recentfocusonencouragingpeopletovisithistorical locationsalongthecity’sriversmayresultinthe numberofrecreationalusersatasitebeingrelatedto pastland-use.
Weak
Recreation(qualityofexperience) Greenspacesofferresidentsopportunities forimprovingtheirphysicalandmental health(Bermanetal.,2008;Bowleretal., 2010).Self-reportedpsychological well-beingcandependonthephysical propertiesofthegreenspaces(Dallimer etal.,2012a).
Attentionrestorationtheoryproposesthatthenatural world,includingurbangreenspaces,iscognitively restorative(KaplanandKaplan,1989),somethingthatis likelytobeassociatedwiththecurrentfeaturesofa greenspace.
Thesense-of-placeframeworksuggeststhatthe relationshipbetweenpeopleandgreenspacesmaybe understoodintermsofthesiteitself.Wefocushereon humanemotionalattachmentswithphysicallocations (AltmanandLow,1992)andonthesenseofidentitythat maybedevelopedbyassociationwithaparticular location(Proshanskyetal.,1983).Weconsiderthe relationshipwithplacetoincludeacognitive,or conscious,dimensionsuchthatthemeaning,thoughts, valuesandmemoriesofaplaceheldbyanindividualare linkedtoone’s‘senseofplace’.Thisrelationshipislikely todevelopandstrengthenthroughtime.
plotmethod(analogoustothedistancesamplingmethodsused forbirds;seeSection2.4.2)withwhichtoassesscarbonstorage.At each study point the distance to the five nearest trees was measured.Theseindividualswereidentifiedtospeciesandtheir diameteratbreastheightandcrownheightrecorded.Datawere convertedintoabove-grounddry-weightbiomassforeachtree usingallometricequationsobtainedfromtheliterature(Davies et al., 2011). A site-specificabove-ground carbondensity was calculatedbydividingthetotalcarbonstoredinthefivenearest treesbythecircularareacontainingthosetrees(i.e.,ifthefive treeslaywithin10mofthestudypoint,thenthetotalcarbon storedwasdividedbytheareaofa10mradiuscircletoderive carbondensity).
2.4.2. WildSpeciesDiversity
The density and richness of birds was surveyed across all 107sites(Dallimeretal.,2012b;Rouquetteetal.,2013).Following standard protocols, two visits were made in spring and early summer2009tocoincidewiththebreedingseason,withthesecond visitatleast6weeksafterthefirst.Toensurethatthemaximum numberofspecieswasencountered,visitsbeganbetweenoneand threehoursaftersunrise(thetimeofhighestbirdactivity)andwere onlycarriedoutinsuitableweatherconditions(lowwind,norainor mist).Asingleobserver(MD)recordedtheidentityofeachbirdthat was seenor heard from the survey point over a 5minperiod, excludingindividualsthat wereflying overthe site.A listof all speciesencounteredduringbothvisitswascollated.
Fig.1.TheurbanareaofSheffield(shaded)showingthesurveyedripariansitesinthecity(filledcircles—recreationalusers,plants,birdsandabove-groundcarbondensity;open circles—plants,birdsandabove-groundcarbon;crosses—qualityofrecreationexperience).Riversareindicatedbysolidlines.TheinsetshowslocationofthestudyareainBritain.
Table2
Samplesize(N),meanandstandarderrors(SE)andrangeforecosystemservicesacrosstheripariangreenspacestudysitesinSheffield,UK.
Ecosystemservice Measure N Mean(SE) Range
Above-groundcarbonstorage Carbondensity(kgm2
) 102 7.661.01 0.01–56.50
Wildspeciesdiversity Birdspeciesrichness 107 11.090.30 4–19
Plantspeciesrichness 100 43.301.47 9–95
Totalbirddensity(birdsha1) 107 21.99
0.93 5.82–74.37
Recreation Numberofusers(index) 74 22.884.31 0–288
Qualityofexperience Reflection 34 3.910.03 3.26–4.43
Attachment 34 4.230.03 3.42–4.67
The radial distance from the observer to each bird was measured (using a laser rangefinder), which allowed distance samplingtechniquestobeemployed (Thomasetal.,2010). Bird densities were calculated using Distance software (version 5.0, release2),sothatthe variabilityinspecies’ detectabilitycanbe incorporatedintoestimatesoftheirdensity.Species-specificdensity functions were estimated for all species with 60 or more registrations.Forlesscommonspecies, adetectionfunction was estimatedusingregistrationsforagroupofsimilarspecies.Wealso controlledforthecuetypeusedtolocatethebird(i.e.,whetherthe birdwasonlyheard,orwhetheritwasalsoseen).Subsequently, candidatemodelsofthedetectionfunctionwerechosenandtested againstthedata.ModelselectionwasbasedonminimumAkaike InformationCriteria(AIC)and
x
2goodnessoffittests.Thedetection functionmodelwasthenappliedtothenumberofencountersat eachpointlocationtogiveaspecies-specificestimateofthedensity. Thedensityforallbirdspeciesrecordedatasitewassummedtogive anestimateofthetotalbirddensity.Forplantspeciesrichness,all forbsandwoodyplantswereidentifiedtospecieswithina40mby 10marea(longaxisparalleltotheriver),centredonthebirdsurvey location.Surveyswereconductedat100sites(Dallimeretal.,2012b; Rouquetteetal.,2013).2.4.3. NumberofRecreationalUsers
For74sitesthathadsomerecreationalaccess(publicparksor rightsofway,informalpaths),countsofallvisitorswithina20min periodweremadeonthreeoccasionsduringsummer2009.The
numberofvisitorsineachperiodwassummedtogiveanindexof humanuse.Surveyswerecarriedoutinsummerasthisisthetime ofyearwhenthegreatestnumberofpeopleislikelytobepresent. Atthesubsetof34sites(seeSection2.4.4)whereinterviewswere conducted, estimates of visitor numbers per hour were also recorded.Thetwometricsofhumanusagewerehighlycorrelated (Pearson’sr=0.874,p<0.001),thereforeinsubsequentanalyses we used thedataset with thehigher sample size and broader spatialcoverage(i.e.,wherecountstookplaceover20min).
2.4.4. QualityofRecreationExperience
Weusedself-reportedpsychologicalwell-beingtomeasurethe qualityoftherecreationalexperience.Forasubsetof34siteswith good public access, we developed a questionnaire to derive estimatesofindividualvisitorwell-being(Dallimeretal.,2012a). Thequestionnairewasdeliveredface-to-faceinsituto1108visitors. Sevenclosed-endedwell-beingstatementsmeasuredreflectionand contemplation,whileafurther14assessedemotionalattachment andpersonalidentity.All21statementsuseda5-pointLikertscale (1=stronglydisagree,5=stronglyagree)inresponsetothestem question‘‘Pleaseindicatehowmuchyouagreewitheachstatement about this stretch of river and the neighbouringbanks’’. Factor analysis identifiedmeaningful subscalesofstatementsproviding the following interpretable well-beingaxes:reflection (abilityto thinkandgainperspective);attachment(degreeofemotionalties withthestretchofriver);andcontinuitywithpast(extenttowhich sense-of-identityislinkedtothestretchofriverthroughcontinuity
acrosstime).Continuousmeasureswerederivedbycalculatingthe participant’saverageratingofthesetofstatementsformingeach factor(forfulldetailsseeDallimeretal.,2012a).
2.4.5. DataAnalysis
Takingaregression-basedapproach,andusingtheappropriate error structure (Poisson or quasiPoisson, to account for over-dispersionasnecessary,forcountdata),wemodelledpresent-day ecosystemserviceprovisionasaresponsetolandcoverineachofthe sixtimeperiods(the2000s,1980s,1960s,1940s,1890s,1850s). Previousanalysesrevealedalackofspatialautocorrelationinthis system(Dallimeretal.,2012b),soitis notaccountedforinour analyses.Explanatoryvariablesincludedthelandcovercategoryat thesurveysite,theproportionofdevelopedlandinthe100mbuffer andtheirinteraction.Weincludedinteractionstoexaminewhether particular services had different forms of relationship with the proportionofdevelopedlandsurroundingasurveypoint,dependent onthelandcoveratthesiteitself.Forexample,asitecategorisedas woodlandmayreceivemorerecreationalvisitorsastheproportion ofthesurroundingbuffercoveredbydevelopedlandincreases,but theoppositemaybetrueforasitethatiscategorisedasdeveloped. Thesmallersamplesizefortherecreationqualitymetricsprecluded theinclusionofinteractionterms.
Asland-useatasiteinonetimeperiodislikelytoberelatedtothe previous time period, data are not independent. We therefore refrained from including explanatory variables from different historicalperiodsinthe sameregressionmodel,instead electing touseAICccomparisonsbetweenfullmodelsforeachtimeperiodto determine which historical landcover dataset offered the best explanation for present-day ecosystem service provision. We assumedthat the model with the lowest AICc offered the best explanationforvariationinpresent-dayserviceprovision.However, modelsthatdifferfromthisby
DAICc
<2offeranequallyplausible explanationforthedata(BurnhamandAnderson,2002),withall modelswithinthismarginassumedtobeequivalent.Thus,ifthe AICcfromalandcovermodelfroman historicaltime periodfell withintwoAICcunitsofthe2000smodel,wedidnotconsiderthere tobeevidenceforhistoricallandcoverinfluencingcurrentservice levels. Similarly, where models from two time periods were equivalentaccordingtoAICc,wetookthe conservativeapproach of considering the most recent model as offering the best explanationforpresent-dayserviceprovision.3. Results
Betweenthe1850sandthe2000s,thenumberofsitesclassified asurban/developedincreasedbyanorderofmagnitude(Table3). Urban greenspace sites rose fourfold and those classified as woodlanddoubled.Thesechangeswerematchedbyaconcomitant decrease in the open land category. Similarly, the median proportionofurbandevelopmentinthe100mbuffersurrounding eachsurveypointrosefrom0to50%(Table3).Ourstudysitesare representativeofcurrentriparianlandcoverandriverfeatures(see
Section2.2).Nevertheless,untilthe1960s,thepatternofhistorical landcover change we observed was broadly similar to that experienced by Sheffield as a whole (Table 3) (Dı´az Porras, 2013). After this date, landcover trajectories diverged, with a higherproportionofthecityasawholeclassifiedas‘‘developed’’ whencomparedtoourstudysites.Differentlandcoversexhibited varyingdegreesofstabilitythroughthetimeperiodofourstudy (Fig.3).Developedlandrarelychangedcategorisation,althoughin morerecenttimeperiodssomedevelopedsiteswerere-classified as urban greenspace, generally reflecting the presence of abandoned former industrial sites in the city. As would be expected,therewasanotablemovementofsitesfromtheopen land into developed and urban greenspace categories. Sites categorisedaswoodlandtendedtoremainconstant.
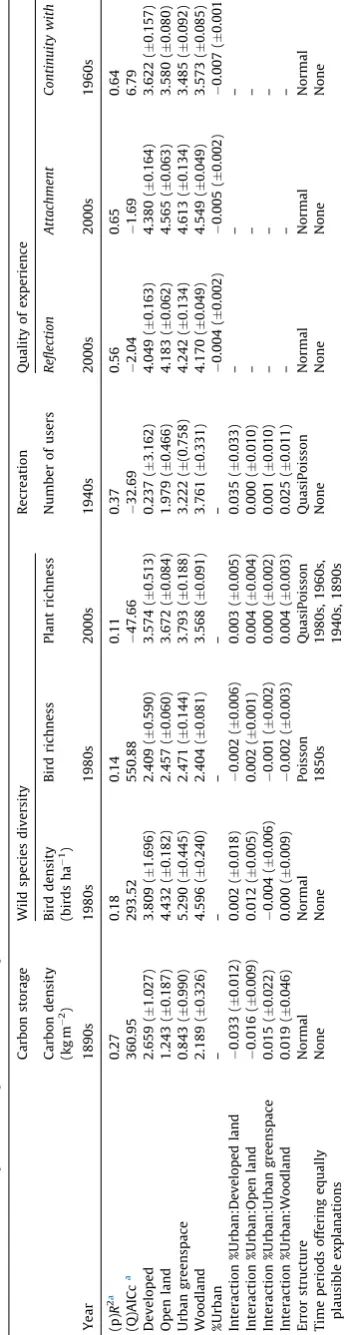
Ecosystem service provision varied across the study region (Table2).Historicallandcoverofferedabetterexplanationforthe variationinfiveoutoftheeightecosystemservicemeasuresthan currentlandcover(Figs.4and5).Forexample,R2forabove-ground carbon density modelled against current landcover was 0.14 comparedto0.27fordatafromthe1890s(Fig.4a).AICccomparisons also indicated that landcover from the 1890s offered the best explanation forpresent-day variationin carbondensity. Indeed, therewas a strongsignal fromhistoricallandcoveras,withthe exceptionofthe1850s,modelsfromallhistoricalperiodsoffereda better explanation for current patterns of above-ground carbon storagethandatafromthe2000s.Thestrengthanddirectionofthe relationship between above-ground carbon density and the explanatory variables was similar across different time periods (againwiththeexceptionofthe1850s;Tables4andS1).Similarly, apartfromthe1850s,above-groundcarbondensitywashighestfor landcoversclassifiedasdevelopedorwoodland.Forsitesclassified asurbangreenspacein1890,carbondensitywasnegativelyrelated totheproportionofurbanlandinthesurroundingbuffer(TableS1). Acrossthethreemeasuresofwildspeciesdiversity(Figs.4b–d), theinfluenceofhistoricallandcoverwaseitherabsentormodest. The best explanation for current-day variation in bird density (Fig.4b)andrichness(Fig.4c)wasofferedbyhistoricallandcover fromthe1980s.However,theimprovementinAICc(andincrease in explanatory power) relative to 2000s was modest, and the strength and direction of the relationships with landcover variables was similar(TableS1). For bird density,landcover in allothertimeperiodsofferedasubstantiallyworseexplanationof thedatathaneither2000sor1980sdata.Birddensitywaslower forsitesclassifiedasdevelopedinthe1980s,buttherewaslittle differenceinbirdspeciesrichnessbetweenlandcovercategories (Table 4). Historical landcover was not related to present-day variation in plant richness any more strongly than 2000s landcover, withlittle difference inQAICc values acrossalltime periods.Explanatorypowerpeakedat0.16acrossallplantrichness models(Table4),withtheparameterestimatesforthelandcover categoriesbroadlysimilaracrossalltimeperiods(TableS1).
There wassubstantialvariation in theabilityof currentand historical landcover datato explainthe numberof recreational
Table3
Surveysites(N=107)classifiedaccordingtolandcoverforeachtimeperiod,andthemedian(interquartilerange)percentcoveragebyurbandevelopmentina100mbuffer surroundingeachsite.Acrosstheentirecurrentlyurbanisedareaofthecity4.2%ofthecurrentlyurbanisedareaofthecitywasclassifiedasdevelopedin1850.Thisincreased to10.1,14.9,22.6,31.6and41.5%forthe1890s,1940s,1960s,1980sand2000s,respectively(Dı´azPorras,2013).
Landcover
Timeperiod Developed Urbangreenspace Woodland Openland %Urbanin100mbuffer
1850s 3(2.8%of107sites) 5 15 84 0(0–5)
1890s 14(13.1%) 6 20 67 5(0–20)
1940s 21(19.6%) 13 19 54 10(0–90)
1960s 23(21.5%) 16 21 47 30(5–95)
1980s 24(22.4%) 21 26 36 40(5–97.5)
usersatourstudysites(Fig.5a).Thelandcovermodelwiththe lowestQAICc was fromthe1940s, withpR2 varying from0.15 (1850s)and0.17(2000s),to0.37(1940s).Withtheexceptionof the 1850s data, models from all time periodsoffered a better explanation (lower QAICc and higher pR2) of patterns of recreationalusethanthemeasuresoflandcoverfromthe2000s. Present-dayusagewashigherforsitesthatwereclassifiedasopen, woodlandorurbangreenspaceinthe1940sthanthoseclassifiedas developed.Usageincreasedwiththeproportionofland surround-ingthesitethatwasalreadyurbaninthe1940s(Table4).
Foronemeasureofthequalityoftherecreationalexperience (continuity with past), the best explanation for current-day variation was offered by landcover in the 1960s (Fig. 5), with themeasureofwell-beingnegativelyrelatedtotheproportionof thesurrounding100mclassifiedasurbaninthattimeperiod.The improvement in AICc relative to present-day landcover was substantial and was matched by an increase in R2. For the remainingtwomeasuresofwell-being(reflectionandattachment), the 2000s landcover models offered both the lowest AICc and highest R2 (Fig. 5). For all well-being measures, the direction (positive/negative)of therelationship with landcover variables wassimilaracrossmodels(TableS1).
4. Discussion
The provisionof ecosystem servicesvaries temporally( Lau-tenbach et al., 2011; Jiang et al., 2013; Holland et al., 2011).
Nonetheless,theprevailingapproachtotheirstudyhasbeento quantifyprovisionbasedonanalysesthatgenerallyignore time-lags and feedbacks within and between social and ecological systems (Carpenteret al., 2009; Nicholson et al., 2009), using contemporaryland-useproxiestomapthespatialdistributionof services (Seppelt et al.,2011). Yetwe report relativelymodest explanatory power for several relationships between current landcover and ecosystem service provision; something not uncommon in the literature (e.g., Eigenbrod et al., 2010). Our results demonstrate that, for some ecosystem services, past landcoverisabetterpredictorofcurrentprovisionthanpresent landcover,andhighlighttheneedtoincorporatelegacyeffectsinto ecosystemserviceprovisionmodels.
Forfiveoutoftheeightecosystemservicesexaminedhere,past landcoverofferedabetterexplanationforpresent-dayvariationin service provision when compared to current landcover (cf.
Table1).Thestrengthandlengthofthetime-lagvariedaccording totheservice;rangingfrommorethan100yearsforabove-ground carbon density, through 60years for human visitor numbers, 40yearsforcontinuitywithpastwell-being,to20yearsfortotal birddensityandrichness.Therewasnoevidenceofatime-lagfor theremainingmeasuresofwell-being(cf.Table1).Anyecosystem islikelytobesubjecttoanumberofhistoricalinfluences,which willbeduetoitsinherentproperties,aswellashuman-induced alterations (Holland et al., 2011). When examining multiple services, we should thus expectthat each service will respond tolandcoverfromdifferentpointsinthepast.
Withincities,manydimensionsofvegetationareoftenbetter explainedbypastcharacteristics,withtemporallagsoftendueto socialandecologicalchangeshappeningatdifferentrates(Luck etal., 2009;Troy etal., 2007). Althoughwe findno conclusive
evidencethatplantspeciesrichnessisrelatedtopastlandcover, twodifferentbiodiversitymetrics,birdrichnessanddensity,were morestronglypredictedbylandcoverfromthe1980sthanfrom the present-day, although the improvement in model fit was
Fig.4.DAICc(solidcircles—lowerDAICcrepresentsmoreplausiblemodels)andR2
(opensquare—higherR2
representsbetterexplanatorypower)forpresent-dayecosystem servicemeasuresacrosstheriparianareasofSheffieldfor:(a)carbondensity;(b)birddensity;(c)birdrichness;and(d)plantrichness.Thehorizontaldottedlineindicates DAICc=2.Wheremultipletimeperiodsofferplausibleexplanationsforthedata(differenceinAICc<2 betweenmodels),wetooktheconservativeapproachofconsidering themostrecentmodelasofferingthebestexplanationforpresent-dayserviceprovision(seeSection2.5;Table 4).
(a)
(b) (d)
(c)
Fig.5.DAICc(solidcircles—lowerDAICcrepresentsmoreplausiblemodels)andR2
(opensquare—higherR2
relatively modest. Given that the above-ground carbon stocks associated with vegetation are closely correlated with biomass density (i.e., treesize and number)they aremore likely tobe relatedtohistoricalmanagementandlandcoverthanpresent-day conditions(Fosteretal.,2003;Goughetal.,2007).ForSheffield’s ripariangreenspaces, above-groundcarbonstockswerestrongly predictedbylandcoverover100yearsago.However,regardlessof whichtimeperiodweexaminedbetweenthe1890sandthe2000s, thestrengthanddirectionofrelationshipsbetweenabove-ground carbonstocksandlandcoverweresimilar.
Peoplehavemultiplemotivationsforvisitingurbangreenspaces, whicharenotlimitedtotheprosaic(e.g.,proximity,convenience)and canincludereasonsthatarerelatedtothephysicalfeaturesof,aswell astheemotionalqualitiesassociatedwith,thesite(Dallimeretal., 2014;Irvineetal.,2013).Itisthereforeplausiblethatlandcovercould influenceboththenumberofvisitorsagreenspacereceives,andthe well-beingthatvisitorsgainwhilstthere.Herewefoundthatthe numberofrecreationalvisitorstoripariangreenspacesinSheffield wasmorestronglydeterminedbylandcoverover60yearspreviously than bypresent-day conditions.Likewise,anapproximate40year temporallaginfluencedcurrentlevelsofonemetricofwell-being (continuitywith thepast)associated withrecreational experience. Thesetime-lagssuggestthatland-usedecisionsmademanydecades agocanhavelong-lastingimplicationsforthehumanpopulation, reinforcingtheimportanceofretainingandenhancingexistinggreen infrastructurewithincities,ratherthansimplycreatingnewsites.This isparticularlygermanegiventhatprovidingurbangreenspaces,in order to encourage their use and thereby deliver individual and societalbenefits,isanimportantpolicyobjective(EEA,2009).
Whenseekingtounderstandtherelationshipbetweenpeople and the environment, ourfindings highlight the importance of consideringthedynamicinterplayamongthespatialandtemporal aspectsofthe biophysicalalongsidethecognitiveandemotional processesofindividuals(e.g.,diCastrietal.,1981;Ittelsonetal., 1974; Kaplanand Kaplan, 1989). What is intriguingis that this relationshipisevidenteventhoughmostofourparticipantsare unlikelytohaveexperiencedthestudylocationsdirectlybetween 40to60yearsago.Theresultsthereforepointtotheneedtoconsider thesocio-culturalcontextwithinwhichtheperson–environment interaction occurs(e.g.,Bonnes and Secchiaroli,1995; Nassauer, 1997)andthepotentialinfluenceoflong-standingfeatures(e.g.,the presence of older trees (O’Brien, 2004) and/or historical built infrastructure(Hulletal.,1994).Forexample,itmaybethat well-establishedgreenspacesaremorewidelyvaluedbycityresidents, whoarethereforemorelikelytovisitthem.Inthecontextofourcase study city, the relatively recent focus on the preservation and appreciationofculturalheritage(e.g.,Griffiths,1999;Kendall,2005) mayencourageresidents(eitherconsciouslyorsubconsciously)to visitmoreestablishedgreenspaces.Indeed,heritagepreservationis undertaken fora rangeof reasons,but canincludeenhancinga location’scharacter,identityorsenseofplace(Hulletal.,1994)thus maximisingitscontributiontothecreationofaliveablecommunity (e.g.,TimothyandNyaupane,2009).Giventhetheoreticalgrounding ofourcontinuitywithpastmetricinthe senseofplaceliterature (Table1)(e.g.,Proshanskyetal.,1983),theeffectofpastland-useon present-daywell-beingiswhatmightbeexpected.
Althoughwefoundnolegacyeffectofhistoricallandcoverforthe twootheraspectsofwell-being(reflectionandattachment), land-coverwasastrongpredictorofallthreemeasuresofpsychological wellbeing. Boththeory (Kaplan andKaplan,1989;Kaplan,1993, 1995)andempirical research(e.g.,Gulwadi,2006;Herzogetal., 1997;Staatsetal.,2003;TalbotandKaplan,1984)supporttheidea thatthenaturalenvironmentcanfacilitatethinkingthrough,and reflectingon,issuesandsuggestthatpeopleactivelyselectcertain typesofsettingsforsuchpurposesthatareoftenofamorenatural configuration. It may be, therefore, that landcover acts as an
[image:9.595.86.261.70.739.2]objectivemeasureofsomeenvironmentalqualitiesthatthepeople involvedin ourstudy were seeking.Within the sense of place literature,theconnectionorbondbetweenapersonandaspecific place, as measured by our attachment metric, has been widely discussed(forreviewsseeAltmanandLow, 1992;Manzo,2003; ScannellandGifford,2010).Perhapsmostrelevantinrelationtothis study is the emphasis on direct experience (e.g., Manzo, 2005
‘‘experience-in-place’’concept)andthephysicalcharacteristicsof theplaceitself(e.g.,Stedman,2003).
5. Conclusions
Theconceptthathistoricalinformationcanhelpin understand-ingthepresent-daypropertiesofecosystemsisincreasinglybeing recognised. Nevertheless, land-use time-lags do not routinely featureinpredictingecosystemserviceprovision.Thisisapotential weaknessoftheirapplication.Indeed,somehistoriansarguethat historicalelementsarefundamentaltoconservationbiologyand that the discipline will continue to be incomplete if history is neglected(Meine,1999;Newelletal.,2005;Szabo,2010).No field-derivedmeasuresofecosystem servicesprovisioncontemporary with the historical maps were available, precluding us from undertaking any form of time series analyses and therefore addressingissuesofcausality.Nevertheless,wehavedemonstrated possible links between past landcover (covering periods 20 to 100years ago) and the present provision of some ecosystem services.Thisemphasisesthathistoricaldimensiontobiodiversity andecosystemservicesmanagementisessential,especiallyin fast-changingurbanecosystems.Examiningothermetricsoflandcover atdifferentspatialscales(cf.,Dallimeretal.,2010)and/orlandcover change trajectory and stability (e.g., Watson et al., 2014) offer informativeavenuesforfutureresearch.Althoughourfindingsadd tothecomplexityofpredictinghowecosystemservicedeliverymay respondtoscenariosofLU/LCchange,ecologistsmayfindthatthey canlinkthebiodiversityconservationagendatothepreservationof culturalheritage,andthatcertaincoursesofactionprovidewin–win outcomesacrossmultipleenvironmentalandculturalgoods.
Acknowledgements
We thankthepeopleofSheffieldwhotookpart inthe study. AndrewSkinner,JamesRouquette,GryphonFelski,JosephMoore, GrantBramall,ChrisDuffyandRuthHallamhelpedinthefield.Maps were obtained from Digimap Ordnance Survey and Historical Collections(www.edina.ac.uk).K.N.I.wassupportedbytheScottish Government’s Rural and Environmental Science and Analytical Services Division (RESAS). Research was supported by the UK government’sEPSRC(grantEP/F007388/1totheURSULA consor-tium)andanEU-FP7MarieCurieFellowship(grant273547)toM.D. AppendixA. Supplementarydata
Supplementarydataassociatedwiththisarticlecanbefound,in theonlineversion,atdoi:10.1016/j.gloenvcha.2015.01.015.
References
Abercrombie,P.,1924.Sheffield:ACivicSurveyandSuggestionsTowardsa Devel-opmentPlan.UniversityofLiverpool,Liverpool.
Altman,I.,Low,S.M.,1992.PlaceAttachment:HumanBehaviorandEnvironment. PlenumPress,NewYork.
Armsworth,P.R.,Cantu´-Salazar,L.,Parnell,M.,Booth,J.E.,Stoneman,R.,Davies,Z.G., 2013.Opportunitiesforcost-sharinginconservation:variationinvolunteering effortacrossprotectedareas.PLoSONE8,e55395.
Ashworth,G.,2008.InsearchofthePlace-identityDividend:UsingHeritage Land-scapestoCreatePlaceIdentity.In:Eyles,J.,Williams,A.(Eds.),SenseofPlace, HealthandQualityofLife.,Ashgate books.http://www.ashgate.com/isbn/ 9780754673323.
Austin,M.P.,Heyligers,P.C.,1989.Vegetationsurveydesignforconservation: Grad-sectsamplingofforestsinnorth-easternNewSouthWales.Biol.Conserv.50,13.
Balvanera,P.,Pfisterer,A.B.,Buchmann,N.,He,J.S.,Nakashizuka,T.,Raffaelli,D., Schmid,B.,2006.Quantifyingtheevidenceforbiodiversityeffectsonecosystem functioningandservices.Ecol.Lett.9,1146–1156.
Barau,A.,Ludin,A.N.M.,Said,I.,2013.Socio-ecologicalsystemsandbiodiversity conservationinAfricancity:insightsfromKanoEmir’spalacegardens.Urban Ecosyst.16,783–800.
Berman,M.G.,Jonides,J.,Kaplan,S.,2008.Thecognitivebenefitsofinteractingwith nature.Psychol.Sci.19,1207–1212.
Bonnes,M., Secchiaroli, G., 1995.Environmental Psychology:A Psycho-social Introduction.SagePublications,London.
Bowler,D.E.,Buyung-Ali,L.M.,Knight,T.M.,Pullin,A.S.,2010.Asystematicreviewof evidencefortheaddedbenefitstohealthofexposuretonaturalenvironments. BMCPublicHealth10,456.
Burnham,K.P.,Anderson,D.R.,2002.ModelSelectionandMultimodelInference:A PracticalInformation-theoreticApproach.Springer,NewYork.
Carpenter,S.R.,Mooney,H.A.,Agard,J.,Capistrano,D.,Defries,R.S.,Diaz,S.,Dietz,T., Duraiappah, A.K., Oteng-Yeboah, A., Pereira, H.M., Perrings, C., Reid, W.V., Sarukhan, J., Scholes,R.J.,Whyte,A.,2009.Scienceformanagingecosystemservices:beyondthe millenniumecosystemassessment.Proc. Natl.Acad.Sci.U.S.A.106,1305–1312.
Chan,K.M.A.,Shaw,M.R.,Cameron,D.R.,Underwood,E.C.,Daily,G.C.,2006. Con-servationplanningforecosystemservices.PLoSBiol.4,2138–2152.
Crawley,M.J.,2007.TheRbook.Wiley,Oxford.
Crossley,D.,Cass,J.,1989.WaterPowerontheSheffieldRivers.SheffieldTrades HistoricalAssociationandUniversityofSheffield,Sheffield.
Dallimer,M.,Davies,Z.,Irvine,K.,Maltby,L.,Warren,P.,Gaston,K.,Armsworth,P., 2014.Whatpersonalandenvironmentalfactorsdeterminefrequencyofurban greenspaceuse? Int.J.Environ.Res.PublicHealth11,7977–7992.
Dallimer,M.,Irvine,K.N.,Skinner,A.M.J.,Davies,Z.G.,Rouquette,J.R.,Maltby,L.L., Warren,P.H.,Armsworth,P.R.,Gaston,K.J.,2012a.Biodiversityandthe feel-goodfactor:understandingassociationsbetweenself-reportedhuman well-beingandspeciesrichness.Bioscience62,47–55.
Dallimer,M.,Marini,L.,Skinner,A.M.J.,Hanley,N.,Armsworth,P.R.,Gaston,K.J., 2010.Agriculturalland-useinthesurroundinglandscapeaffectsmoorlandbird diversity.Agric.Ecosyst.Environ.139,578–583.
Dallimer,M.,Rouquette,J.R.,Skinner,A.M.J.,Armsworth,P.R.,Maltby,L.M.,Warren, P.H.,Gaston, K.J.,2012b. Contrastingpatternsinspeciesrichnessofbirds, butterflies and plants along riparian corridors in an urban landscape. Divers.Distrib.18,742–753.
Dallimer,M.,Tang,Z.Y.,Bibby,P.R.,Brindley,P.,Gaston,K.J.,Davies,Z.G.,2011.Temporal changesingreenspaceinahighlyurbanizedregion.Biol.Lett.7,763–766.
Davies,Z.G.,Edmondson,J.L.,Heinemeyer,A.,Leake,J.R.,Gaston,K.J.,2011.Mapping anurbanecosystemservice:quantifyingabove-groundcarbonstorageata city-widescale.J. Appl.Ecol.48,1125–1134.
Dearing,J.A.,Yang,X.D.,Dong,X.H.,Zhang,E.L.,Chen,X.,Langdon,P.G.,Zhang,K., Zhang,W.G.,Dawson,T.P.,2012.Extendingthetimescaleandrangeof ecosys-temservicesthroughpaleoenvironmentalanalyses,exemplifiedinthelower Yangtzebasin.Proc.Natl.Acad.Sci.U.S.A.109,E1111–E1120.
diCastri,F.,Hadley,M.,Damlamian,J.,1981.MAB—TheManandBiosphereProgram asanevolvingsystem.Ambio10,52–57.
Dı´azPorras,D.F.,2013.HistoricalUrbanEcology,GreenSpaces,andBiodiversity. DepartmentofAnimalandPlantSciences,UniversityofSheffield,Sheffield.
EEA,2009.EnsuringQualityofLifeinEurope’sCitiesandTowns.European Envi-ronmentAgency,Copenhagen.
Eigenbrod,F.,Armsworth,P.R.,Anderson,B.J.,Heinemeyer,A.,Gillings,S.,Roy,D.B., Thomas, C.D., Gaston, K.J.,2010. Theimpact ofproxy-based methods on mappingthedistributionofecosystemservices.J.Appl.Ecol.47,377–385.
Eriksson,O.,1996.Regionaldynamicsofplants:areviewofevidenceforremnant, source-sinkandmetapopulations.Oikos77,248–258.
Firth,C.,1997.DomesdaytotheDawnoftheNewMillennium:900YearsoftheDon Fishery.EnvironmentAgency,Bristol.
Ford,H.A.,Walters,J.R.,Cooper,C.B.,Debus,S.J.S.,Doerr,V.A.J.,2009.Extinctiondebt orhabitatchange?—ongoinglossesofwoodlandbirdsinnorth-easternNew SouthWales,Australia. Biol.Conserv.142,3182–3190.
Foster,D.,Swanson,F.,Aber,J.,Burke,I.,Brokaw,N.,Tilman,D.,Knapp,A.,2003.The importanceofland-uselegaciestoecologyandconservation.Bioscience53,77–88.
Goddard,M.A.,Dougill,A.J.,Benton,T.G.,2010.Scalingupfromgardens: biodiver-sityconservationinurbanenvironments.TrendsEcol.Evol.25,90–98.
Gomez-Baggethun,E.,Barton,D.N.,2013.Classifyingandvaluingecosystem ser-vicesforurbanplanning.Ecol.Econ.86,235–245.
Gough,C.M.,Vogel,C.S.,Harrold,K.H.,George,K.,Curtis,P.S.,2007.Thelegacyof harvestandfireonecosystemcarbonstorageinanorthtemperateforest.Global ChangeBiol.13,1935–1949.
Griffiths,P.,1999.TheFiveWeirsWalk.HallamshirePublicationsLtd,Sheffield.
Gulwadi,G.B.,2006.Seekingrestorativeexperiences—elementaryschoolteachers’ choicesforplacesthatenablecopingwithstress.Environ.Behav.38,503–520.
Gu¨neralp,B.,McDonald,R.,Fragkias,M.,Goodness,J.,Marcotullio,P.,Seto,K.,2013.
Urbanizationforecasts,effectsonlanduse,biodiversity,andecosystem ser-vices.In:Elmqvist,T.,Fragkias,M.,Goodness,J.,Gu¨neralp,B.,Marcotullio,P.J., McDonald,R.I.,Parnell,S.,Schewenius,M.,Sendstad,M.,Seto,K.C.,Wilkinson,C. (Eds.), Urbanization, Biodiversityand Ecosystem Services:Challenges and Opportunities.Springer,Netherlands, pp.437–452.
Herzog,T.R.,Black,A.M.,Fountaine,K.A.,Knotts,D.J.,1997.Reflectionand atten-tionalrecoveryasdistinctivebenefitsofrestorativeenvironments.J. Environ. Psychol.17,165–170.
Hey,D.,2005.AHistoryofSheffield.CarnegiePublishingLtd,Lancaster.
Holland,R.A.,Eigenbrod,F.,Armsworth,P.R.,Anderson,B.J.,Thomas,C.D.,Gaston, K.J.,2011.Theinfluenceoftemporalvariationonrelationshipsbetween eco-systemservices.Biodivers.Conserv.20,3285–3294.
Hope,D.,Gries,C.,Zhu,W.X.,Fagan,W.F.,Redman,C.L.,Grimm,N.B.,Nelson,A.L., Martin,C.,Kinzig,A.,2003.Socioeconomicsdriveurbanplantdiversity.Proc. Natl.Acad.Sci.U.S.A.100,8788–8792.
Hull,R.B.,Lam,M.,Vigo,G.,1994.Placeidentity—symbolsofselfintheurbanfabric. Landsc.UrbanPlann.28,109–120.
Irvine,K.N.,Warber,S.L.,Devine-Wright,P.,Gaston,K.J.,2013.Understandingurban greenspaceasahealthresource:aqualitativecomparisonofvisitmotivation andderivedeffectsamongparkusersinSheffield,UK.Int.J.Environ.Res.Public Health10,417–442.
Ittelson,W.H., Rivlin,A., Winkel,G., 1974.AnIntroduction toEnvironmental Psychology.Holt,RinehartandWinston,NewYork.
Jenks,M.,Jones,C.,2010.DimensionsoftheSustainableCity.Springer,NewYork.
Jiang,M.,Bullock,J.M.,Hooftman,D.A.P.,2013.Mappingecosystemserviceand biodiversitychangesover70yearsinaruralEnglishcounty.J.Appl.Ecol.50, 841–850.
Kamp,J.,Urazaliev,R.,Donald,P.F.,Holzel,N.,2011.Post-Sovietagriculturalchange predictsfuturedeclinesafterrecentrecoveryinEurasiansteppebird popula-tions.Biol.Conserv.144,2607–2614.
Kaplan,R.,Kaplan,S.,1989.TheExperienceofNature:aPsychologicalPerspective. CambridgeUniversityPress,NewYork.
Kaplan,S.,1993.Theroleofnaturalenvironmentaestheticsintherestorative experience. In:Gobster,P.H.(Ed.), ManagingUrbanandHigh-useRecreation Settings,USDAForestService,St.Paul,MN,,pp.46–49,GeneralTechnical ReportNC-163.
Kaplan,S.,1995.Therestorativebenefitsofnature—towardanintegrative frame-work.J.Environ.Psychol.15,169–182.
Kareiva,P.,Tallis,H.,Ricketts,T.H.,Daily,G.C.,Polasky,S.,2011.NaturalCapital:Theory andPracticeofMappingEcosystemServices.OxfordUniversityPress,Oxford.
Kendall,K.,2005.WalkingtheRivelin.RivelinValleyConservationGroup,Sheffield.
Keniger,L.E.,Gaston,K.J.,Irvine,K.N.,Fuller,R.A.,2013.WhataretheBenefitsof InteractingwithNature? Int.J.Environ.Res.PublicHealth10,913–935.
Kuo,F.E.,Sullivan,W.C.,2001.Environmentandcrimeintheinnercity-Does vegetationreducecrime? Environ.Behav.33,343–367.
Kuussaari,M.,Bommarco,R.,Heikkinen,R.K.,Helm,A.,Krauss,J.,Lindborg,R., Ockinger,E.,Partel,M.,Pino,J.,Roda,F.,Stefanescu,C.,Teder,T.,Zobel,M., Steffan-Dewenter,I.,2009.Extinctiondebt:achallengeforbiodiversity conser-vation.TrendsEcol.Evol.24,564–571.
Lautenbach,S.,Kugel,C.,Lausch,A.,Seppelt,R.,2011.Analysisofhistoricchangesin regionalecosystemserviceprovisioningusinglandusedata.Ecol.Indic.11,676–687.
Liu,J.,Daily,G.C.,Ehrlicht,P.R.,Luck,G.W.,2003.Effectsofhouseholddynamicson resourceconsumptionandbiodiversity.Nature421,530–533.
Luck,G.W.,Smallbone,L.T.,O’Brien,R.,2009.Socio-economicsandvegetationchange inurbanecosystems:patternsinspaceandtime.Ecosystems12,604–620.
Mace,G.M.,Norris,K.,Fitter,A.H.,2012.Biodiversityandecosystemservices:a multilayeredrelationship.TrendsEcol.Evol.27,19–26.
Manes,F.,Incerti,G.,Salvatori,E.,Vitale,M.,Ricotta,C.,Costanza,R.,2012.Urban ecosystemservices:treediversityandstabilityoftroposphericozoneremoval. Ecol.Appl.22,349–360.
Manzo,L.C.,2003.Beyondhouseandhaven:towardarevisioningofemotional relationshipswithplaces.J.Environ.Psychol.23,47–61.
Manzo,L.C.,2005.Forbetterorworse:exploringmultipledimensionsofplace meaning.J.Environ.Psychol.25,67–86.
McDonald,R.I.,Forman,R.T.T.,Kareiva,P.,2010.Openspacelossandlandinequality inUnitedStates’’cities,1990–2000.PLoSONE5.
MEA,2005. EcosystemsandHumanWell-being:BiodiversitySynthesis.World ResourcesInstitute,Washington,DC.
Meine,C.,1999.It’sabouttime:conservationbiologyandhistory.Conserv.Biol.13,1–3.
Mitchell,R.,Popham,F.,2007.Greenspace,urbanityandhealth:relationshipsin England.J.Epidemiol.CommunityHealth61,681–683.
Myint,S.W.,Wentz,E.A.,Brazel,A.J.,Quattrochi,D.A.,2013.Theimpactofdistinct anthropogenicandvegetationfeaturesonurbanwarming.Landsc.Ecol.28, 959–978.
Naidoo,R.,Balmford,A.,Costanza,R.,Fisher,B.,Green,R.E.,Lehner,B.,Malcolm,T.R., Ricketts,T.H.,2008.Globalmappingofecosystemservicesandconservation priorities.Proc.Natl.Acad.Sci.U.S.A.105,9495–9500.
Nassauer,J.I.,1997.Culturalsustainability:aligningaestheticsandecology.In: Nassauer,J.I.(Ed.),PlacingNature:CultureandLandscapeEcology.IslandPress, Washington,DC, pp.65–83.
Nelson,E.,Mendoza,G.,Regetz,J.,Polasky,S.,Tallis,H.,Cameron,D.R.,Chan,K.M.A.,Daily, G.C.,Goldstein,J.,Kareiva,P.M.,Lonsdorf,E.,Naidoo,R.,Ricketts,T.H.,Shaw,M.R., 2009.Modelingmultipleecosystemservices,biodiversityconservation,commodity production,andtradeoffsatlandscapescales.Front. Ecol.Environ.7,4–11.
Newell,B.,Crumley,C.L.,Hassan,N.,Lambin,E.F.,Pahl-Wostl,C.,Underdal,A., Wasson,R.,2005.Aconceptualtemplateforintegrativehuman-environment research.Glob.Environ.Change-Hum.PolicyDimens.15,299–307.
Nicholson,E.,Mace,G.M.,Armsworth,P.R.,Atkinson,G.,Buckle,S.,Clements,T.,Ewers, R.M.,Fa,J.E.,Gardner,T.A.,Gibbons,J.,Grenyer,R.,Metcalfe,R.,Mourato,S.,Muuls, M.,Osborn,D.,Reuman,D.C.,Watson,C.,Milner-Gulland,E.J.,2009.Priorityresearch areasforecosystemservicesinachangingworld.J.Appl.Ecol.46,1139–1144.
Nowak,D.J.,Greenfield,E.J.,2012.TreeandimperviouscoverchangeinUScities. UrbanForest.UrbanGreen.11,21–30.
O’Brien,L.,2004.ASortofMagicalPlace:People’sExperiencesofWoodlandsin NorthwestandSoutheastEngland.ForestResearch,Edinburgh.
ODPM,2003.LivingPlaces:Cleaner,Safer,Greener.StationeryOffice,London.
ONS,2012a.2011Census—PopulationandHouseholdEstimatesforEnglandand Wales,March2011.OfficeforNationalStatistics,London.
ONS,2012b.FamiliesandHouseholds2001to2011.OfficeforNationalStatistics, London.
Park,M.,Hagishima,A.,Tanimoto,J.,Narita,K.,2012.Effectofurbanvegetationon outdoor thermal environment: field measurement at a scale model site. Build.Environ.56,38–46.
Pa¨rtel,M.,Mandla,R.,Zobel,M.,1999.Landscapehistoryofacalcareous(alvar) grasslandinHanila,westernEstonia,duringthelastthreehundredyears. Landsc.Ecol.14,187–196.
Pickett,S.T.A.,Cadenasso,M.L.,Grove,J.M.,Groffman,P.M.,Band,L.E.,Boone,C.G., Burch,W.R., Grimmond,C.S.B.,Hom,J.,Jenkins,J.C.,Law,N.L.,Nilon,C.H., Pouyat, R.V.,Szlavecz,K.,Warren, P.S.,Wilson,M.A.,2008. Beyond urban legends: an emerging frameworkof urban ecology, as illustrated by the BaltimoreEcosystemStudy.Bioscience58,139–150.
Proshansky,H.M.,Fabian,A.K.,Kaminoff,R.,1983.Place-identity:physicalworld socializationoftheself.J.Environ.Psychol.3,57–83.
Pugh,T.A.M.,MacKenzie,A.R.,Whyatt,J.D.,Hewitt,C.N.,2012.Effectivenessofgreen infrastructureforimprovementofairqualityinurbanstreetcanyons.Environ. Sci.Technol.46,7692–7699.
Raudsepp-Hearne, C., Peterson, G.D., Bennett, E.M., 2010a.Ecosystem service bundlesforanalyzingtradeoffsindiverselandscapes.Proc.Natl.Acad.Sci. U.S.A.107,5242–5247.
Raudsepp-Hearne,C.,Peterson,G.D.,Tengo,M.,Bennett,E.M.,Holland,T., Bene-ssaiah,K.,MacDonald,G.K.,Pfeifer,L.,2010b.Untanglingtheenvironmentalist’s paradox:whyishumanwell-beingincreasingasecosystemservicesdegrade? Bioscience60,576–589.
Rouquette,J.R.,Dallimer,M.,Armsworth,P.R.,Gaston,K.J.,Maltby,L.,Warren,P.H., 2013.Speciesturnoverandgeographicdistanceinanurbanrivernetwork. Divers.Distrib.19,1429–1439.
Scannell,L.,Gifford,R.,2010.Definingplaceattachment:atripartiteorganizing framework.J.Environ.Psychol.30,1–10.
Seppelt,R.,Dormann,C.F.,Eppink,F.V.,Lautenbach,S.,Schmidt,S.,2011.A quanti-tativereviewofecosystemservicestudies:approaches,shortcomingsandthe roadahead.J.Appl.Ecol.48,630–636.
Seto,K.C.,Gu¨neralp,B.,Hutyra,L.R.,2012.Globalforecastsofurbanexpansionto 2030anddirectimpactsonbiodiversityandcarbonpools.Proc.Natl.Acad.Sci. U.S.A.109,16083–16088.
Staats,H.,Kieviet,A.,Hartig,T.,2003.Wheretorecoverfromattentionalfatigue:an expectancy-valueanalysisofenvironmentalpreference.J.Environ.Psychol.23, 147–157.
Stedman,R.C.,2003.Isitreallyjustasocialconstruction?Thecontributionofthe physicalenvironmenttosenseofplace. Soc.Nat.Resour.16,671–685.
Sullivan,W.C.,Kuo,F.E.,DePooter,S.F.,2004.Thefruitofurbannature-Vital neighborhoodspaces.Environ.Behav.36,678–700.
Susca,T.,Gaffin,S.R.,Dell’Osso,G.R.,2011.Positiveeffectsofvegetation:urbanheat islandandgreenroofs.Environ.Pollut.159,2119–2126.
Szabo,P.,2010.Whyhistorymattersinecology:aninterdisciplinaryperspective. Environ.Conserv.37,380–387.
Szabo,P.,Hedl,R.,2011.Advancingtheintegrationofhistoryandecologyfor conservation.Conserv.Biol.25,680–687.
Talbot,J.F.,Kaplan,R.,1984.Needsandfears:theresponsetotreesandnatureinthe innercity.J.Arboricult.10,222–228.
Thomas,L.,Buckland,S.T.,Rexstad,E.A.,Laake,J.L.,Strindberg,S.,Hedley, S.L., Bishop,J.R.B.,Marques,T.A.,Burnham,K.P.,2010.Distancesoftware:design andanalysisofdistancesamplingsurveysforestimatingpopulationsize.J. Appl.Ecol.47,5–14.
Tianhong,L.,Wenkai,L.,Zhenghan,Q.,2010.Variationsinecosystemservicevalue inresponsetolandusechangesinShenzhen.Ecol.Econ.69,1427–1435.
Tilman,D.,May,R.M.,Lehman,C.L.,Nowak,M.A.,1994.Habitatdestructionandthe extinctiondebt.Nature371,65–66.
Timothy,D.J.,Nyaupane,G.P.,2009.CulturalHeritageandTourisminthe Develop-ingWorld:ARegionalPerspective.Routledge.
Troy,A.R.,Grove,J.M.,O’Neil-Dunne,J.P.M.,Pickett,S.T.A.,Cadenasso,M.L.,2007.
Predictingopportunitiesforgreeningandpatternsofvegetationonprivate urbanlands.Environ.Manage.40,394–412.
Tzoulas,K.,Korpela,K.,Venn,S.,Yli-Pelkonen,V.,Kazmierczak,A.,Niemela,J.,James, P.,2007.PromotingecosystemandhumanhealthinurbanareasusingGreen Infrastructure:aliteraturereview.Landsc.UrbanPlann.81,167–178.
UKNEA,2011.TheUKNationalEcosystemAssessment:TechnicalReport. UNEP-WCMC,Cambridge.
UnitedNations,2013.WorldUrbanizationProspects,the2012Revision.UnitedNations, DepartmentofEconomicandSocialAffairs,PopulationDivision,NewYork.
Ward-Thompson,C.,Roe,J.,Aspinall,P.,Mitchell,R.,Clow,A.,Miller,D.,2012.More greenspaceislinkedtolessstressindeprivedcommunities:Evidencefrom salivarycortisolpatterns.Landsc.UrbanPlan.105,221–229.
Watson,S.J., Luck,G.W., Spooner,P.G.,Watson,D.M., 2014. Land-usechange: incorporatingthefrequency,sequence,timespan,andmagnitudeofchanges intoecologicalresearch.Front.Ecol.Environ.12,241–249.