White Rose Research Online
Universities of Leeds, Sheffield and York
http://eprints.whiterose.ac.uk/
This is a copy of the final published version of a paper published via gold open access
in
PLoS One
.
This open access article is distributed under the terms of the Creative Commons
Attribution Licence (http://creativecommons.org/licenses/by/4.0/) which permits
unrestricted use, distribution, and reproduction in any medium, provided the
original work is properly cited.
White Rose Research Online URL for this paper:
http://eprints.whiterose.ac.uk/85373
Published paper
The Role of
HOXB9
and
miR-196a
in Head
and Neck Squamous Cell Carcinoma
Lav Darda1, Fahad Hakami1, Richard Morgan2, Craig Murdoch3, Daniel W. Lambert1, Keith D. Hunter1,4*
1Unit of Oral and Maxillofacial Pathology, School of Clinical Dentistry, University of Sheffield, Sheffield, United Kingdom,2Institute of Cancer Therapeutics, University of Bradford, Bradford, United Kingdom,
3Unit of Oral and Maxillofacial Medicine & Surgery, School of Clinical Dentistry, University of Sheffield, Sheffield, United Kingdom,4Department of Oral Pathology and Biology, University of Pretoria, Pretoria, South Africa
Abstract
Background
Previous studies have demonstrated that a number ofHOXgenes, a family of transcription factors with key roles in early development, are up-regulated in head and neck squamous cell carcinoma (HNSCC) and other cancers. The loci of several Homeobox (HOX) genes also contain microRNAs (miRs), including miR-196a.
Methods
Global miR expression and expression of all 39HOXgenes in normal oral keratinocytes (NOKs), oral pre-malignant (OPM) and HNSCC cells was assessed by expression microarray and qPCR and in tissues by immunohistochemistry (IHC) and qPCR of laser microdissected (LCM) tissues. Expression of miR196a andHOXB9was reduced using anti-miR-196a and siRNA, respectively. Expression microarray profiles of anti-miR196a and pre-miR196a transfected cells were compared to parental cells in order to identify novel targets of miR-196a. Putative miR196a targets were validated by qPCR and were confirmed as binding to the 3’UTR of miR196a by a dual luciferase reporter assay combined with mutational analy-sis of the miR-196a binding site.
Results
miR-196a andHOXB9are highly expressed in HNSCC compared to NOKs, a pattern also seen in HNSCC tissues by HOXB9 IHC and qPCR of miR-196a in LCM tissue. Knock-down of miR-196a expression decreased HNSCC cell migration, invasion and adhesion to fibro-nectin, but had no effect on proliferation. Furthermore, knock-down ofHOXB9expression decreased migration, invasion and proliferation but did not alter adhesion. We identified a novel primary mRNA transcript containingHOXB9andmiR196a-1as predicted from
in-sil-icoanalysis. Expression array analysis identified a number of miR196a targets, including
OPEN ACCESS
Citation:Darda L, Hakami F, Morgan R, Murdoch C, Lambert DW, Hunter KD (2015) The Role ofHOXB9 andmiR-196ain Head and Neck Squamous Cell Carcinoma. PLoS ONE 10(4): e0122285. doi:10.1371/journal.pone.0122285
Academic Editor:Andrew Yeudall, Virginia Commonwealth University, UNITED STATES
Received:November 6, 2014
Accepted:February 10, 2015
Published:April 10, 2015
Copyright:© 2015 Darda et al. This is an open access article distributed under the terms of the
Creative Commons Attribution License, which permits unrestricted use, distribution, and reproduction in any medium, provided the original author and source are credited.
Data Availability Statement:The microarray data described in this paper is held in public repositories: NCBI GEO database (accession numbers GSE52811 and GSE52810).
Funding:The authors received no specific funding for this work.
MAMDC2andHOXC8. We confirmed thatMAMDC2is a novel miR-196a target using a dual luciferase reporter assay with the effect abolished on mutation of the binding site.
Conclusions
These results show thatmiR-196aandHOXB9are overexpressed, perhaps co-ordinately, as HNSCC develops and exert a pro-tumourigenic phenotype in HNSCC and OPM cells.
Introduction
The identification of a number of key molecular alterations in cancer has resulted in major ad-vances in diagnosis and targeted therapy with validated biomarkers, heralding the advent of personalised medicine. However, head and neck squamous cell carcinoma (HNSCC) lags be-hind, with no consistent oncogenic drivers identified and cetuximab being the only approved targeted therapeutic. This reflects both the molecular heterogeneity of this cancer and the pau-city of understanding of its molecular landscape [1]. Worldwide, HNSCC presents a significant public health problem, being the 6thmost common cancer with survival rates which have not improved significantly for several decades [2]. Hence, there is a pressing need to find both novel targets for therapeutic intervention and new biomarkers in HNSCC.
Data mining of our published gene expression profile of normal, premalignant and HNSCC cells (http://bioinformatics.picr.man.ac.uk/vice/PublicProjects.vice?pager.offset=15) to identify deregulated pathways [3] has identified a number of consistently up-regulated transcription factors in HNSCC, including several Homeobox(HOX)genes (see Hunter et al, Supplementary data S3 and S4).HOXgenes code for transcription factors with important roles in embryogene-sis and organogeneembryogene-sis [4,5]. There are 39HOXgenes present on chromosomes 2, 7, 12 and 17, split into four clusters (A-D), and further sub-divided into 13 paralogous groups [4,6].HOX proteins contain a 60 amino acid homeodomain that facilitates their binding to DNA [7].HOX gene products interact with co-factors such asPBX, a member of theTALEfamily of homeodo-main proteins, which alters their binding with DNA, regulates transcription and is needed for specificHOXfunctions [8].
HOXgene expression is dysregulated in many cancers, most significantly in leukaemia. In acute myeloid leukaemia (AML), fusion proteins ofNUP98:HOXC11andNUP98:HOXD13 have been identified which result in aberrant HOX trans-regulatory activity [9,10]. In breast cancer,HOXA5andHOXB13expression is down-regulated [11,12] whereasHOXB9is highly up-regulated [13] and changes inHOXgene expression have been reported in lung [14,15] and gastric cancer [16]. In HNSCC, severalHOXgenes show higher levels of expression in pre-ma-lignant and cancer tissues compared to normal tissues [17]. Overall, 18HOXgenes were more highly expressed in HNSCC cells than in normal cells, among themHOXB9. However there is a lack of clarity in the literature as to the extent and relative importance ofHOXgenes in HNSCC carcinogenesis.
includingHOXA5,HOXB7,HOXB8andHOXC8[18,19,24,25] and has also been shown to di-rectly target several other genes such asANXA1,p27,KRT5,S100A9andSPRR2C[20,26,27]. Expression of miR-196a is up-regulated in breast, gastric, lung and oesophageal cancers [16,20,25,28], whereas it is down-regulated in melanoma [29]. miR-196a has been shown to be up-regulated in HNSCC and may also be detected in the serum of these patients pre-operative-ly [22,30]. In a recent meta-anapre-operative-lysis of miR profiling in HNSCC tissues, miR196a was identi-fied, but only in a minority of the studies assessed. Severinoet alhave shown that transfection of miR196a into normal oral keratinocytes decreases proliferation, but with no effect on the ex-pression of previously described miR196a targets [30]. Thus, the functional consequences of miR-196a alteration in HNSCC and the protein-coding targets mediating any phenotypic changes remain to be fully determined.
In this study, we show that miR-196a andHOXB9are the most markedly differentially ex-pressed miR andHOXgene respectively when comparing HNSCC and NOKs. This up-regula-tion was also seen in head and neck cancer tissue compared to normal tissue and
bioinformatics analysis suggests that these may be co-expressed (Ensembl Transcript: RP11-357H14.19–001). Thus, we aimed to evaluate the functional effects of high miR196a and HOXB9 expression in HNSCC and to identify novel and direct targets of miR-196a in this malignancy.
Materials and Methods
Cell culture and tissue samples
B16, B22, B56 (BICR56), T4 (HNSCC cell lines, Beatson Institute for Cancer Research [31,32]), H357 (HNSCC cell line from Prof S Prime [33]), D19, D20, D4, D35 (oral pre-malignant (OPM) cell lines, Beatson Institute for Cancer Research[34,35]), primary normal oral keratino-cytes (NOKs; isolated as previously described [36], grown with irradiated 3T3 cells), and OKF4 (immortalized normal oral keratinocytes; iNOK; from J Rheinwald, Boston, USA[37]) were maintained in keratinocyte growth medium (KGM) consisting of DMEM supplemented with 23% Ham’s F-12, 10% FCS, L-glutamine (2mM), adenine (0.18mM), hydrocortisone (0.5μg/ml) and insulin (5μg/ml) (all Sigma Aldrich, Poole, UK). CAL27 (HNSCC cell line, ATCC) was maintained in High glucose containing DMEM supplemented with 10% FCS and L-glutamine (2mM). All cell lines were incubated at 37°C and 5% CO2. None of the cell lines
used had a published STR profile, thus we conducted baseline STR profiling to assure no simi-larity with any other cell line with a known profile. This was conducted immediately prior to the experiments described below. Further information of the cells lines used in this study can be found inS1 Table.
A tissue microarray consisting of 25 oral cavity HNSCCs was available for HOXB9 immu-nohistochemistry. The clinicopathological details of this cohort are presented inS2 Table. Three cores from the body of the tumour and 3 cores from the advancing edge were available for each sample. A cohort of normal oral mucosal biopsies was used for comparison, with a site distribution matching the HNSCC cohort. A further cohort of 16 HNSCC (S3 Table) with site matched normal oral mucosa (from different patients) was used for the assessment of miR196a expression in tissues.
RNA isolation and quantitative RT-PCR
miRNA-specific primers. For total cDNA synthesis, 200ng RNA was reverse transcribed using random primers. Quantitative gene expression analysis was performed using SYBR1green or Taqman with appropriate controls (U6 for SYBR and RNU48 (Taqman ID: 001006) for Taqman analy-sis; hsa-miR-196a (Taqman ID: 241070)). Initial screening for all HOX genes was by SYBR green qPCR on a Stratagene platform MX3005p (primers sequences inS4 Table) [14]. Addi-tional qPCR was performed using an ABI 7900HT (Life Technologies, Paisley, UK) and the rel-ative expression of genes, normalised to the abundance of the relevant control transcript, was calculated using RQ Manager 1.2.1 (Life Technologies, Paisley, UK).
Affymetrix miRNA array
RNA from duplicate cultures of NOK (normal OKs), Cal27 and BICR56 (both HNSCC) ex-tracted using the mirVana miRNA isolation kit (Life Technologies, Paisley, UK) and was then prepared as per the manufacturer’s protocols (http://media.affymetrix.com/support/
downloads/manuals/ flashtag_user_guide.pdf) prior to hybridisation onto the Affymetrix Gen-eChip miRNA 1.0 Array. The array data was normalised using RMA (RMAEXpress) and then loaded into tMeV (Craig Venter Institute, Rockville, CA) and analysed using the statistical analysis of microarray tool (SAM) with a false discovery rate<1% and fold change of>5, com-paring NOK with HNSCC. The primary data is available in the NCBI GEO database (accession number GSE52811).
HOXB9
-miR-196a-1 primary transcript
To investigate the presence of a commonHOXB9-miR-196a-1 primary transcript (PT), prim-ers were designed that spanned the 6.3Kb betweenHOXB9exon1 and miR-196a-1 precursor transcript (forward: 5’AATTAGGTAGTTTCATGTTGTTGGGCC 3’; reverse: 5’ATAA TAGCTGCTAAGCGTCCC AGAAAT 3’). For the reverse transcription step, primary tran-script primers were used with M-MLV reverse trantran-scriptase (Promega, Southampton, UK), fol-lowed by PCR using the same primers (product 6.3kB). Nested primers were designed to give a 295bp product within this transcript (forward: 5’AAAGTCAGGGCAGGAGAGGGAAGGG GAA 3’, reverse: 5’CAATTTGCCAGCCCTATGAAGTCTGCT 3’), with RNaseA treated (RNA was incubated for 1 hour at 37°C with 100μg/ml RNaseA (Promega, Southampton, UK) and no-reverse transcriptase (RT) controls. The PCR products were separated on a 2% (w/v) agarose gel, visualised under UV transillumination and purified using gel extraction kit (Bio-line, London, UK). This product was then cloned into TOPO TA Cloning vector (Life Technol-ogies, Paisley, UK) and positive colonies were selected using blue/white screening, purified using Isolate plasmid mini kit (Bioline, London, UK) and sequenced.
Laser Capture Microdissection (LCM)
Fresh 4μM sections of formalin-fixed, paraffin-embedded (FFPE) tumour and normal tissue (as described above) were de-waxed, stained with haematoxylin and dehydrated by xylene. LCM was carried out using a Pixcell II LCM system (Arcturus, Life Technologies, Paisley, UK). RNAqueous1Micro kit (Life Technologies, Paisley, UK) was used to extract RNA from the cells, according to the manufacturer’s instructions.
Protein extraction and western blotting
manufacturer’s protocol (Thermo Scientific, Hemel Hempstead, UK). 40μg of total protein was loaded onto a 12% (v/v) SDS-PAGE gel. Wet transfer for 1h at 30V transferred protein to a nitrocellulose membrane, before incubation for 1h in blocking buffer (5% (w/v) dried milk with 3% (w/v) BSA in tris buffered saline containing 0.05% (v/v) tween-20) and incubation overnight at 4°C with the primary monoclonal antibody anti-HOXB9 (1:500 in blocking buffer, Abcam, Cambridge, UK) or anti-β-actin (1:3,000 in blocking buffer, Sigma Aldrich, Poole, UK). The membrane was then incubated in horseradish peroxidase-conjugated anti-rabbit IgG (1:3000 in blocking buffer) for 1h and developed with SuperSignal West Pico chemilumines-cent substrate (Thermo Scientific, Hemel Hempstead, UK).
Immunohistochemistry (IHC)
Antigen retrieval was performed using a pressure cooker [39] on sections followed by incuba-tion with anti-HOXB9(1: 400, Sigma Aldrich, Poole, UK) overnight at 4°C. Vectastain Elite ABC rabbit IgG kit (Vector Laboratories Inc. Burlingame, CA, USA) was used for secondary antibody (30min at room temperature), followed by colour development by DAB reagent (Vec-tor Labora(Vec-tories Inc. Burlingame, CA, USA). Submandibular salivary gland and sections with no primary antibody were used as positive and negative controls respectively. IHC was ana-lysed by the semi-quantitative modified Quickscore method on 6 cores from each tumour [40].
Anti-miR and siRNA transfection
B16, D19 or OKF4 cells were seeded in a 6-well plate and incubated overnight. Keratinocytes were transfected when 50–70% confluent with anti-miR-196a or pre-miR-196a (50nM, Life Technologies, Paisley, UK) or siRNA targeting humanHOXB9(50nM, Sigma Aldrich, Poole, UK) using Oligofectamine (Life Technologies, Paisley, UK) according to the manufacturer’s protocol. A random, non-targeting negative control sequence (Life Technologies, Paisley, UK) was used in all experiments. Cells were transfected and incubated for 48h in DMEM supple-mented with 20% FCS before being used for the functional assays.
Proliferation Assay
Cells were seeded in a 96-well plate (Corning Inc, Corning, NY, USA) in triplicate for each time point (0, 24, 48, 72 and 96h) at a density of 5x10³cells in DMEM media supplemented with 10% (v/v) FCS. MTS reagent (Promega, Southampton, UK) was added to the wells, incu-bated for 1h and then read at 490nm on a Tecan Infinite M200 spectrophotometer (Tecan, Männedorf, Switzerland) using Magellan software.
Adhesion Assay
A 96-well plate was coated with 0.1% (w/v) fibronectin (Sigma Aldrich, Poole, UK) in PBS (1:100) and incubated overnight at 4°C. The following day wells were washed with PBS and incubated with DMEM containing 1% (w/v) BSA for an hour. The transfected cells were plated in triplicate at a density of 3x10⁴cells/well in DMEM and incubated for 1h. Non-adher-ent cells were removed by washing with PBS. MTS reagNon-adher-ent (Promega, Southampton, UK) was added to the wells, incubated for 1h and then read at 490nm on a Tecan Infinite M200 spectrophotometer.
Transwell Migration and Invasion Assay
Oxford, UK). The bottom of the 24-well plate was filled with DMEM supplemented with 2% (v/v) FCS and the cells incubated overnight at 37°C. For invasion assays the top chamber of a transwell insert was covered with 100μL of growth factor reduced matrigel (BD Biosciences, Oxford, UK) and incubated overnight at 37°C. 8x10⁴transfected cells in 0.1% (w/v) BSA in DMEM were placed in the top chamber in duplicate. DMEM containing 2% (v/v) FCS was placed in the bottom of the 24-well plate followed by 48h incubation at 37°C. Mitomycin C (1μg/mL) was added to the medium in both chambers. For both assays the migrating or invad-ing cells present on the underside of the transwell insert were stained with crystal violet and then counted at four random fields by light microscopy.
Agilent Gene expression microarray
The quality of total RNA was assessed using an Agilent Bioanalyzer, (Agilent, Wokingham, UK) with QC thresholds 28s:18s2:1 and RIN = 10. Biological triplicates of B16 and D19 cells were transfected with anti-miR-196a and negative control, whereas OKF4 cells were trans-fected with pre-miR-196a and negative control in duplicate (total 16 samples). Samples were prepared and hybridised to Agilent oligonucleotide microarray chips (Sureprint G3; Agilent, Wokingham, UK) according to the manufacturer’s protocol (http://www.chem.agilent.com/ library/usermanuals/public/g4140-90041_one-color_tecan.pdf). Data was loaded into Qlucore Omics Explorer (Qlucore AB, Lund, Sweden) and, following normalisation and principle com-ponent analysis, T-test (p<0.01, with multiple test correction) was used to compare the trans-fected with the parental cells for each cell line. The top 50 up- and down-regulated genes were selected for further validation by qPCR. The primary data is available in the NCBI GEO data-base (accession number GSE52810).
Luciferase reporter assay and site directed mutagenesis
TheMAMDC23’UTR was amplified using cDNA from B16 cells (primers: wt forward 5’AAA AAAAAA CGCGTAAATGATCTGCATTGGATTTACT 3’and wt reverse 5’AAAAAAAA GTTTAAACAAGATTTT CAAATTATTTTTATTAGGTAATTTTATAATTTC 3’containing MluI and PmeI restriction sites, respectively). The amplified PCR product was ligated into pMIR-REPORT (Ambion). The miR-196a binding site within theMAMDC23’UTR was mu-tated using PCR-based site-directed mutagenesis. pMIR REPORT cloned with wt 3’UTR was used as the template in the PCR. The primers used for mutation of the miR-196a binding site had Tmof>= 78°C (MAMDC2mutant forward: 5’CCTTCTTTA TTCCCCCTTTGAGA
CGCTTTTGAAGTCACTATAGC 3’and MAMDC2 mutant reverse: 5’GCTCAT AGTGA TTCAAAAGCGTCTCAAAGGGGGAATAAAGAAGG 3’, mutated bases in bold). The PCR product was incubated for 1h with DpnI (New England Biolabs, Herts, UK) to degrade methylated template plasmid. 500 ng of pMIR vector (wt or mutant) was transfected into B16 HNSCC cells with 50 ng of pRL-TK Renilla luciferase vector (Promega, Southampton, UK) and pre-miR-196a or scrambled negative control (50nM) (Life Technologies, Paisley, UK) using Fugene HD transfection reagent (Promega, Southampton, UK). The cells were incubated for 48h and then the luciferase activity for firefly and renilla was measured using dual luciferase reporter assay (DLRA) (Promega, Southampton, UK) according to the manufacturer’s proto-col. The assay was repeated thrice in triplicate.
Statistical Analysis
Parametric student’s t-test was used to calculate all other significance values. Results were only considered significant if p<0.05.
Ethics Approval
Ethics approval for the use of biopsy tissues in this study was obtained from The West Glasgow LREC (ref: 08/S0709/70). Ethical approval for the normal oral keratinocyte primary cultures used was obtained from the National Research Ethics Service, UK: 09/H1308/66 and human tissue was used with written, informed consent. The Ethics Approval waived the need for spe-cific consent in both cases as the material to be used was anonymised and surplus to diagnostic requirements.
Results
miRNA microarray analysis reveals high miR-196a expression in
HNSCC-derived cell line
[image:8.612.211.537.395.639.2]MicroRNA profiling using the Affymetrix miRNA array identified a number of significantly differentially expressed miRs between the NOKs and HNSCC cells (Fig 1A). As the number of samples was small the stringency applied in analysis was high (FDR<1%), in order to robustly identify differentially expressed miRs for further analysis. The number of hits was further limit-ed to those that changlimit-ed5 fold, finally identifying miR-196a, miR-34a and miR-708, as being differentially expressed (Fig 1B). Of these, only miR-196a was highly expressed in HNSCC. Validation of miR-196a expression by qPCR in a full panel of NOK, OPM and HNSCC cells showed high expression in all HNSCC cells tested with variable expression in OPM cells, two
Fig 1. miR-196a is up-regulated in OPM and HNSCC-derived cell lines. 1A:Heat map showing
differentially expressed microRNAs in microarray data from Affymetrix miRNA array on comparison of HNSCC and NOK using SAM with a FDR of 1%. BICR56 and CAL27 are HNSCC cells and NOKs are normal oral keratinocytes. The values presented are the mean of 2 technical replicates.1B. Candidate miRs were selected as differentially expressed with a FDR of 1% and fold change5.1C. Expression of miR-196a in a panel of NOK, OPM and HNSCC cells.*p<0.05,**p<0.01.
of which had similar expression to that seen in the HNSCCs (Fig 1C). Expression in NOKs was consistently low.
HOXB9
is the most highly expressed of a number of HOX genes
elevated in HNSCC-derived cell lines
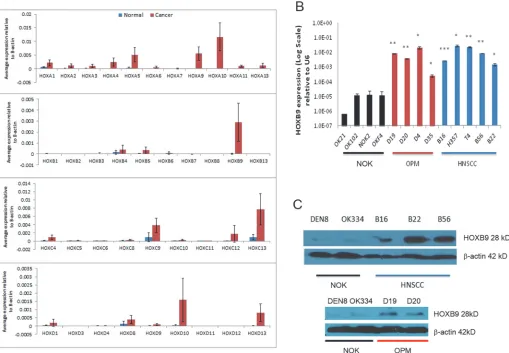
Expression analysis of all 39HOXgenes revealed that all were more highly expressed in HNSCC compared to NOK (Fig 2AandS2 Fig). The highest differential expression seen was of HOXA4(291 fold, p<0.01),HOXA5(105 fold, p<0.01),HOXA9(155 fold, p<0.001),HOXB9 (1293 fold, p<0.001),HOXC9(41 fold, p<0.01)and HOXD10(23 fold, p<0.01), all of which are well recognised in the literature [7,17,41,42], but there was marked variability in the extent of the fold change.HOXB9was the most markedly differentially expressed, on average> 1000-fold higher than in NOK. This was validated by qPCR, which demonstrated consistently high gene expression ofHOXB9in OPM and HNSCC cells (Fig 2B). Despite a lack of direct correspondence in HOXB9 protein levels (particularly for B16), the difference in expression
Fig 2.HOXB9is over-expressed in OPM and HNSCC-derived cell lines. 2A.Overall mean expression of all 39HOXgenes as measured by qPCR in a
panel of normal oral keratinocytes and oral cancer cells, relative to the internal endogenous controlβ-actin. In general, there is increased expression of most
HOXgenes, but particularlyA4,A10,B9andD10.2B.Expression ofHOXB9in a panel of NOK, OPM and HNSCC cells.2C.Expression ofHOXB9protein assayed by Western blotting for NOK cells compared to HNSCC (upper panel) and OPL (lower panel).*p<0.05,**p<0.01,***p<0.001.
[image:9.612.37.546.301.654.2]was also seen in Western blot, with the HNSCCs and OPMs expressing more HOXB9 protein than NOK, (Fig 2C).
miR-196a and HOXB9 are more highly expressed in HNSCC tissues
than in normal oral mucosa
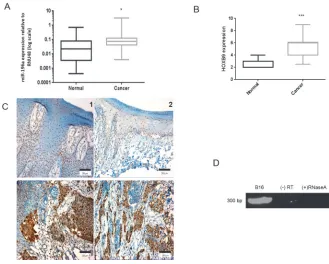
[image:10.612.198.527.328.592.2]The expression of miR-196a in tissues was assessed by qPCR of RNA extracted from laser-cap-tured FFPE tissue. Whilst RNA from FFPE tissues is often degraded, the small size of micro-RNAs allows efficient recovery from fixed tissue [43]. Significantly higher expression of miR-196a was observed in 16 HNSCC tissues when compared to 16 unmatched normal mucosa (Fig 3A, p<0.05), with some variation in expression seen in the normal samples. Analysis of HOXB9 expression by immunohistochemistry in a TMA containing 25 HNSCC samples com-pared with 10 normal oral mucosa samples revealed that this protein was more highly express-ed in HNSCC comparexpress-ed to normal samples, as assessexpress-ed by the Quickscore method (Fig 3B and 3C, p<0.001). In normal tissues, expression ofHOXB9was expressed at low levels, confined to the nuclei of the basal and spinous layers (Fig 3CPanel 1 and 2), whilst in HNSCC the nuclear intensity increased, with a greater proportion of cells in tumour nests expressingHOXB9
Fig 3. miR-196a andHOXB9are up-regulated in HNSCC tissue samples. 3A-C. Expression of miR-196a
(3A) andHOXB9in tissues (3B, 3C) measured by qPCR of LCM tissues and immunohistochemistry, respectively. Representative photomicrographs show HOXB9 expression in normal tissue (C panels 1 and 2) and HNSCC (C panels 3 and 4). TheHOXB9expression in tissue was semi-quantitatively assessed using the Quickscore method. The pattern of expression correlates within-vitrodata and both are
up-regulated in cancer tissue, albeit the fold change is less (3.4 fold for miR-196a).*p<0.05,***p<0.001. Photomicrographs overall magnification x200, scale bar = 200μm.3D.miR-196a-1 andHOXB9are co-expressed on same novel primary transcript DNA agarose gel electrophoresis showing presence of 295 bp transcript after nested PCR. The transcript is present in B16 cell line and at the expected size. (-) RT: without reverse transcriptase control, (+) RNaseA: RNA treated with RNaseA at 37°C for 1 hour before cDNA production.
(Fig 3CPanel 3 and 4). Furthermore, in the HNSCC tissues, there was cytoplasmic expression ofHOXB9in many cells.
HOXB9
and miR-196a-1 are co-transcribed on the same novel primary
transcript
HOXB9and miR-196a-1 are spatially closely related on Chr17. To show thatHOXB9and miR-196a-1 are co-transcribed on same primary transcript, primers were designed which spanned betweenHOXB9exon 1 to miR-196a-1 precursor transcript (6.3 Kb). Nested primers were de-signed which amplified a 295bp region within this 6.3 Kb transcript (S1 Fig). A product of the expected molecular size was obtained (Fig 3D); no products were observed in the absence of re-verse transcriptase (-RT) or following prolonged incubation with RNase A, suggesting this product is derived from aHOXB9-miR-196a-1 polycistronic primary transcript, rather than from genomic DNA contamination.
[image:11.612.198.464.382.648.2]HOXB9
and miR-196a increase HNSCC cell migration and invasion
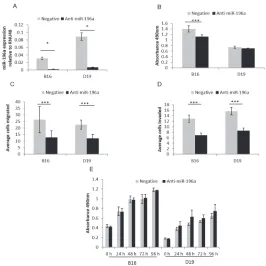
Given that bothHOXB9and miR-196a are highly expressed in HNSCC we assessed the pheno-typic consequences of this in OPM and HNSCC cells, particularly assessing features that pro-mote the ability of the cells to proliferate and to spread, enhancing the development of the tumour. Reducing expression of miR-196a orHOXB9by anti-miR-196a (95% (B16) and 92% (D19)) and HOXB9 siRNA (62% (B16) and 48% (D19)), respectively (Figs4Aand5A), re-duced the ability of the OPM and HNSCC cells to migrate and invade into Matrigel (Figs4C, 4D,5Cand5D). The effects on proliferation and adhesion to fibronectin, a major componentFig 4. Functional effects of anti-miR-196a in HNSCC-derived cell lines. 4A.B16 and D19 cells were
transfected with anti-miR-196a and negative control resulting in 95% and 92% reduction in miR-196a expression respectively compared to negative control.4B-E.Anti-miR-196a decreases adhesion to fibronectin (B; in B16 only), migration (C), invasion (D) but has no effect on proliferation (E) in HNSCC cells.
of the extracellular matrix, were more variable as reducing miR-196a expression reduced adhe-sion in HNSCC cells but not OPM cells, with no effect on proliferation in either cell type(Fig 4B and 4E). Supporting these observations, increased migration was seen after transfection of OKF4 (immortalised NOK) with pre-miR-196a, whilst there was no effect on proliferation or adhesion (data not shown). ReducingHOXB9expression by siRNA additionally reduced pro-liferation of OPM and HNSCC cells (Fig 5E). Adhesion to fibronectin was significantly in-creased in B16 only, but only to a small degree (Fig 5B).
Expression microarray analysis identifies known and putative miR-196a
targets
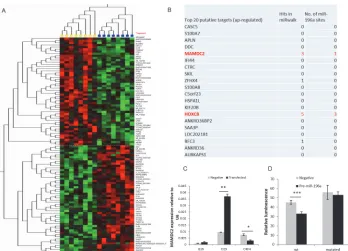
[image:12.612.199.471.72.330.2]Expression array data from both anti-miR (B16 and D19) and pre-miR (OKF4) transfected cells were used to identify consistent changes in gene expression related to alterations in miR-196a expression. This approach identified 353 altered genes (p<0.01 by t-test) with the top 50 up- and down-regulated shown inFig 6A. Gene Ontology (GO) enrichment analysis using DAVID (http://david.abcc.ncifcrf.gov) demonstrated a number of over-represented GO bio-logical processes, including amine/amino acid transport, DNA repair and regulation of tran-scription (S5 Table). From this list, the top 20 up-regulated genes underwent furtherin-silico analysis for predicted miR-196a binding to the 3’UTR of each gene, to further focus the list to potential direct targets of miR-196a (Fig 6B). Other than HOXC8 (S3D Fig), which has already been demonstrated to be a target of miR196a [18], the gene with the highest predicted interac-tion with miR-196a was MAM Domain Containing 2 (MAMDC2), which showed a good match based on sequence complementarity, energy of binding and evolutionary conservation
Fig 5. Functional effects ofHOXB9siRNA in HNSCC-derived cell lines. 5A. B16 and D19 cells were
transfected withHOXB9siRNA and negative control. There was 62% and 48% down-regulation seen in
HOXB9expression compared to negative control in B16 and D19 respectively.5B-E.HOXB9siRNA decreases migration (C), invasion (D) and proliferation (E) with no consistent change in adhesion to fibronectin (B) in HNSCC cells.*p<0.05,**p<0.01,***p<0.001. All experiments were conducted in duplicate and completed three times.
of the site of 3’UTR to miR-196a (www.microrna.org). qPCR analysis of a number of reported miR196a targets in other cancers,KRT5,ANXA1,S100A9andHOXC8, was conducted (S2 Fig) [20,27]. These showed no consistent change on knockdown of miR196a in HNSCC and OPM cells, althoughHOXC8was differentially expressed in anti-miR196a transfected D19 cells.
MAMDC2
is a novel direct target of miR-196a
[image:13.612.202.550.74.325.2]The change inMAMDC2expression seen on manipulation of miR-196a expression was vali-dated by qPCR in the cells used in the microarray (Fig 6C). This confirmed the microarray data, showingMAMDC2expression increased after anti-miR-196a transfection in OPM (p<0.01) and HNSCC (p = 0.08) cells and was reduced after pre-miR-196a transfection into immortalised NOK (p<0.05). miR-196a over-expression significantly suppressed luciferase ac-tivity from a wild-typeMAMDC23’UTR reporter construct in B16 cells (Fig 6D). This sup-pression was not observed following mutation of the predicted miR-196a binding site (Fig 6D), indicating a direct effect of miR-196a onMAMDC2expression at a transcript level.
Fig 6. Prediction of putative targets of miR-196a in HNSCC-derived cell lines. 6A.Microarray Heat Map
depicting top 50 miR-196a up-regulated and down-regulated genes. Yellow samples were compared against blue samples (high and low miR-196a expression respectively) using Qlucore Omics Explorer with T-test, p<0.01. Yellow box consists of B16 negative control, D19 negative control and OKF4 pre-miR-196a transfected cells whereas blue box consists of B16 anti-miR-196a, D19 anti-miR-196a and OKF4 negative control transfected cells.6B. Table depicting top 20 up-regulated putative targets based on expression analysis and miRwalk analysis of potential miRNA targets. It also shows number of miR-196a binding sites present in 3’UTR of the gene (www.microRNA.org)6C:The changes inMAMDC2expression on transfection of anti-miR-196a were validated by qPCR in samples used in microarray.6D: pMIR-REPORT luciferase vector was cloned with wild-typeMAMDC23’UTR (wt) and the predicted miR-196a site in the 3’UTR was mutated by site-directed mutagenesis (mutated). These were co-transfected with negative control or pre-miR-196a, pRL-TK renilla luciferase control vector into B16 (HNSCC cells). The relative luminescence value (firefly/renilla value) of wt/pre-miR-196a was significantly lower than wt/negative control, with no significant difference in the mutated 3’UTR.*p<0.05,**p<0.01,***p<0.001.
Discussion
There is now considerable evidence that miR-196a and HOXB9 exert a pro-tumorigenic influ-ence in many cancers [13,15,22,27]. Our data convincingly demonstrate high expression of both miR-196a andHOXB9in HNSCC and in at least a subset of OPMs. This is in keeping with recent studies in HNSCC and also a number of other cancers, including breast and non-small cell lung carcinoma (NSCLC) [5,7,22,28,30,44]. Furthermore, a key role for miR-196a polymorphisms has emerged in relation to cancer risk, conferring increased susceptibility to a number of cancers, particularly in Asian populations [45]. Despite a well-recognised role in in-vasive disease, the function of miR-196a overexpression in the pre-inin-vasive stage of HNSCC development has not been investigated before. We found high miR-196a expression in some OPM samples, whilst in others the level of expression is similar to NOK. Further investigations will be required to define the role of this overexpression and whether OPMs with high miR-196a expression progress to HNSCC.
Recent investigations in oral carcinomas have also demonstrated a pro-tumorigenic pheno-type in cells expressing high levels of miR-196a, and this has been linked to poor patient out-come, with similar effects seen in NSCLC and gastric cancer [16,25]. Liu et al showed overexpression of miR-196a in HNSCC cells had little effect on tumour cell proliferation, but did result in an increase in cell migration [22], which is in keeping with our findings and also those seen on manipulation of miR-196a expression in a number of other cancer cell types [46]. Conversely, overexpression of miR-196a in NOKs resulted in a marked reduction in pro-liferation [30], but it is difficult to directly compare these effects with those seen in HNSCC cells given the markedly different genomic and transcriptomic background. Our investigations of transfection of pre-miR-196a into the immortalised NOK cell line OKF4 showed no change in proliferation and a small increase in migration (data not shown).
HOXB9expression is elevated in a range of cancers including breast, NSCLC and hepatocel-lular carcinoma [5,7,47], but decreased expression has been related to poor prognosis in others [48]. The increased expression of HOXB9 in HNSCC which we have demonstratedin vitroand in tissues has also been shown in a small number of other microarray analyses and in compara-ble qPCR assessment ofHOXgene expression in HNSCC [17,49,50]. The identification of the differential expression ofHOXB9in HNSCC in the array analysis of Ginos et al [49] is notable asHOXB9was not identified in the original Hunter et al dataset [3], but was shown in this study by qPCR (Fig 2). This illustrates the limitations of many expression array analyses given the variability of samples analysed and uncertainties surrounding the probesets which have been used to detect the targets. For the first time we have demonstrated increasedHOXB9 ex-pression in OPM cultures, which was not seen in the investigation of Hassan et al [17]. Howev-er, 3 of the 4 cultures we used were derived from severely dysplastic lesions which progressed to HNSCC in less than 6 months (D19, D20 and D35). This indicates that a more detailed anal-ysis of the expression and role of HOXB9 in OPM is warranted to determine if expression of HOXB9 increases with OPM severity.
issues to address in relation to both miR196a and HOXB9 and we are currently undertaking further investigation of the mechanisms of altered migration and invasion.
The apparent similarity in the patterns of expression ofHOXB9and miR-196a has been demonstrated in Hodgkin lymphoma and AML cells, suggesting co-regulation, but in neither case were further investigations conducted [53,54]. The presence of numerous polycistronic transcripts from theHOXloci has been inferred from analysis of high resolution transcription-al profiling, including a putative transcript which includesHOXB7,HOXB8,HOXB9and miR-196a-1 [55]. This transcript is annotated in Ensembl (Transcript: RP11-357H14.19–001), without direct experimental evidence of its existence. We have demonstrated the existence of a transcript that at least spans the 6.3kb region between the open reading frames ofHOXB9and miR-196a-1. However, what is not clear is what proportion ofHOXB9and miR-196a expres-sion is accounted for by this transcript. Given that the expresexpres-sion ofHOXB9and miR-196a is not completely coordinated, particularly in OPM cells (Figs2Band1C), it is likely that this transcript only contributes a proportion of the pool of processed mRNA forHOXB9and miR-196a, indicating that, whilst there may be co-expression, expression of HOXB9 and miR-196a is under the control of other factors, which remain to be elucidated, which are responsible for different transcripts. An understanding of the primary transcripts used in the expression of bothHOXB9and miR-196a will be important in directing possible approaches to inhibition.
There are significant difficulties in the identification of endogenous miRNA targets and this has led to the use of a wide range of techniques, ranging fromin-silicomethods to direct assess-ment of binding between the miRNA seed sequence and binding site in the 3’UTR of cognate mRNAs. We decided to pursue novel targets of miR-196a by expression microarray following miR-196a over-expression and knockdown, despite the acknowledged limitations of this ap-proach, including possible effects on protein and not mRNA. The microarray expression data and subsequentin-silicoanalysis identified a number of potential targets of miR-196a, includ-ing some which have been identified in other cell types, such asHOXC8(S3 Fig) [18]. However, the overall GO enrichment analysis only identified a small number of enriched biological pro-cesses that were affected by manipulation of miR-196a expression. The most enriched catego-ries included DNA repair, the DNA damage response and various transporter pathways (S1 Table). These do not appear to map directly to the observed phenotype, which may be partly due to the relatively small number of differentially expressed genes identified and also demon-strate the interaction of miR-196a in a controlling a wide range of different processes in the cell. Interestingly, we observed no consistent changes in the expression of miR-196a targets which have been identified in other cancer types. This may indicate a level of tumour specificity in the actions of miR-196a.
Given that elevatedHOXB9expression and high serum levels of miR-196a have been associ-ated with poor prognosis and recurrence in other tumour types [5,7,16], it is conceivable, that together, they may be of prognostic use in HNSCC. Potential therapeutic applications may be more challenging as, whilst inhibitors of theHOX-PBXinteraction are available and effective [8], some of the 5’HOXgenes (e.g.HOXD10andHOXB9) are less PBX dependent which may limit their use [60], thus new strategies for disruption of this interaction may prove more effec-tive. Furthermore, if the molecular mechanisms responsible for the transcription of the novel primary transcript identified here can be elucidated, it may be possible to inhibit its expression and subsequent effects.
Conclusions
In this manuscript we have demonstrated that both HOXB9 and miR196a are highly expressed in HNSCC bothin vivoandin vitro. Both exert a pro-tumour phenotype and we have demon-strated a putative primary transcript which bears both coding sequences. This suggests that inhibition of expression of genes across this locus may prove a useful therapeutic strategy as this will inhibit a number of pro-tumorigenic factors. Furthermore we have identified MAMDC2 as a novel target of miR196a in HNSCC, suggesting further interrogation of the bio-logical significance of the miR-196a/MAMDC2 axis may enhance understanding of HNSCC pathogenesis.
Supporting Information
S1 Fig. Schematic diagram of the putative primary transcript and the length of the PCR product for both the primers utilised in the nested PCR analysis.
(TIF)
S2 Fig. Expression of all HOX genes analysed by qPCR, showing data in the full panel of cell cultures tested, including normal (black), OPM (red) and HNSCC (blue), arranged by group (A-D) and in numerical order.
(TIF)
S3 Fig. Expression of putative miR196a targets suggested form investigation in other can-cers, as assessed by qPCR in anti-miR196a transfected D19 and B16 cells, and pre-miR
196a transfected OKF4 cells in panel D. A: Keratin V;B: Anexin A1;CS100A9;D: HOXC8.
Only HOXC8 shows significant changes in expression and this only in D19 (p<0.01). The data does not support regulation of KRT5, ANXA1 or S100A9 by miR196a in HNSCC.
(TIF)
S1 Table. Clinical details of the HNSCC and OPM cell lines used in this study.All cell lines
are HPV negative. (DOCX)
S2 Table. Clinical and pathological details of the 25 HNSCC samples in the TMA used for
HOXB9 IHC.FOM = Floor of mouth, RM = retromolar, BM = buccal mucosa.
(DOCX)
S3 Table. Clinical pathological details of HNSCC samples used for Laser capture microdis-section FOM = Floor of mouth, RM = retromolar, BM = buccal mucosa.
(DOCX)
S4 Table. A full list of qPCR primers used in this study.
S5 Table. Gene ontology enrichment analysis demonstrating significantly enriched GO
bio-logical processes on manipulation of miR-196a expression.The total number of significantly
differentially expressed genes entered into this analysis was 353. Analysis generated by analysis of the gene list in DAVID (http://david.abcc.ncifcrf.gov).
(DOCX)
Author Contributions
Conceived and designed the experiments: LD FH RM CM DWL KDH. Performed the experi-ments: LD FH. Analyzed the data: LD FH RM CM DWL KDH. Contributed reagents/materi-als/analysis tools: CR CM DWL KDH. Wrote the paper: LD FH RM CM DWL KDH.
References
1. Markovic A, Chung CH (2012) Current role of EGF receptor monoclonal antibodies and tyrosine kinase inhibitors in the management of head and neck squamous cell carcinoma. Expert Rev Anticancer Ther 12: 1149–1159. doi:10.1586/era.12.91PMID:23098115
2. Leemans CR, Braakhuis BJ, Brakenhoff RH (2011) The molecular biology of head and neck cancer. Nat Rev Cancer 11: 9–22. doi:10.1038/nrc2982PMID:21160525
3. Hunter KD, Thurlow JK, Fleming J, Drake PJ, Vass JK, et al. (2006) Divergent routes to oral cancer. Cancer Res 66: 7405–7413. PMID:16885335
4. Grier DG, Thompson A, Kwasniewska A, McGonigle GJ, Halliday HL, et al. (2005) The pathophysiology of HOX genes and their role in cancer. J Pathol 205: 154–171. PMID:15643670
5. Calvo R, West J, Franklin W, Erickson P, Bemis L, et al. (2000) Altered HOX and WNT7A expression in human lung cancer. Proc Natl Acad Sci U S A 97: 12776–12781. PMID:11070089
6. Barber BA, Rastegar M (2010) Epigenetic control of Hox genes during neurogenesis, development, and disease. Ann Anat 192: 261–274. doi:10.1016/j.aanat.2010.07.009PMID:20739155
7. Hayashida T, Takahashi F, Chiba N, Brachtel E, Takahashi M, et al. (2010) HOXB9, a gene overex-pressed in breast cancer, promotes tumorigenicity and lung metastasis. Proc Natl Acad Sci U S A 107: 1100–1105. doi:10.1073/pnas.0912710107PMID:20080567
8. Morgan R, Plowright L, Harrington KJ, Michael A, Pandha HS (2010) Targeting HOX and PBX tran-scription factors in ovarian cancer. BMC Cancer 10: 89. doi:10.1186/1471-2407-10-89PMID:
20219106
9. Taketani T, Taki T, Shibuya N, Kikuchi A, Hanada R, et al. (2002) Novel NUP98-HOXC11 fusion gene resulted from a chromosomal break within exon 1 of HOXC11 in acute myeloid leukemia with t(11;12) (p15;q13). Cancer Res 62: 4571–4574. PMID:12183408
10. Raza-Egilmez SZ, Jani-Sait SN, Grossi M, Higgins MJ, Shows TB, et al. (1998) NUP98-HOXD13 gene fusion in therapy-related acute myelogenous leukemia. Cancer Res 58: 4269–4273. PMID:9766650
11. Raman V, Martensen SA, Reisman D, Evron E, Odenwald WF, et al. (2000) Compromised HOXA5 function can limit p53 expression in human breast tumours. Nature 405: 974–978. PMID:10879542
12. Rodriguez BA, Cheng AS, Yan PS, Potter D, Agosto-Perez FJ, et al. (2008) Epigenetic repression of the estrogen-regulated Homeobox B13 gene in breast cancer. Carcinogenesis 29: 1459–1465. doi:
10.1093/carcin/bgn115PMID:18499701
13. Seki H, Hayashida T, Jinno H, Hirose S, Sakata M, et al. (2012) HOXB9 expression promoting tumor cell proliferation and angiogenesis is associated with clinical outcomes in breast cancer patients. Ann Surg Oncol 19: 1831–1840. doi:10.1245/s10434-012-2295-5PMID:22396001
14. Plowright L, Harrington KJ, Pandha HS, Morgan R (2009) HOX transcription factors are potential thera-peutic targets in non-small-cell lung cancer (targeting HOX genes in lung cancer). Br J Cancer 100: 470–475. doi:10.1038/sj.bjc.6604857PMID:19156136
15. Nguyen DX, Chiang AC, Zhang XH, Kim JY, Kris MG, et al. (2009) WNT/TCF signaling through LEF1 and HOXB9 mediates lung adenocarcinoma metastasis. Cell 138: 51–62. doi:10.1016/j.cell.2009.04. 030PMID:19576624
16. Tsai KW, Liao YL, Wu CW, Hu LY, Li SC, et al. (2012) Aberrant expression of miR-196a in gastric can-cers and correlation with recurrence. Genes Chromosomes Cancer 51: 394–401. PMID:22420029
18. Li Y, Zhang M, Chen H, Dong Z, Ganapathy V, et al. (2010) Ratio of miR-196s to HOXC8 messenger RNA correlates with breast cancer cell migration and metastasis. Cancer Res 70: 7894–7904. doi:10. 1158/0008-5472.CAN-10-1675PMID:20736365
19. Asli NS, Kessel M (2010) Spatiotemporally restricted regulation of generic motor neuron programs by miR-196-mediated repression of Hoxb8. Dev Biol 344: 857–868. doi:10.1016/j.ydbio.2010.06.003
PMID:20553899
20. Maru DM, Singh RR, Hannah C, Albarracin CT, Li YX, et al. (2009) MicroRNA-196a is a potential mark-er of progression during Barrett's metaplasia-dysplasia-invasive adenocarcinoma sequence in esopha-gus. Am J Pathol 174: 1940–1948. doi:10.2353/ajpath.2009.080718PMID:19342367
21. McGlinn E, Yekta S, Mansfield JH, Soutschek J, Bartel DP, et al. (2009) In ovo application of antago-miRs indicates a role for miR-196 in patterning the chick axial skeleton through Hox gene regulation. Proc Natl Acad Sci U S A 106: 18610–18615. doi:10.1073/pnas.0910374106PMID:19846767
22. Liu CJ, Tsai MM, Tu HF, Lui MT, Cheng HW, et al. (2012) miR-196a Overexpression and miR-196a2 Gene Polymorphism Are Prognostic Predictors of Oral Carcinomas. Ann Surg Oncol.
23. Yekta S, Shih IH, Bartel DP (2004) MicroRNA-directed cleavage of HOXB8 mRNA. Science 304: 594– 596. PMID:15105502
24. Braig S, Mueller DW, Rothhammer T, Bosserhoff AK (2010) MicroRNA miR-196a is a central regulator of HOX-B7 and BMP4 expression in malignant melanoma. Cell Mol Life Sci 67: 3535–3548. doi:10. 1007/s00018-010-0394-7PMID:20480203
25. Liu XH, Lu KH, Wang KM, Sun M, Zhang EB, et al. (2012) MicroRNA-196a promotes non-small cell lung cancer cell proliferation and invasion through targeting HOXA5. BMC Cancer 12: 348. doi:10. 1186/1471-2407-12-348PMID:22876840
26. Sun M, Liu XH, Li JH, Yang JS, Zhang EB, et al. (2012) MiR-196a is upregulated in gastric cancer and promotes cell proliferation by downregulating p27(kip1). Mol Cancer Ther 11: 842–852. doi:10.1158/ 1535-7163.MCT-11-1015PMID:22343731
27. Luthra R, Singh RR, Luthra MG, Li YX, Hannah C, et al. (2008) MicroRNA-196a targets annexin A1: a microRNA-mediated mechanism of annexin A1 downregulation in cancers. Oncogene 27: 6667–6678. doi:10.1038/onc.2008.256PMID:18663355
28. Hui AB, Shi W, Boutros PC, Miller N, Pintilie M, et al. (2009) Robust global micro-RNA profiling with for-malin-fixed paraffin-embedded breast cancer tissues. Lab Invest 89: 597–606. doi:10.1038/labinvest. 2009.12PMID:19290006
29. Mueller DW, Bosserhoff AK (2011) MicroRNA miR-196a controls melanoma-associated genes by regu-lating HOX-C8 expression. Int J Cancer 129: 1064–1074. doi:10.1002/ijc.25768PMID:21077158
30. Severino P, Bruggemann H, Andreghetto FM, Camps C, Klingbeil Mde F, et al. (2013) MicroRNA ex-pression profile in head and neck cancer: HOX-cluster embedded microRNA-196a and microRNA-10b dysregulation implicated in cell proliferation. BMC Cancer 13: 533. doi:10.1186/1471-2407-13-533
PMID:24209638
31. Burns J, Baird M, Clark L, Burns P, Edington K, et al. (1993) Gene mutations and increased levels of p53 protein in human squamous cell carcinomas and their cell lines. British Journal of Cancer 67: 1274–1284. PMID:8390283
32. Burns JE, McFarlane R, Clark LJ, Mitchell R, Robertson G, et al. (1994) Maintenance of identical p53 mutations throughout progression of squamous cell carcinomas of the tongue. Eur J Cancer B Oral Oncol 30B: 335–337. PMID:7703803
33. Prime SS, Nixon SV, Crane IJ, Stone A, Matthews JB, et al. (1990) The behaviour of human oral squa-mous cell carcinoma in cell culture. J Pathol 160: 259–269. PMID:1692339
34. McGregor F, Muntoni A, Fleming J, Brown J, Felix DH, et al. (2002) Molecular changes associated with oral dysplasia progression and acquisition of immortality: potential for its reversal by 5-azacytidine. Cancer Res 62: 4757–4766. PMID:12183435
35. McGregor F, Wagner E, Felix D, Soutar D, Parkinson K, et al. (1997) Inappropriate retinoic and receptor
βexpression in oral dysplasias: correlation with acquisition of the immortal phenotype. Cancer research 57: 3886–3889. PMID:9307265
36. Colley HE, Hearnden V, Jones AV, Weinreb PH, Violette SM, et al. (2011) Development of tissue-engi-neered models of oral dysplasia and early invasive oral squamous cell carcinoma. Br J Cancer 105: 1582–1592. doi:10.1038/bjc.2011.403PMID:21989184
37. Dickson MA, Hahn WC, Ino Y, Ronfard V, Wu JY, et al. (2000) Human keratinocytes that express hTERT and also bypass a p16(INK4a)-enforced mechanism that limits life span become immortal yet retain normal growth and differentiation characteristics. Mol Cell Biol 20: 1436–1447. PMID:10648628
39. Neves JI, Begnami MD, Arias V, Santos GC (2005) Antigen retrieval methods and estrogen receptor immunoexpression using 1D5 antibody: a comparative study. Int J Surg Pathol 13: 353–357. PMID:
16273191
40. Detre S, Saclani Jotti G, Dowsett M (1995) A "quickscore" method for immunohistochemical semiquan-titation: validation for oestrogen receptor in breast carcinomas. J Clin Pathol 48: 876–878. PMID:
7490328
41. Mao L, Ding J, Zha Y, Yang L, McCarthy BA, et al. (2011) HOXC9 links cell-cycle exit and neuronal dif-ferentiation and is a prognostic marker in neuroblastoma. Cancer Res 71: 4314–4324. doi:10.1158/ 0008-5472.CAN-11-0051PMID:21507931
42. Drabkin HA, Parsy C, Ferguson K, Guilhot F, Lacotte L, et al. (2002) Quantitative HOX expression in chromosomally defined subsets of acute myelogenous leukemia. Leukemia 16: 186–195. PMID:
11840284
43. Nonn L, Vaishnav A, Gallagher L, Gann PH (2010) mRNA and micro-RNA expression analysis in laser-capture microdissected prostate biopsies: valuable tool for risk assessment and prevention trials. Exp Mol Pathol 88: 45–51. doi:10.1016/j.yexmp.2009.10.005PMID:19874819
44. Chen Z, Jin Y, Yu D, Wang A, Mahjabeen I, et al. (2012) Down-regulation of the microRNA-99 family members in head and neck squamous cell carcinoma. Oral Oncol 48: 686–691. doi:10.1016/j. oraloncology.2012.02.020PMID:22425712
45. Zhang H, Su YL, Yu H, Qian BY (2012) Meta-Analysis of the Association between Mir-196a-2 Polymor-phism and Cancer Susceptibility. Cancer Biol Med 9: 63–72. doi:10.3969/j.issn.2095-3941.2012.01. 012PMID:23691458
46. Tsai MM, Wang CS, Tsai CY, Chen CY, Chi HC, et al. (2014) MicroRNA-196a/-196b promote cell me-tastasis via negative regulation of radixin in human gastric cancer. Cancer Lett 351: 222–231. doi:10. 1016/j.canlet.2014.06.004PMID:24933454
47. Kanai M, Hamada J, Takada M, Asano T, Murakawa K, et al. (2010) Aberrant expressions of HOX genes in colorectal and hepatocellular carcinomas. Oncol Rep 23: 843–851. PMID:20127028
48. Sha S, Gu Y, Xu B, Hu H, Yang Y, et al. (2013) Decreased expression of HOXB9 is related to poor over-all survival in patients with gastric carcinoma. Dig Liver Dis.
49. Ginos MA, Page GP, Michalowicz BS, Patel KJ, Volker SE, et al. (2004) Identification of a gene expres-sion signature associated with recurrent disease in squamous cell carcinoma of the head and neck. Cancer Res 64: 55–63. PMID:14729608
50. Walter V, Yin X, Wilkerson MD, Cabanski CR, Zhao N, et al. (2013) Molecular subtypes in head and neck cancer exhibit distinct patterns of chromosomal gain and loss of canonical cancer genes. PLoS One 8: e56823. doi:10.1371/journal.pone.0056823PMID:23451093
51. Chiba N, Comaills V, Shiotani B, Takahashi F, Shimada T, et al. (2012) Homeobox B9 induces epitheli-al-to-mesenchymal transition-associated radioresistance by accelerating DNA damage responses. Proc Natl Acad Sci U S A 109: 2760–2765. doi:10.1073/pnas.1018867108PMID:21930940
52. Sha L, Dong L, Lv L, Bai L, Ji X (2014) HOXB9 promotes epithelial-to-mesenchymal transition via trans-forming growth factor-beta1 pathway in hepatocellular carcinoma cells. Clin Exp Med.
53. Nagel S, Burek C, Venturini L, Scherr M, Quentmeier H, et al. (2007) Comprehensive analysis of homeobox genes in Hodgkin lymphoma cell lines identifies dysregulated expression of HOXB9 mediat-ed via ERK5 signaling and BMI1. Blood 109: 3015–3023. PMID:17148583
54. Danen-van Oorschot AA, Kuipers JE, Arentsen-Peters S, Schotte D, de Haas V, et al. (2012) Differen-tially expressed miRNAs in cytogenetic and molecular subtypes of pediatric acute myeloid leukemia. Pediatr Blood Cancer 58: 715–721. doi:10.1002/pbc.23279PMID:21818844
55. Mainguy G, Koster J, Woltering J, Jansen H, Durston A (2007) Extensive polycistronism and antisense transcription in the mammalian Hox clusters. PLoS One 2: e356. PMID:17406680
56. Cismasiu VB, Denes SA, Reilander H, Michel H, Szedlacsek SE (2004) The MAM (meprin/A5-protein/ PTPmu) domain is a homophilic binding site promoting the lateral dimerization of receptor-like protein-tyrosine phosphatase mu. J Biol Chem 279: 26922–26931. PMID:15084579
57. Diaz-Lopez A, Iniesta P, Moran A, Ortega P, Fernandez-Marcelo T, et al. (2010) Expression of Human MDGA1 Increases Cell Motility and Cell-Cell Adhesion and Reduces Adhesion to Extracellular Matrix Proteins in MDCK Cells. Cancer Microenviron 4: 23–32. doi:10.1007/s12307-010-0055-2PMID:
21505559
59. Yu J, Becka S, Zhang P, Zhang X, Brady-Kalnay SM, et al. (2008) Tumor-derived extracellular muta-tions of PTPRT /PTPrho are defective in cell adhesion. Mol Cancer Res 6: 1106–1113. doi:10.1158/ 1541-7786.MCR-07-2123PMID:18644975