Exploring the impact of innovative developments to the installation process for an
offshore wind farm
E. Barlowa,b*, D. Tezcaner Öztürka,b, M. Reviea, E. Boulougourisb, A.H. Dayb and K. Akartunalıa a
Department of Management Science, University of Strathclyde, Glasgow, G1 1QE, UK.
b Department of Naval Architecture, Ocean and Marine Engineering, University of Strathclyde, Glasgow, G4 0LZ, UK.
Abstract
For offshore wind to be competitive with mature energy industries, cost efficiencies must be
improved throughout the lifetime of an offshore wind farm (OWF). With expensive equipment hire
spanning several years, installation is an area where large savings can potentially be made.
Installation operations are subject to uncertain weather conditions, with more extreme conditions
as OWF developments tend towards larger sites, further offshore in deeper waters. One approach to
reduce the cost of the installation process is to evaluate advanced technologies or operational
practices. However, in order to demonstrate cost savings, the impact of these advances on the
installation process must be quantified in the presence of uncertain environmental conditions. To
addresses this challenge a simulation tool is developed to model the logistics of the installation
process and to identify the vessels and operations most sensitive to weather delays. These
operations are explored to identify the impact of technological or operational advances with respect
to weather delays and the resulting installation duration under different levels of weather severity.
The tool identifies that loading operations contribute significantly to the overall delay of the
installation process, and that a non-linear relationship exists between vessel operational limits and
the duration of installation.
Keywords: Wind energy; offshore wind farms; installation logistics; discrete event simulation
1. Introduction
1.1 Problem context and background
The European offshore wind industry continues to expand, and there is currently a transition
(EWEA 2013). In some cases these sites will be completed over several phases, and when complete
will comprise hundreds of turbines (Renewable UK 2014). To accommodate these massive turbine
arrays, developments are moving further offshore into deeper water (for example from
approximately 8m depth to over 70m depth) and harsher weather conditions. New operational
challenges arise as developments move from smaller coastal sites, less than a few kilometres
offshore, to larger offshore sites that can be over 100 kilometres from land. These changes pose
additional difficulties due to the scale of offshore operations and the increased exposure to more
extreme environmental conditions. With limited industry experience to identify good practice
guidelines for these large offshore developments, the levelised cost of offshore wind energy is
comparatively higher than other energy sources (Ove Arup & Partners Ltd. 2011), and there is
pressure on the industry to improve cost efficiencies throughout the lifetime of an offshore wind
farm (OWF).
Installation and logistics have been identified as areas where substantial cost reductions can be
achieved through innovation (Offshore Wind Cost Reduction Task Force 2012, European Wind
Energy Technical Platform 2014). One route to promote innovative developments to the installation
process is to improve the understanding of the economic impact of technological and vessel
capabilities on an installation schedule. This enables novel designs for installation vessels and
techniques to be validated, and developments in operating capability to be directed such that
maximum reductions to the installation costs are achieved.
The vessels employed to install the first OWFs were often recruited from the oil and gas industry.
The high demand for these vessels would result in high day-rates, while the capability of the vessels
would often exceed the requirements for the OWF installation projects. As the OWF market has
increased, the reliance on oil and gas vessels has reduced and purpose-built OWF installation vessels
The demand for specialist OWF installation vessels continues to grow, with various vessels built and
commissioned recently (see for example Offshore Wind (2014a,2014b,2014c,2015b,2015c)) and
demand is expected to continue to grow over the coming years (Offshore Wind 2015a). In a small
number of cases, proposed designs for specialist OWF installation vessels have been significantly
novel (see for example the Wind Turbine Shuttle (Huisman 2013), the Windlifter (Ulstein 2013) and
the Windfarm Installation Barge (Ingenium 2011)). These vessel designs are generally conceptual,
however, and may struggle to achieve the industry backing and demand to support construction.
The trend to date with purpose-built OWF installation vessels has been to develop vessels which are
suited to the changing physical requirements of installations. Larger vessels with increased carrying
capacity are being developed (Offshore Wind 2014a, 2014b), which are capable of working with the
growing size of OWF assets (EWEA 2015). Furthermore, the vessels developed are capable of
operating at the increasing depths required for the next phase of OWF developments. This trend of
increasing vessel capacity has been identified by industry and governmental guidance, as a key
requirement to support the anticipated growth of the OWF industry in the coming years (Roberts et
al. 2013).
One barrier limiting the adoption of novel vessel designs, and similarly novel installation techniques,
is a lack of substantive and quantitative evidence as to the practical benefits which could be
achieved. This paper presents a methodological framework which directly addresses this problem. A
holistic two-stage approach is presented, which can be used to evaluate innovations to installation
vessel design and operation, and innovative technological developments to the installation process.
The first stage identifies the operations during the entire installation process which are most
susceptible to weather delays. These operations can be considered critical in terms of their impact
installation process under a scenario where innovative developments were capable of reducing the
weather-sensitivity of these critical operations. By targeting the most critical operations, this
two-stage approach has the greatest potential to deliver substantial improvements to the overall
efficiency of the installation process. It is perhaps worth highlighting that the methods discussed
here can be applied to interrogate innovative developments to the installation process which are
proposed through any other mechanism. For example, innovative developments which arise through
design requirements can be analysed to identify the practical benefits which would be provided. This
would provide guidance as to design criteria which should be pursued, and criteria which cannot be
expected to provide real benefit.
The methodology presented here can be used to drive innovative developments to the installation
of an OWF. Novel concepts can be explored at the preliminary stages of a vessel design, and a
realistic assessment of the expected benefits in terms of operation durations and costs can be
determined. In a similar manner, new approaches to OWF component design and installation
techniques can be evaluated with respect to the impact these will be expected to have on the
duration and costs of the installation. By improved understanding of the impact of innovations, the
most strategically beneficial can be pursued, which will contribute towards reducing the lifetime
costs of an OWF and help to cement offshore wind as a viable energy source.
The remainder of this paper is structured as follows: in Section 1.2 relevant literature on innovative
developments to OWF installations is discussed; Section 2 describes the methodology employed
here to investigate these developments. In Section 3 a fictional case-study designed to be
representative of the next phase of European OWF developments is utilised to explore the impact of
weather delays, and the impact on these delays is investigated as potential improvements to the
1.2 Relevant literature on innovations in the installation of offshore wind farms
The traditional approach in the design of new vessels is to identify the requirements of the vessel in
its anticipated role, and to devise a vessel design which addresses these requirements, as
exemplified in Offshore Marine Technology (2013a, 2013b). Gaspar et al. (2012) provide an overview
of advances in ship design, and present an approach to handle various aspects of complexity in the
design of an offshore supply vessel. Boulougouris and Papanikolaou (2013) present an approach for
the design of naval vessels which incorporates the risk with respect to flooding as an objective in the
design process.
Roberts et al. (2013) outline an approach which focuses on the anticipated needs from OWF
installation vessels to be developed in the coming years. In their analysis of the supply chain
requirements to support the growth of the offshore wind industry to 2030, they discuss the key OWF
assets and the means by which these are installed. The requirements of OWF installation vessels
anticipated over this period is discussed, with focus on the physical suitability of vessels with respect
to the changing size and depth requirements of OWF sites.
Perveen et al. (2014) provide a recent review which covers the various stages throughout the
lifetime of an OWF, from planning through to decommissioning. At each stage they discuss the
expected technological, ecological and policy-based developments, and discuss the associated
challenges. With regard to technological advances in the OWF installation process, there is currently
much interest in the development of floating turbines (Perveen et al. 2014, EWEA 2013), which allow
deployment of OWTs in waters too deep for economical installation of fixed foundations. Another
area receiving much attention is the development of new types of fixed foundation structures to
support the wind turbine, particularly for intermediate depth waters, with novel simplified jacket
in development and testing, however, and market ready floating turbines or novel jacket designs are
not expected in the near future (Roberts et al. 2013, EWEA 2013).
To the authors’ best knowledge, there are few methodologies and software specifically aimed at
evaluating installation logistics for an OWF, and to support in the planning of installation operations.
Improving the installation process has been identified by the European Wind Energy Technology
Platform as a key area for development in order to achieve the lower cost of offshore wind energy
required for competition with conventional energy sources (European Wind Energy Technical
Platform 2014). As outlined in Section 1.1, this capability is essential to provide an assessment of the
practical benefits gained from any innovative developments to the OWF installation process. One
tool with relevance in this area is the decision support system presented by Lange et al. (2012). This
simulation tool models the construction of an OWF from the manufacturing of components through
to installation. A high-level view of the entire installation process is obtained, and key stages in the
manufacture and supply network which could lead to bottlenecks can be identified. The wide scope
of this tool necessitates a relatively simplistic model of the installation process, however, and this
tool would therefore not provide the intricate modelling of the OWF installation operations that is
required to accurately evaluate an installation schedule. Morandeau et al. (2013) and Walker et al.
(2013) present another tool which can be applied to model the OWF installation process. This
simulation-based tool uses hindcast weather data to model the progress of offshore operations. This
tool has, however, only been applied to the installation of a single asset to-date, and it is unclear of
the tool is capable of accurately the installation of an OWF over multiple seasons with multiple
parallel streams of operations. To the best of our knowledge, the only tool with this capability
demonstrated in the academic literature is the installation logistics simulation tool developed by
Barlow et al. (2014). They present a discrete-event simulation model of the installation of an OWF,
which provides an accurate representation of a large-scale installation project in terms of the
realistic assessment of the benefits gained through a given operational or technological
development, and is the method employed here to explore potential innovative developments.
2. Methodology
In this paper the installation model and simulation tool developed by Barlow et al. (2014) is utilised
to assess the duration of an OWF installation following a given installation scenario, and to explore
the impact on this duration when the operational capabilities of specific installation tasks are varied.
Section 2.1 describes the development of this installation model, and in Section 2.2 the key OWF
assets are described. A description of the installation model is provided, with detail on the modelling
of offshore installation operations for each OWF asset. In Section 2.3 the structure of the installation
model is described, in terms of the ordering and dependencies between different streams of
operations. A description of the various categories of vessel which may be involved during an OWF
installation, and how these are modelled, is provided in Section 2.4. Section 2.5 provides a high-level
description of the simulation tool. The descriptions provided here are complimentary to those
provided in Barlow et al. (2014), where additional information on the installation model and
simulation tool can be obtained.
2.1 Installation model development
The installation model presented by Barlow et al. (2014) was iteratively developed through close
collaboration with experts from three companies with direct experience of the European OWF
industry: SSE Renewables, Scottish Power Renewables and Technip Offshore Wind Limited. This
model was tailored to the next phase of European OWF developments, which are typically larger
sites situated further from shore in deeper water than current sites. The model is centred on the
installation of key assets which are described in detail in Section 2.2. The installation model has been
throughout the model development, and additionally the outputs of the model have been
independently validated against an industry standard tool.
2.2 Description of OWF assets and their installation modelling
The most recognisable assets are perhaps the Wind Turbine Generators (WTGs), which comprise
tower sections, blades, hub and nacelle. The growth of the offshore wind industry has motivated the
development of specialist jack-up installation vessels. These vessels have retractable legs which can
be lowered to the sea-bed and used to raise the vessel above the surface of the sea, providing a
stable elevated platform to perform operations. The installation of a WTG structure consists of
jacking-up, including any pre-loading to test the stability of the elevation, release of the crane and
sea-fastenings, the installation of the turbine components, and finally jacking-down. Prior to
load-out of a WTG some degree of onshore assembly is performed, which is intended to simplify the
offshore assembly operations. Assembly options range from no assembly of the main components to
full assembly; however, while installation of fully-assembled WTGs has been tested, it is not
routinely adopted in practice (EWEA 2013). The most common approach by industry is currently to
combine the WTG tower sections, the nacelle and the hub onshore, followed by the offshore
installation of this combined component and the three blades. Different onshore assembly
approaches will lead to different durations and weather limits for the onshore assembly and the
offshore installation.
Offshore substation platforms (OSPs) may be included on an OWF to collect and/or convert the
generated power for transmission to the onshore grid. An OSP consists of a topside structure
housing the electrical components built on top of a subsea foundation. The OSP topside may be
The OSP topsides and WTGs are mounted on top of subsea foundations, which are secured to the
seabed. There are various types of foundation structure which may be used, depending on the
conditions of the seabed, the water depth and the weight of the topside structure (OSP topside or
WTG) (EWEA 2013). For water depths of more than 50 m, which is typical of the sites considered for
the next phase of developments in Europe, the standard industry approach is currently to use
pile-driven jackets – steel lattice structures which are secured to the seabed with steel piles (EWEA
2013). Pile-driven jackets may be installed through pre- or post-piling, depending on conditions and
the preference of the contractor. Piles and jackets are each considered as separate assets here.
For pre-piled foundations a template is first lowered to the seabed to provide the correct locations
at which the piles should be installed. Each pile corresponding to a given jacket is then installed in
turn by driving to a sufficient depth below the seabed. For WTG foundations four piles per jacket is
standard; however, for OSP foundations the number required may vary between 4-10 piles,
depending on the size of the jacket structure and the seabed conditions. The template is then
recovered if necessary. The jacket is fabricated as a single structure and is installed directly to the
appropriate location. Once the jacket and all corresponding piles have been installed at a given
location, grouting may be required to secure the jacket to the piles. Where the installation vessel is a
jack-up, jacking operations are carried out before and after the installation, with appropriate checks
on the stability of the vessel prior to commencing installation.
There are several different types of electrical cables required for an OWF: export cables connect the
OSPs to onshore substations and the onshore power grid, and inter-array cables connect the WTGs
to OSPs on-site. The export cables can be separated further into the main offshore sections and the
nearshore section, which connects to the onshore substations. Inter-array cables are typically
shorter than export cables, and are smaller in diameter due to the required transmission capacity of
each type of cable. The characteristics of the shore will determine the length of the nearshore
drilling. Inter-array cables and offshore export cable sections are secured at the first end, installed,
and secured at the second end. Inter-array cables are secured to a structure at each end through a
pull-in operation, with the complexity of the pull-in dependent the type of structure (WTG or OSP)
and the end of the cable (first or second end to be secured). Export cables are secured to an OSP at
one end and to the nearshore section at the other end, with the intermediate sections joined
between installations. Inter-array cables and offshore export cable sections are installed by
preparing a trench, laying the cable in the trench, and then burying the cable. The trenching and
burial operations may be completed simultaneously with the cable-lay, or may be carried out
separately.
A number of support operations may be required during the installation of an OWF. WTGs and OSP
topsides require the following sequence of operations to complete the installation: mechanical
completion, electrical completion, commissioning, testing, and acceptance. Each of these operations
can be performed in parallel across different structures and requires transfer of technicians on and
off the structure. Cable paths must be prepared prior to trenching to avoid obstacles such as existing
pipes and cables, or rocks and boulders. Additionally, the cable burial may require protection such as
rock-dumping.
Each asset is considered from arrival at the designated load-out port, with the potential for
marshalling ports to be used for the load-out of different types of asset. Loading operations are
performed with the vessel positioned at the quay-side, and may consist of some preparation
operations to ready the deck and release any fastenings on the vessel crane(s), the loading of each
asset from the quay-side to the vessel, and then sea-fastening of all loaded assets prior to transit to
the OWF site. Ports are generally shielded to some extent from the worst wave conditions, but may
2.3 Modelled structure of the installation operations
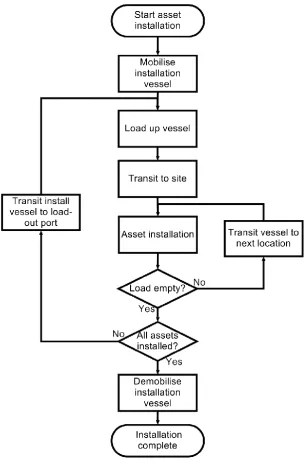
A high-level flowchart for a standard asset installation is displayed in Figure 1. The first stage is the
mobilisation of the installation vessel, which involves transiting the vessel to the required location
and any preparation required to make the vessel fit for the assigned installation tasks. Once ready,
assets are loaded-out until the vessel reaches capacity. The vessel then transits to the OWF site and
installs the first asset at the appropriate location. The vessel then continues to transit to a new
location and install an asset until the load is empty, at which time the vessel returns to port and
loads-out a new group of assets and repeats this process. Once all assets have been installed the
vessel remains in port and begins demobilisation operations. The installation of each of the key
assets follows a similar process, with the installation operations for each asset as described in
Section 2.2. Each installation operation is defined in terms of duration, weather and daylight
restrictions, and in cases where the operation can be completed in stages the minimum weather
window required for each stage is included.
Figure 2 shows the ordering between the different sets of installation operations. The first stage of
turbine construction is installation of the foundations, with either a pre- or post-piling approach. All
inter-array cables which connect to the turbine are then installed and commissioned. The WTG is
then installed, and completion and commissioning support operations are performed. OSPs are
installed in a similar fashion, with foundation installation followed by connection and commissioning
of all export and inter-array cables incident on the OSP. The OSP topside is installed, and completion
and commissioning support operations are performed. The export assets (export cables and OSPs)
can be installed almost entirely in parallel with the generation assets (WTGs, turbine foundations
and array cables); the only restriction is that an OSP is mechanically completed before
Figure 1: flowchart for a standard OWF asset installation (Barlow et al. 2014)
2.4 Modelling description of installation vessels and support vessel spread
As of 2011, 32 different vessels have been used in OWF installations (European Wind Energy
Association, 2011). Jack-ups are used for the majority of WTG installations and in some cases for
Figure 2: High-level schematic of relationship between OWF installation streams (Barlow et al. 2014)
continue to be the main type of vessels used for WTG installations. Dynamic-positioning heavy-lift
vessels have also been successfully used in the installation of turbine foundations. Semi-submersible
heavy-lift vessels could potentially be used for WTG and turbine foundation installations; however,
the oil and gas industry. Their use is therefore likely to be restricted to the shorter-term charters
required for the installation of OSP topsides and foundations, which are substantially heavier than
the other OWF assets. Specialist cable-laying vessels are used for cable installations, and the
different types of cable (nearshore and offshore export cables or inter-array cables) may have
different vessel requirements. Cable operations are potentially supported by remote operated
vehicles (ROVs).
The installation of some assets can optionally be supported by a number of supply barges and tugs.
Anchor handling tugs may also be required for specific vessels depending on their positioning
capability. The pre-cabling and post-cabling operations for export cables and inter-array cables will
each require specialist vessels and there may be a separate grouting vessel used for the OSP and WT
foundations. Crew transfer vessels (CTVs) are required to facilitate shift rotations for both vessel
crews and installation technicians on the installation vessels and support barges. Crew transfers are
also required during installation operations on WT and OSP locations, including OSP and WTG
completion and commissioning support operations and cable pull-in operations. A floatel – a floating
hotel used to accommodate installation technicians – may also be employed for large projects.
The model enables the installation of each category of asset to be performed by one or two
installation vessels, with the costs of using three installation vessels considered to be impractical in a
real-world installation project. Each installation vessel is uniquely defined in terms of operational
capability, the time required to complete each task and the weather and daylight restrictions which
would be associated with this, the cargo capacity and an average charter day-rate. Installation
vessels may optionally be used to install different types of asset, potentially with different operating
2.5 Simulation of an installation scenario
The simulation tool developed by Barlow et al. (2014) combines the logical model of the installation
discussed in Section 2.2 with a synthetic weather time-series model, as presented in Dinwoodie et al.
(2013). Monte Carlo simulation of the weather model is used to generate many realisations of
synthetic weather time-series, each of which are statistically representative of the characteristic
properties of historical data recorded at the OWF site. The OWF simulation tool models the progress
of the installation, given the defined installation scenario, subject to each synthetic weather series.
Taken over a large number of weather series, the simulation tool is therefore capable of providing
an accurate measure of how the installation may be expected to progress when a given installation
scenario is exposed to the uncertain future weather conditions arising over the course of the
installation.
A discrete-event simulation approach is employed, where the state of the system defines the
progress of each asset installation, the location of all vessels and barges, the time of arrival at this
location, and the respective loads. At each step of the simulation the next vessel or barge is selected,
given the required ordering of operations and the vessel and barge timers. The selected vessel or
barge completes its designated operation and the state of the system is updated. Further
information on the simulation tool is provided in Barlow et al. (2014). For a general introduction to
various simulation techniques, including Monte Carlo and discrete-event, see Kelton and Law (2000).
3. Exploring the efficacy of potential innovations to an OWF installation 3.1 Details of the analysis
The two-stage framework outlined in Section 1.1 is applied to propose and evaluate innovative
developments to the installation of an OWF. In the first stage the weather window delays
experienced by each installation operation are investigated, and the operations experiencing the
targeted operations are explored under scenarios where developments to the operation (in terms of
vessel capability, operational practice or utilised technology) are assumed to improve the weather
restrictions on performing the operation. In the analysis below, each unique set of operating
condition is investigated with 1000 simulation runs. This has been shown to provide an acceptable
level of accuracy within an acceptable timeframe for OWF installation problems of this size (Barlow
et al. 2014).
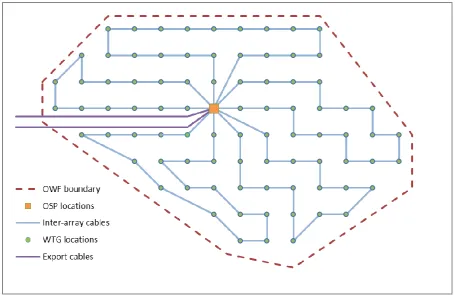
The fictional OWF installation case-study developed by Barlow et al. (2014) is employed, and the
layout of this site is shown in Figure 3. This case-study was developed through close collaboration
with industry partners, and is designed to be representative of the next phase of European OWFs.
The input parameter values were provided by industry partners based on their combined experience
from previous OWF installation projects; however, these inputs are entirely generic and do not
correspond to any specific OWF installation. The site is located in the North Sea 80 Nautical Miles
(NM) off the East coast of the UK with an average water depth of 50 m. The site has 84 turbines with
6 MW capacity giving a total of 504 MW generating capacity, one OSP with two export cables, and
89 inter-array cables, with the distance between any two on-site locations assumed to be 1 km.
Data from the FINO1 weather station (Bundesministerium fuer Umwelt 2012) is used to generate
the synthetic weather series. FINO1 weather station is an offshore weather research platform
located in the North Sea 45 km off the coast of Germany with high-quality publicly available weather
time-series recorded since 2003. Due to differences in location and proximity to shore, weather
conditions at specific UK Round 3 and Scottish territorial OWF sites may differ to those recorded at
FINO1. Three different versions of synthetically generated weather data are therefore used to
Figure 3: Layout of the OWF case study
generated from the historic data recorded from FINO1, with a different scaling factor applied in each
case. The scaling factors is applied to the magnitude of the wind and wave conditions to alter the
severity of weather conditions to which the installation is subjected. The three scaling factors used
are 90%, 100% and 110% magnitude of the synthetically generated weather data, such that the
scaled sets of weather data will represent slightly improved and slightly poorer weather conditions,
respectively. Each version of the synthetic weather data consists of 1000 sets of scaled wind and
wave time-series over the period of installation. This scaling retains the variation in weather
conditions and provides an indication of the expected impact of weather conditions at different
locations.
3.2 Stage one: identifying the installation operations to be targeted for development
As outlined above, the first stage in the investigative framework presented here was to explore the
1
[image:18.595.89.457.91.374.2]In the box plots in Figures 4, 7 and 9, the black and white target shows the median number of delays, and the solid rectangle shows the inter-quartile range (the distance between the 25th and 75th percentile), measured across all simulations. The lines extending from this solid rectangle display the spread of delays that lie within 150% of the inter-quartile range, measured from the 25th percentile and below, or the 75th percentile and above. This corresponds to approximately 99.3% data coverage for normally distributed data, and outliers are shown as crosses.
Figure 4: Distribution of the number of delays related to weather window availability recorded for
each installation vessel and set of supply barges
operations which should be targeted for development to improve their resilience to the weather
conditions. The installation scenario considered at this stage assumed that all installation vessels
used have a standard performance in terms of operational capability. The distribution of the number
of days of delay related to weather window availability is shown in Figure 4 for each installation
vessel and set of supply barges1. The delays related to weather window availability are caused through three factors: the wind conditions are higher than operational wind limits, the wave
conditions are higher than operational wave limits, or a given weather window has insufficient
(a) (b)
[image:19.595.77.501.77.452.2](c) (d)
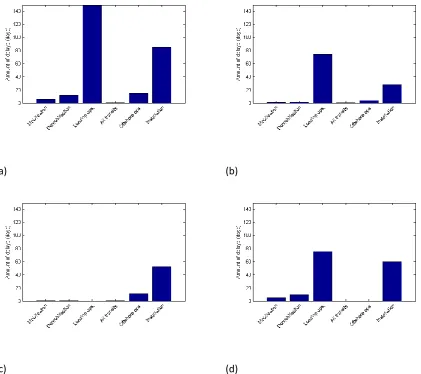
Figure 5: Breakdown of recorded weather window delays for the WTG installation vessel: (a) average
total delays per operation, (b) average delays due to size of weather window, (c) average delays due
to wave conditions, (d) average delays due to wind conditions.
Figure 4 indicates that the WTG installation vessel and the WT jacket installation vessel and supply
barges are most susceptible to delays related to weather window availability, with approximately
27% of all recorded weather window delays attributed to the WTG installation vessel, approximately
25% attributed to the WT jacket supply barges, and approximately 18% attributed to the WT jacket
installation vessel. In Figures 5-6 these delays are explored further, to identify the specific
operation(s) which are responsible for the recorded delays in each case. The plots shown in Figures
(a) (b)
[image:20.595.77.499.79.453.2](c) (d)
Figure 6: Breakdown of recorded weather window delays for the WT jacket installation: (a) average
total delays per operation, (b) average delays due to size of weather window, (c) average delays due
to wave conditions, (d) average delays due to wind conditions.
Figure 5 shows the delays recorded for the WTG installation vessel broken down by operation, with
all delays and delays recorded by window length and wind or wave conditions each shown
separately. Closer inspection reveals that the most restrictive operation for the WTG installation
vessel is the installation operation, where delays due to wind conditions account on average for
approximately 36% of all WTG installation vessel delays. This operation will be targeted for
In a similar manner to Figure 5, Figure 6 shows the breakdown of delays recorded for the WT jacket
installation operations. In this case there are several comparable factors which contribute to the
majority of delays: the wind limit and the required window length for the in-port jacket load-out
operation with supply barges (approximately 28% of delays in each case), and the wind and wave
limits required to install a WT jacket, where the installation vessel is supported by supply barges
(approximately 20% of delays in each case). The analysis below focuses on the targeted
development of the WT jacket load-out operation with respect to wind limit capability; however, any
of the factors discussed here could be treated similarly.
3.3 Stage two: exploring the potential for reducing installation durations through targeted operational developments
Having identified the installation operations to be targeted for development through stage one, the
second stage in the investigative framework presented here is to explore the impact that potential
[image:21.595.86.502.429.609.2](a) (b)
Figure 7: Boxplots showing (a) the total delays recorded due to wind conditions, and (b) the duration
of WTG installation vessel use, as the wind limit for the installation operation is varied from 5-15
m/s.
improvements to these operations could have on the installation duration, and therefore the
3.3.1 The WTG installation operation
Figure 7(a) shows the impact on the delays recorded for the WTG installation vessel as the wind limit
for the installation operation is varied between 7-13 m/s. Note that these delays are recorded
throughout the entire installation campaign as the vessel installs all 84 WTGs. This provides a
realistic representation of the impact on delays, with any changes regarding the performance of the
installation operation being realised in the context of the complete installation process. Increasing
the wind limit is shown to have a non-linear impact on the average number of delays recorded, with
comparatively less impact on the median number of delays as the wind limit increases. Figure 7(a)
demonstrates that the uncertainty in the number of delays is reduced as the wind limit is increased.
Installation vessel cranes will generally have operating limits above 15 m/s – see for example MPI
Offshore (2015), where all four installation vessels have crane operating limits above 20 m/s . The
operating limit discussed here is therefore imposed by the installation of the turbine components.
The turbine blades are designed to move when exposed to moderate wind speeds, and the wind
limit for installing these components is therefore restrictive in order to avoid unwanted blade
movement during the installation. Different installation strategies have different operational limits,
with the
[image:22.595.85.499.500.688.2](a) (b)
Figure 8: The duration of WTG installation operations for a vessel with a capacity of four turbines
and a wind limit of 10 m/s for the installation operation as: (a) the wind limit for the installation
installation strategy predominantly controlled by the turbine manufacturer. A full-rotor lift strategy,
where all three blades are connected to the hub onshore and the combined components are
installed in a single operation offshore, is the most restrictive with a wind limit as low as 6 m/s
(Roberts et al. 2013). A single-lift strategy, where each turbine blade is installed separately offshore,
is less restrictive with wind limits between 8-10 m/s (Roberts et al. 2013). New developments may
enable wind speeds of up to 12 m/s to be tolerated (Roberts et al. 2013). Figure 7(a) demonstrates
the potential impact on the installation duration when these different strategies are pursued, with a
reduction of over 30% by changing from a full-rotor lift strategy to a single-lift strategy, and a further
15% reduction when moving from a single-lift strategy to a new approach with 12 m/s limit.
Day-rates for WTG installation vessels can be in the region of £100k-300k, and these reductions would
therefore contribute to substantial savings to the installation process, and substantial reductions to
the lifetime cost of the OWF.
It is of interest to investigate the impact of the wind limit for the WTG installation on the total
duration of WTG installation operations under the three versions of weather data described in
Section 3.1. In Figure 8(a) the median durations found as the wind limit varies are recorded for the
synthetic weather data generated from the FINO1 historic weather data, scaled by 90%, 100% and
110%. It is clear from Figure 8(a) that the trend of decreasing duration with increasing wind limit is
found for each set of weather data. It is of interest to note that the impact of the increasing wind
limit increases as the scale of the weather conditions increases, with the 110% scaled FINO1 data
showing the largest durations as well as the largest reductions in duration.
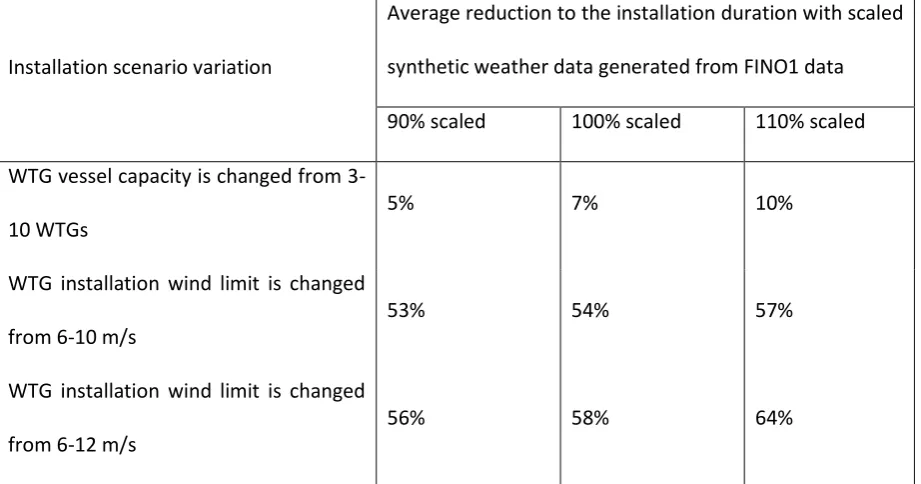
As discussed in Section 1.1, the standard mode of technological development over recent years for
WTG installation has been to increase the vessel capacity. In Figure 8(b) the impact of varying vessel
Installation scenario variation
Average reduction to the installation duration with scaled
synthetic weather data generated from FINO1 data
90% scaled 100% scaled 110% scaled
WTG vessel capacity is changed from
3-10 WTGs
5% 7% 10%
WTG installation wind limit is changed
from 6-10 m/s
53% 54% 57%
WTG installation wind limit is changed
from 6-12 m/s
56% 58% 64%
Table 1: Reductions to the WTG installation duration under three developments to the WTG
installation and three sets of weather data.
evident that changes to the installation wind limit have more impact than changes to the vessel
capacity. Closer inspection of these results is provided in Table 1.
3.3.2 The turbine jacket load-out operation
In Figure 9(a) the impact on the delays to the turbine jacket installation is displayed as the wind limit
for the jacket load-out operation is varied between 8-22 m/s. In a similar fashion to Section 3.3.1,
these delays are recorded throughout the entire installation of all 84 jackets so that any delays are
realised in the context of the complete installation process. The average number of delays recorded
decreases as the wind limit increases, with the effect reduced at higher wind limits. Additionally, the
uncertainty with respect to the number of delays recorded reduces at higher wind limits. As for the
WTG installation, the wind limits for the load-out operation are likely to be imposed based on the
safety limits for lifting of the jacket, rather than the operational limits of the cranes used. An
[image:24.595.68.529.73.315.2](a) (b)
Figure 9: Boxplots showing (a) the delays to the turbine jacket installation, and (b) the duration of
the turbine jacket installation, as the wind limit for the in-port loading operation is varied from 8-22
m/s.
where the jackets are essentially slid onto the supply barge via a purpose built track system. With a
roll-on roll-off approach there is no wind limit to the load-out, and this method is represented here
by the wind limit of 22m/s, which has been shown experimentally to produce negligible delays due
to wind conditions. Figure 9(b) demonstrates the impact on the duration of the turbine jacket
installation operation as the wind limit is varied from a crane-lift approach (approximately 8-10m/s)
to the roll-on roll-off approach. This change in practice has a substantial impact on the duration,
with an average reduction of approximately 45%. The daily cost for turbine jacket installation
includes the installation vessel day-rate as well as the day-rate for each supply barge used, and may
cost in the region of £200k-400k. Reducing the jacket installation duration by approximately 45%
would therefore potentially reduce the vessel costs by £34M-68M, depending on the associated
day-rates. Developing the track system for sliding the jackets may require developments to the load-out
port, and this expense should be factored into any cost-reductions expected through moving from a
(a) (b)
Figure 10: The duration of turbine jacket installation operations for barges with a capacity of three
jackets and a wind limit of 12 m/s for the loading operation as: (a) the wind limit for the load-out
operation is varied, and (b) the capacity of the supply barges is varied. Three sets of weather
conditions are considered, representative of the FINO1 data scaled by 90%, 100% and 110%.
In Figure 10(a) the average reduction in installation duration with different wind conditions for the
load-out operation is investigated under the three versions of weather data discussed in Section 3.1..
For each version of the scaled synthetic weather data, there is evidently a substantial reduction to
the average installation duration. Figure 10(a) indicates that the change in load-out strategy can be
expected to provide reductions to the installation duration under less severe weather conditions. As
the in-port weather conditions can be expected to be less severe than offshore weather conditions,
this analysis suggests that substantial duration reductions can still be expected through improved
wind limits to the load-out operation.
As in Section 3.3.1, it is of interest to compare the impact on installation duration with different
load-out scenarios, with the impact of different barge capacities. In Figure 10(b) the impact on the
installation duration under the three versions of scaled synthetic weather data is explored as the
Installation scenario variation
Average reduction to the installation duration with scaled
synthetic weather data generated from FINO1 data
90% scaled 100% scaled 110% scaled
Turbine jacket supply barge capacity
is changed from 2-9 jackets
9% 13% 12%
Jacket load-out wind limit is
changed from 8-22 m/s
56% 62% 70%
Table 2: Reductions to the turbine jacket installation duration under two developments to the
installation scenario and three sets of weather data.
capacity is shown to have the expected impact of reducing duration of the installation duration, as
there is less transit time required by barges and so less opportunity for delays to the installation
vessel by having no barges on-site with a load. Table 2 compares the effect of varying wind
conditions during the load-out operation with the effect of varying the capacity of the barges. It is
evident that more relaxed load-out wind limits would have substantially more impact on the
installation duration than increasing barge capacity. Furthermore, the average durations recorded
with the maximum wind limit of 22 m/s are lower than the average durations recorded with the
maximum capacity of 8 jackets under each version of the weather data: a 1% reduction with the 90%
scaled FINO1 data, a 5% reduction with the 100% scaled FINO1 data, and a 15% reduction with the
110% scaled FINO1 data.
Barlow et al. (2014) demonstrated that using three supply barges to support the turbine jacket
installation for this case study provides a favourable combination of installation duration and
installation costs, and three supply barges are therefore utilised here. Adjusting the capacity of the
barges will have an effect on their combined operation, however, and fewer barges with higher
[image:27.595.67.515.73.262.2]manner, improving the load-out capability of the supply barges reduces delays at this stage of the
installation, such that using fewer barges with more relaxed load-out wind limits may retain the
same supply-rate of jackets to the installation vessel on-site. These operational adjustments could
therefore directly impact the costs of the installation, which should be taken into consideration
when comparing these scenarios in practice.
4. Discussion and Conclusions
An analysis of the installation process for an offshore wind farm (OWF) is presented. A
discrete-event simulation tool was employed to identify the most prominent causes of weather delays during
a case-study installation. This fictional OWF is designed to be representative of the next phase of
OWF developments being carried out across Europe. Investigations revealed that the operations
most sensitive to weather delays include the installation of the turbines and the installation of the
turbine jackets. For each of these operations the limiting weather conditions were varied, and the
resulting impact on the duration of the installation was investigated. In each case it was shown that
by targeting these operations for development, the potential impact on installation duration can far
outweigh the potential reductions which could be achieved by simply employing vessels with
increased operating capacity.
This paper demonstrates the potential capability of the discrete-event simulation tool discussed
here to support innovation in the OWF installation process. By providing a realistic and detailed
understanding of the costs and duration for a given installation scenario, alternative installation
scenarios can be explored and their comparative effectiveness can be identified. The practical
impact of this capability is that a novel development to the installation process – either through
advancing technology, installation techniques, or vessel capability – can be accurately evaluated
without any financial risk. The benefits of each development can therefore be fully quantified, which
innovative developments can therefore promote the exploration of concepts perceived to be
high-risk. This will support the construction of new vessels during the design process, validate new
installation technologies and strategies prior to implementation, and can ultimately contribute to
improving the efficiency of the OWF installation process and thus reducing the levelised cost of
energy for offshore wind.
The focus here is on the impact on installation duration under different installation scenarios, which
has a direct impact on the costs of the installation through day-rates for vessels, crew and
installation technicians. In addition, an OWF developer will take into consideration the rate at which
a site is completed. As part of the extended planning and consent for an OWF development,
developers and government will reach agreement on contractual obligations to complete specific
stages of the site by specific dates. Furthermore, a site generating power generates profits, and an
OWF developer therefore has incentive to complete the installation as quickly as possible. In
practice, an optimal scenario will therefore provide a balance between direct installation costs due
to the installation duration, and financial benefits from timely completion.
A limitation of the method applied here is that a single set of weather conditions are considered in a
given simulation. As mentioned in Section 3.2.2, this results in the same weather data being
modelled onshore at the load-out ports and offshore at the OWF site. This will result in conservative
estimates of installation durations being generated. This effect could be mitigated by generating a
coupled set of weather data, where one set represents onshore conditions, one set represents
offshore conditions, and both sets are appropriately correlated to reflect the proximity of the wind
farm to shore. This will be investigated in future iterations of the model.
In parallel to the work presented here, ongoing research is developing a robust optimisation toolkit
2015). This toolkit will quickly identify optimal schedules of the installation operations which are
robust to the uncertain weather conditions, and detailed refinement of the optimal schedules can
then be achieved by employing the simulation tool (Barlow et al. 2015). Future work will explore
mechanisms to incorporate aspects of the wind farm layout into the installation tools, to provide a
holistic tool for planning OWF installations.
Acknowledgements
This study was funded through the University of Strathclyde Technology and Innovation Centre,
grant reference TIC/LCPE/FI03. The authors thank Scottish Power Renewables, SSE Renewables and
Technip Offshore Wind Limited for their contribution to this work. Additionally, the authors thank
the Bundesministerium fuer Umwelt (Federal Ministry for the Environment, Nature Conservation
and Nuclear Safety) and the Projekttraeger Juelich (project executing organisation) for climate data
from the FINO project.
References
Barlow, E., Tezcaner Öztürk D., Revie M., Akartunalı K., Day A.H., Boulougouris E. (2014). Simulation
of the offshore wind farm installation logistics problem. Technical Report, available from:
http://strathprints.strath.ac.uk/52491/, December 2014.
Barlow, E., Tezcaner Öztürk D., Day A.H., Boulougouris E., Revie M., Akartunalı K. (2015). A combined
optimisation and simulation approach for supporting logistical decisions during offshore wind farm
installations. Technical Report, available from: http://strathprints.strath.ac.uk/52493/, June 2015.
Boulougouris, E., Papanikolaou, A. (2013), Risk-based design of naval combatants, Ocean
Bundesministerium fuer Umwelt, Projekttraeger Juelich, 2012. FINO 1 Meteorological Dataset 2004 -
2012. Available from: http://fino.bsh.de
Dinwoodie, I.A., McMillan, D. (2014). Operational strategies for offshore wind turbines to mitigate
failure rate uncertainty on operational costs and revenue. Renewable Power Generation, IET, 8 (4),
359-366.
European Wind Energy Association (2013) Deep water. Available from:
http://www.ewea.org/publications/reports/deep-water/
European Wind Energy Association (2015) The European offshore wind industry -- key trends and
statistics 2014. Available from: http://www.ewea.org/statistics/offshore/
European Wind Energy Technology Platform (2014) Strategic Research Agenda/Market Deployment
Strategy. Available from:
http://www.ewea.org/publications/reports/strategic-research-agenda-market-deployment-strategy/
Gaspar, H. M., A. M. Ross, D. H. Rhodes, and S. O. Erikstad (2012), Handling Complexity
Aspects in Conceptual Ship Design, in Proceedings of the 11th International
Marine Design Conference, June, pp. 1{14.
Huisman (2013) Wind Turbine Shuttle: Huisman product brochure. Available from
http://www.huismanequipment.com/en/products/new_concepts/wind_turbine_shuttle
Ingenium (2011) Technical specification Wind Farm Installation barge. Available from:
hBVUcyMDExX1dJQiUyNTIwVGVjaG5pY2FsJTI1MjBTcGVjaWZpY2F0aW9uX3Nob3J0LnBkZg==&ext=.p
df
Lange, K., Rinne, A., Haasis, H.D. (2012). Planning maritime logistics concepts for offshore wind
farms: a newly developed decision support system. In: proceedings of the 3rd International Conference on Computational Logistics (ICCL) 2012, Shanghai, China, September 2012, Lecture Notes
in Computer Science, 7555, 142-158.
Kelton, W. D., & Law, A. M. (2000). Simulation modeling and analysis, McGraw Hill, Boston.
MPI Offshore (2015) Vessel data sheets available from:
http://www.mpi-offshore.com/about-mpi-wtivs/
Morandeau, M., Walker, R. T., Argall, R., & Nicholls-Lee, R. F. (2013). Optimisation of marine energy
installation operations. International Journal of Marine Energy, 3, 14-26.
Offshore Marine Technology (2013a) Jackson Offshore boosts PSV fleet, Offshore Marine
Technology, 2nd Quarter, 30-31.
Offshore Marine Technology (2013b) Brazilian beat goes on, Offshore Marine Technology, 2nd Quarter, 32-34.
Offshore Wind (2014a) K-Sure Provides Funds for Seajacks Scylla,
http://www.offshorewind.biz/2014/12/16/k-sure-provides-funds-for-seajacks-scylla/
Offshore Wind (2014b) GeoSea Orders New Jack-Up Vessel,
Offshore Wind (2014c) Jan De Nul’s New Cable Layer Taking Shape,
http://www.offshorewind.biz/2014/12/22/jan-de-nuls-new-cable-layer-taking-shape-gallery/
Offshore Wind (2015a) OW Installation Vessel Market to Reach Around USD 3 Bln by 2020, Report
Says,
http://www.offshorewind.biz/2015/01/08/ow-installation-vessel-market-to-reach-around-usd-3-bln-by-2020-report-says/
Offshore Wind (2015b) Damen Delivers Cable Laying Vessel to Van Oord,
http://www.offshorewind.biz/2015/01/09/damen-delivers-cable-laying-vessel-to-van-oord/
Offshore Wind (2015c) DEME Orders New Multi-Purpose Vessel,
http://www.offshorewind.biz/2015/01/16/deme-orders-new-multi-purpose-vessel/
Offshore Wind Cost Reduction Task Force (2012). Offshore wind cost reduction task force report.
Available from: https://www.gov.uk/government/groups/offshore-wind-cost-reduction-task-force
Ove Arup & Partners Ltd (2011). Review of the generation costs and deployment potential of
renewable electricity technologies in the UK. Available from:
https://www.gov.uk/government/publications/review-of-the-generation-costs-and-deployment-potential-of-renewable-electricity-technologies-in-the-uk-study-report-by-arup
Perveen, R., Kishor, N., Mohanty, S.R. (2014). Off-shore wind farm development: present status and
Renewable UK (2014) Offshore wind project timelines. Available from:
http://www.renewableuk.com/en/publications/reports.cfm
Roberts A, Weston J, Valpy B (2013) Offshore Wind: A 2013 supply chain health check;
A report prepared by BVG Associates for The Crown Estate. Available from
http://www.thecrownestate.co.uk/energy-and-infrastructure/offshore-wind-energy/working-with-us/strategic-workstreams/supply-chain-and-skills/
Tezcaner Öztürk D., Barlow E., Akartunalı K., Revie M., Day A.H., Boulougouris E., ‘A robust rolling
horizon optimisation model for offshore wind farm installation logistics’. Technical Report, available
from: http://strathprints.strath.ac.uk/52586/, May 2015.
Ulstein (2013) Windlifter: Single Lift Wind Turbine Installation Vessel. Available from:
http://www.ulstein.com/Kunder/ulstein/cms66.nsf/pages/HoaareMenaaDESIGNSOLUTIONSHEAVaa OFFSHOREVESSELS.html?open&product=07aef8341925c921c12576b700472798&info=07AEF834192 5C921C12576B700472798&fil=/kunder/ulstein/mm.nsf/lupGraphics/wind%20turbines.jpg/$file/win
d%20turbines.jpg
Walker, R.T., Sewell, B.J., Morandeau, M., Boswell, A. (2013). Quantifying and reducing installation