Organic Semiconductor Laser Biosensor:
Design and Performance Discussion
Anne-Marie Haughey, Glenn McConnell, Benoit Guilhabert, Glenn A. Burley, Martin D. Dawson, Fellow, IEEE,
and Nicolas Laurand, Member, IEEE
Abstract—Organic distributed feedback lasers can detect nanoscale materials, and are, therefore, an attractive sensing plat-form for biological and medical applications. In this paper, we present a model for optimizing such laser sensors, and discuss the advantages of using an organic semiconductor as the laser material in comparison to dyes in a matrix. The structure of the sensor and its operation principle are described. Bulk and surface sensing ex-perimental data using oligofluorene truxene macromolecules and a conjugated polymer for the gain region are shown to correspond to modeled values and is used to assess the biosensing attributes of the sensor. A comparison between organic semiconductor and dye-doped laser sensitivity is made and analyzed theoretically. Finally, experimental and theoretical specific biosensing data are provided, and methods for improving sensitivity are discussed.
Index Terms—Distributed feedback devices, biophotonics, organic semiconductors.
I. INTRODUCTION
S
TRATIFIED medicine is a 21st century concept aimed at enabling clinicians to tailor treatment for individual groups of patients through the use of biological markers (biomarkers) [1]. This approach requires sensitive and compact platforms for point-of-care biomarker detection that are simple to implement and operate and provide rapid results. Multiplexed detection in a single test is also desirable as diagnosis will rarely be depen-dent on one biomarker. Organic semiconductor (OS) distributed-feedback (DFB) lasers, functionalized for surface sensing, have the potential to meet this need.Organic DFB laser sensors are evanescent wave sensors that can enable label-free optical biomarker detection. They can be fabricated with low-cost techniques via the nanopatterning of a thin-film of gain material. Specific biomarker detection is achieved by functionalizing the surface of the gain material with probe molecules that specifically bind to an analyte. Upon analyte binding, a change in refractive index at the laser surface results in a change in the effective refractive index of the laser mode and in turn induces a shift in the emission wavelength,
Manuscript received March 31, 2015; revised June 12, 2015; accepted June 16, 2015. This work was supported by the EPSRC (EP/J021962/1 and EP/I029141/1).
A.-M. Haughey, G. McConnell, B. Guilhabert, M. D. Dawson, and N. Laurand are with the Institute of Photonics, University of Strathclyde, Glasgow G4 0NW, U.K. (e-mail: [email protected]; glennmcco@ gmail.com; [email protected]; [email protected]; nicolas. [email protected]).
G. A. Burley is with the Department of Pure and Applied Chemistry, Univer-sity of Strathclyde, Glasgow G1 1XL, U.K. (e-mail: [email protected]). Color versions of one or more of the figures in this paper are available online at http://ieeexplore.ieee.org.
Digital Object Identifier 10.1109/JSTQE.2015.2448058
as explained in Section II-B. This change in wavelength can be monitored for sensing.
Evanescent wave optical detection is the basis of several com-mercial technologies often seen as the “gold standard” for biode-tection, but the miniaturization of precise, bulky optical systems for injection and collection of the light into and from the trans-ducer is difficult. The integration of organic lasers into a sensing platform, that can be remotely excited with non-critical align-ment, can help alleviate this miniaturization problem, making them ideal transducers for compact point-of-care diagnostics. Furthermore, label-free detection using evanescent waves usu-ally necessitates a trade-off between resolution and sensitivity. The trade-off arises because the detection of small refractive index perturbations is dependent on monitoring changes in an optical resonance [2]. The limit of detection of the system is linked to the magnitude of the resonance shift for a given re-fractive index change (the sensitivity) and is limited by the in-herent bandwidth of the resonance (the resolution). To optimize the limit of detection of an evanescent wave based system, the magnitude of the resonance shift must be maximized while si-multaneously minimizing the resonance bandwidth. Doing both concurrently is a non-trivial task but can be achieved with a DFB laser because, in this case, the resonance is the coherent output of the laser, which is characterized by a narrow linewidth for single mode oscillation. Finally, organic DFB lasers can be excited optically at any position within their surface to gener-ate coherent emission normal to the laser structure, resulting in simple implementation while maintaining sensitivity. The flexi-bility to excite the DFB laser surface at any point also raises the prospect for multiplexed detection.
The first reports of organic DFB lasers for biosensing uti-lized gain material that incorporated dyes at low density into a polymeric matrix [3]. Recently, we expanded the concept to the use of a neat OS gain region [4]. OS materials have higher refractive indices (from 1.6 to above 2) than dye-doped mate-rials. The dye concentration in a polymer host must be kept relatively low (≈10%) to prevent fluorescence quenching and the refractive index of the transparent polymer host is typically around or below 1.5 [3]. We predict that the use of a higher in-dex semiconductor gain layer, which takes the form of a dense thin-film, will result in improved surface sensing capabilities due to an increase in the strength of the laser mode intensity at the laser surface (where the biodetection region is situated). Another advantage of an OS gain layer is the potential for lower lasing thresholds, opening up the possibility for diode pumping with either InGaN laser diodes or LEDs and would therefore support miniaturization [5], [6].
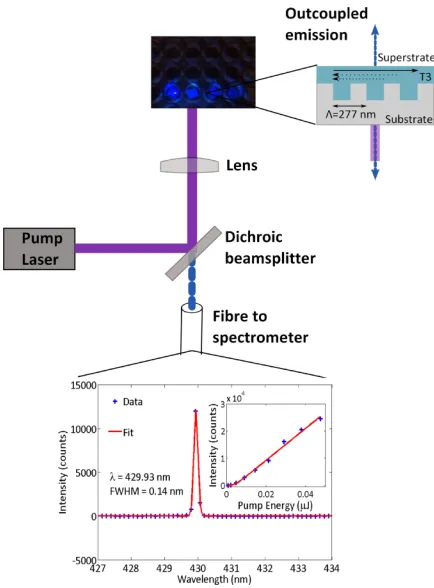
Fig. 1. Schematic representing the implementation of the organic laser sensor. Photograph shows T3 lasers in wells under UV illumination. An example of a typical T3 emission spectra with the laser exposed to air, and a typical lasing threshold is also shown.
In this paper, we study theoretically and experimentally the sensitivity advantage of using a high index OS as the gain region of a DFB laser sensor. We describe a model for the design of fu-ture OS DFB laser sensors that enables the biomarker detection sensitivity to be determined and maximized through optimiza-tion of the device structure. We expand upon previous models by including the effect of refractive index dispersions of the sub-strate and of the OS. And we investigate the interaction of the laser mode with the biodetection region at the sensor surface. We also discuss potential sensitivity benefits of using an OS as the laser gain material in comparison to other organic mate-rials. Oligofluorene truxene macromolecules and a conjugated polymer are the OS gain materials used for the experimental data presented in this paper although properties discussed can be extended to other OS gain materials.
II. DESIGN, METHODS ANDMODELING
A. Device Fabrication and Optical Set-Up
A schematic of an OS (here oligofluorene truxene, (T3) [7]), second order DFB laser is shown in Fig. 1. The device consists of a UV-curable optical epoxy substrate (Norland 65, Norland Products), nano-patterned with a diffraction grating having a period (Λ) of 277 nm and a modulation depth of≈50 nm and a thin (≈70 nm), dense T3 film. The refractive indices of the substrate and T3 are 1.54 and 1.81 at a wavelength of 430 nm,
respectively. When a conjugated polymer (BBEHP-PPV [8]) is used as the gain material, DFB lasers had a period of 350 nm, a gain layer thickness of 220–250 nm and a refractive index of 1.64 at a wavelength of 540 nm. As mentioned previously, OS gain materials have a higher refractive index than dye-doped gain materials which leads to greater confinement of the electric field within the gain layer, a greater overlap with the detection region at the laser surface and ultimately higher light matter interactions. Therefore, by utilizing an OS as the gain mate-rial rather than a dye-doped polymer, there is the potential to both match, if not improve upon, the sensitivity and resolution values and enhance the overall sensor performance. The lasing threshold of OS DFB lasers tends to be lower than those of dye-doped lasers [4], [9]. A lower lasing threshold makes pumping with compact light sources, such as gallium nitride based laser diodes, a possibility [6]. Laser diode based pumping will en-able the miniaturization of the DFB laser sensing system and if off-the-shelf components can be used, such as mass produced “Blu-ray” diodes, it should also enable the technology to be competitively priced.
The laser fabrication process have previously been described elsewhere [4] but are summarized here. The OS layer, which acts as the gain region, is deposited onto the nano-patterned substrate by spin-coating from a toluene solution. The spin-coating speed can be used to tune the thickness of the gain layer which has implications for the device performance. To ensure reproducible and uniform gain layers were achieved through spin coating, a large volume of OS solution was deposited relative to the surface area of the substrate; the surface area of the substrate was dependent on what vessel the laser was used with (see below). By using a solution volume in excess of that required to form the film, and ensuring that the substrate was flat (it was taped to a piece of glass), a constant gain layer thickness was produced and any excess solution was removed from the surface. Several different vessels were used to house the DFB lasers and test solutions for the experimental work, including a large quartz cuvette (Starna), a custom made demountable quartz cuvette (Comar) and a 24 well microtiter plate (TPP). When using the large cuvette or the 24 well plates, lasers were fixed in place using tape (Kapton). When the demountable cuvette was used, the grating imprinted epoxy was fixed to the flat face of the cuvette using optical epoxy (Norland 65) and cured for≈2 min before spin-coating the gain layer as described in [4].
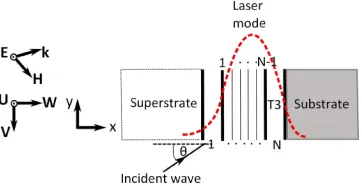
Fig. 2. Multilayer stack of N thin films bounded by semi-infinite substrate and superstrate layers. The laser mode intensity profile is also represented. Here we take T3 as an example but other gain material would be equally valid.
emission with the same optical fiber/spectrometer mentioned previously.
B. Theoretical Model
The out-coupled laser emission for a DFB laser is described by the Bragg equation, Eq. (1), where m is the order of diffraction (m=2 for vertically emitting DFB lasers),λis the wavelength of the DFB laser, neff is the effective refractive index of the laser
mode andΛis the grating period as previously defined
mλ= 2neffΛ. (1)
The effective refractive index for the device, which defines the laser emission wavelength, is dependent on the refractive indices of the substrate and superstrate materials, any material bounded by the substrate and superstrate and the thickness of this bounded region. Changes in any of these parameters results in a shift in the emission wavelength of the laser, therefore, changes in the emission wavelength can be used to sense bulk refractive index changes in the superstrate or to detect the immobilization of analytes at the laser surface. A multilayer transfer matrix model of a DFB laser can be adapted for numerical evaluation of the effective refractive indices of the laser modes, the expected wavelength shifts for both bulk and surface refractive index sensing, and the mode profile, and was used for the evaluation of our lasers. A full mathematical description of the model is described elsewhere [10] but a brief summary of the key details are provided here in the context of a DFB laser.
The DFB laser structure is represented in Fig. 2. A laser mode can be approximated as a waveguide mode of this multilayered structure oscillating at the frequency of maximum gain provided by the laser material. The laser gain layer and any other layers adjacent to the gain layer (with layer 1 being the topmost layer adjacent to the superstrate and layer N being the T3 layer) are enclosed between semi-infinite superstrate and substrate layers. The boundaries between layers 1 to N are numbered 1 to N−1. The direction cosines are given byα=ncosθ= (n2−β2)1/2 andβ=nsinθas indicated in Fig. 2, and whereβis the prop-agation constant. Properly designed DFB lasers oscillate on the fundamental TE0 mode and therefore the model is designed to
solve for the TE0mode only, although it can equally be applied
to other modes, including TM modes. The plane of incidence is the xy plane and the interfaces between the layers of the DFB laser are parallel to the yz plane. Therefore, the only material
variation for the stack of layers occurs in the x-direction, as shown in Fig. 2. For a TE wave,ExandEy, and thereforeHz, are equal to zero andEz,Hy andHxare given by
Ez = U(x)ei(k β y−ω t) (2a)
Hy = V(x)ei(k β y−ω t) (2b)
Hx = W(x)ei(k β y−ω t). (2c) The relationship between the transverse amplitudes of the field components,U(x)andV(x), is given by Eq. (3a), (3b), whereγ(γ= ncosθz0 ) can be defined asγ= cμα in non-magnetic media, where c is the speed of light and μ is the magnetic permeability. At the boundary between two adjacent layers the tangential components of the electric and magnetic fields (U
andV) are continuous andW, the amplitude of the component normal to the boundary between the layers, is proportional to
U. The total field can therefore be specified using the pair of simultaneous equations forU andV given in
dU dx =
ikα
γ V (3a) dV
dx = ikγαU. (3b)
The knowledge ofUandV at any boundary of the multilayer is sufficient to describe the entire transverse field using a transfer matrixM. The particular components of matrix M for the stack of N layers between positionxn andxn−1 are given by matrix
Mn in Eq. (4) whereΦis the phase thickness of the layer and and is given byΦn =kαn(xn−xn−1).
Mn =
cosΦn −γnisinΦn −iγnsinΦn cosΦn
. (4) Each of the N layers of the multilayer stack is described by a matrix resembling Eq. (4). The transfer matrix (M) combining all of the N layers is given by the product of each of the matrices for the respective individual layers,
M=
N
n= 1
Mn =
m11 m12
m21 m22
. (5) Eq. (5) enables the determination of the guided modes, i.e. the waves that are guided inside the multilayer structure in the y-direction. In the DFB laser model presented here, the lowest order waveguided modes represent the laser mode (it overlaps the gain region, propagates in the y-direction and interacts with the grating resulting in the feedback required for laser emission). A wave propagating within the stack of N layers, as depicted in Fig. 2, is confined between the substrate and superstrate layers by total internal reflection. For waveguided fields, M must relate the field at the boundary between the superstrate and the layer N=1 to the field at the boundary between the T3 layer and the substrate. Therefore the fields at the stack boundaries are required to satisfy Eq. (6), where the subscripts sub andsup
represent the substrate and superstrate, respectively,
Usup
Vsup
=M
Usub
Vsub
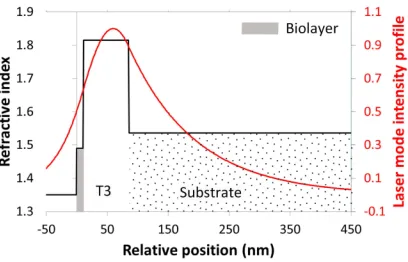
Fig. 3. Laser mode intensity profile for a T3 laser with a 10 nm thick biolayer at the surface.
As the laser modes guided within the DFB laser are bound be-tween the semi-infinite substrate and superstrate layers, the field is evanescent in both the superstrate and the substrate, as shown in Fig. 2. It is this evanescent part of the mode that is used to probe the region close to the laser surface for sensing. The waves are negative-going in the substrate and positive-going in the su-perstrate (radiation condition) such that U=Usupe(−ik αs u px)
and U =Usube(ik αs u b(x−xs u b)), respectively. For waveguided
modesαsup andαsubare imaginary.
Solving Eq. (6) for positive and negative traveling waves results in the modal-dispersion function (χ(β)) for bound modes,
χ(β) =γsupm11+γsupγsubm12+m21+γsubm22 = 0.
(7) Eq. (7) can be solved numerically forβ, which is equivalent to the effective refractive index of the laser mode in the case of the DFB laser described in Fig. 2. Each solution of Eq. (7) corresponds to a waveguided mode, with the highest solution representing the lowest order waveguided mode for multilayer DFB lasers.
Once the effective refractive index of the TE0mode is found,
the field distribution throughout the DFB laser structure and the stack of N layers can be traced. To do this, one of the field amplitudes may be arbitrarily chosen at one point and Eq. (8) can be used to calculate the field amplitudes at other points of the structure relative to the initial chosen amplitude
Un−1
Vn−1
=Mn
Un
Vn
. (8) Knowing the amplitudes at each of the layer interfaces, the mode profile,E(x), is calculated through the DFB laser struc-ture and the N layers, whereU(x) =E(x), for the TE mode. The resulting mode profile can be plotted against the refractive index of the structure and stack of layers, as shown in the ex-ample in Fig. 3, where a T3 DFB laser (n=1.81) is represented with a 10 nm biolayer (n=1.49) on the T3 surface.
The laser mode field intensity is proportional to the square of the field amplitude and the contribution to the field for a particular layer can be found using Eq. (9). Eq. (9) is an example of the calculation of the laser mode intensity overlap (Γbio) with
a biomolecule layer on the laser surface, that extends from x=0
to x=10 nm (for a 10-nm thick layer)
Γbio =
10
0 |E(x)| 2
dx
+∞
−∞ |E(x)|2dx
. (9)
In this paper, the laser modes are modeled for the DFB laser in response to a number of different scenarios. The shift in laser wavelength due to changes in bulk refractive index are modeled by varying the refractive index of the semi-infinite superstrate layer. For a T3 laser, the semi-infinite substrate layer had a re-fractive index of approximately 1.52 and a gain layer index of approximately 1.81 (1.64 for BBEHP-PPV) and a thickness ap-proximated by averaging over the grating period to account for the effect of the periodic modulation of the gain layer thickness. When modeling the response of the laser to the adsorption of nanolayers at the DFB laser surface, the index and thickness of the layers were set. For the build-up of polyelectrolyte layers, Section III-B, the refractive index is defined as 1.5 and the layer thickness increased from 1 nm up to a constant thickness of 5 nm for the sixth deposited layer. The superstrate index is defined as the buffer index which was generally 1.35. For mod-eling the 10 nm biolayer, Section III-B, the index of the layer varied between 1.35 and 1.5, which is the expected index range of biological material [11]. When the response of a dye-doped DFB laser to the adsorption of a 10 nm biolayer was mod-eled, the gain layer was defined to have an average thickness of 400 nm, index of 1.52 and a semi-infinite substrate of 1.47 [12]. The addition of a high index cladding layer was also modeled for both a dye-doped and a T3 DFB laser, in section III-C. For these, the TiO2 index was defined as 2.45 [12] and the thickness was
varied from 0 to 60 nm. When modeling the specific detection of avidin with a biotin functionalized laser, Section III-D, the following layer parameters were used during modeling: index of 1.46 and a buffer superstrate of 1.35. Specific avidin detection was also modeled for a T3 laser as above but also including a 20 nm TiO2layer (index of 2.45).
III. RESULTS ANDDISCUSSION
A. Laser Characteristics
Fig. 1 provides an example of laser emission from a T3 DFB laser exposed to air; T3 lasers typically have an emission wave-length of around 430 nm and the linewidth is below the reso-lution of the spectrometer (0.13 nm). The central wavelength and linewidth were determined from a Gaussian fit to the data. The inset in Fig. 1 shows the laser threshold for a laser exposed to air, which is currently 2.5 nJ (fluence of 60 μJ/cm2). The
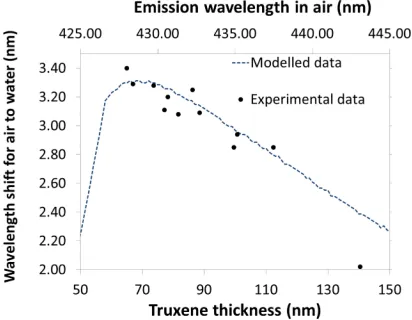
Fig. 4. The shift in wavelength and emission wavelength in air for lasers fabricated with a range of T3 thicknesses are plotted. Theoretical thickness, emission wavelength and wavelength shifts are also plotted.
B. Bulk Sensing and Nanolayer Detection—Model Validation
As mentioned previously, the thickness of the region between the laser substrate and superstrate influences the effective refrac-tive index of the laser and, subsequently, the laser wavelength and sensitivity. Sensitivity can be defined as the shift in wave-length (Δλ) per refractive index change (Δn) for bulk refractive index sensing. Therefore, it is necessary to optimize the thick-ness of the gain layer in order to achieve the maximum shift in wavelength for changes to the superstrate index. A minimum gain layer thickness (expected to be in the region of 60–80 nm for a T3 DFB laser) is required in order to support the laser mode but beyond this minimum “cut-off” thickness, a thinner gain layer results in a greater shift in emission wavelength per refractive index unit (RIU) change to the superstrate refractive index. Device sensitivity was investigated by performing bulk sensing measurements with T3 lasers with a range of gain layer thicknesses (≈65–140 nm). For bulk sensitivity measurements, lasers were immersed in de-ionised (DI) water (n=≈1.34 at 430 nm). The laser wavelengths in air and the shift in wave-length upon immersion in DI water for each of the lasers are shown in Fig. 4.
The shift in wavelength versus T3 thickness/emission wave-length in air was modeled and is also plotted in Fig. 4. The experimental data reveals that the largest shift in wavelength upon exposure of the laser to DI water occurred for the lasers with the shortest emission wavelengths, which corresponds to lasers with a thinner T3 layer. Incidentally, our model predicts that the largest overlap of the TE0 mode with the superstrate
occurs for a gain layer thickness of 76 nm (13.2% when the superstrate is water), resulting in the maximum shift in wave-length observed for a T3 layer of this thickness. The theoretical wavelength versus shift in wavelength plot replicated the exper-imental data. The model predicts a maximum shift of 3.25 nm for a refractive index change corresponding to the air to water transition, as shown in the plateau region of the plot in Fig. 4. And the model predicts that this maximum response to refrac-tive index changes occurs for a T3 layer thickness of 65–75
nm. The drop-off in wavelength shift for a gain layer thickness below 60 nm is due to the fact that a minimum gain layer thick-ness is required in order to support the guided modes, as men-tioned previously. The T3 layer thickness was measured using atomic force microscopy; when T3 is spin-coated at a speed of 3.2 krpm the mean thickness of the T3 layer deposited onto a glass cover-slip was 71 ±9 nm. We expect that the thick-ness of this layer may differ slightly with the T3 spin-coated onto the epoxy substrate as opposed to glass, but as the mean wavelength shift of lasers fabricated at a speed of 3.2 krpm has been measured to be 3.33 ±0.07 nm upon immersion in DI water, we are confident that the average T3 layer thickness is within the maximum plateau region predicted by the model. The good agreement between the experimental and theoretical results indicates that the model can be used to replicate experi-mental results and investigate design changes to the DFB laser structure for sensitivity optimization.
Further testing of the model was performed by comparing modeled and experimental bulk solutions with varying refrac-tive indices and surface sensing, via adsorption of an analyte. The wavelength shift for changing superstrate index was mea-sured by immersing the laser in solutions with a range of re-fractive indices, shown in Fig. 5. Data is presented for T3 and BBEHP-PPV lasers to demonstrate the effect of the gain layer index on sensitivity. For both T3 and BBEHP-PPV lasers, the redshift in wavelength across all solutions is approximately lin-ear and corresponds to a bulk refractive index sensitivity of 23 and 21 nm/RIU, respectively. The modeled wavelength shifts for increasing refractive index are also shown in Fig. 5(a) and (b). The model overestimates the bulk sensitivity slightly relative to the experimental data. This is most likely down to small varia-tions between the actual solution refractive index and the stated values which are estimates adjusted to take into account the laser emission wavelength (430 nm for a T3 laser, 540 nm for BBEHP-PPV laser). While the bulk sensitivity of our T3 laser currently falls short of that reported for optimized dye-doped DFB lasers (≈100 nm/RIU ) [14], the improvement for these lasers can be attributed to two structural features. The first being that dye-doped lasers for biosensing applications tend to operate at longer wavelengths and therefore have a higher grating period value, resulting in a greater wavelength shift for bulk superstrate index changes. The second, and more significant, design feature is the inclusion of a high index TiO2 cladding layer deposited
on top of the gain layer during fabrication [14]. This additional layer compensates for the relatively low index contrast between the dye-doped material and the superstrate; without this addi-tional layer the bulk sensitivity for a dye-doped laser has been reported as 17 nm/RIU [9]. A fairer comparison between the dye-doped and OS lasers is to take the ratio of the shift in wavelength (Δλ) per RIU to the emission wavelength (λ). The ratio is 3.4% for a dye-doped laser, 3.9% for BBEHP-PPV and 5.1% for a T3 laser, indicating the improved sensitivity as the gain layer index increases. The inclusion of a TiO2 cladding
Fig. 5. Experimental and modeled data showing the response of the laser to bulk superstrate refractive index changes (a) T3 and (b) BBEHP-PPV, and (c) detection of nanometer layers of polyelectrolyte to the sensor surface, ex-perimental and modeled data.
sensitivity for biomarker detection. The implications of adding a TiO2layer are discussed in more detail in Section III-C where
we also demonstrate the potential improvement in sensitivity for a T3 laser with a TiO2cladding layer. The refractive index range
that can be measured with a DFB laser depends on device pa-rameters. In principle, the laser can measure refractive indices from that of vacuum up to the value of the gain material. As expected, the closer you get to the cut-off frequency (i.e., when nsup is equal or above the refractive index of the gain material
there are no waveguided modes), the higher the bulk sensitivity as the mode overlap is greater in the superstrate.
Bulk sensitivity is a metric often used to compare the per-formance of optical sensors and it is a useful means for
com-paring laser sensors with similar resonant wavelengths. How-ever, it should be kept in mind that in biosensing applications, the analyte binding occurs at the sensors surface therefore, the laser wavelength does not have a significant effect on sensi-tivity unlike in the case of bulk refractive index sensing [15]. To investigate the surface sensing capability of our laser we employed the layer-by-layer adsorption of cationic Poly (al-lylamine hydrochloride) (PAH) and anionic Poly (sodium 4-styrenesulfonate) (PSS) nano-layers, results shown in Fig. 5(c). For this investigation the T3 DFB laser was immersed in al-ternating PSS/PAH (5 mg/mL in 0.9 M NaCl, pH 7) solutions for 5 min before rinsing with 0.9 M NaCl and recording the emission wavelength attributed to the addition of the PSS/PAH layer. PSS/PAH are known to form self-limiting monolayers; the layers deposited initially are expected to be thinner than subsequent layers, with the layer thickness increasing until a maximum thickness of≈5 nm is reached around the sixth layer [16]. The PSS/PAH monolayers are expected to have a refractive index of 1.5 at 430 nm. The wavelength shift of the increasing polyelectrolyte stack was also modeled, shown in Fig. 5(c), as-suming a buffer index of 1.35 and increasing layer thickness up to 5 nm for the first six layers and a constant 5 nm layer thick-ness for all remaining layers. The addition of each nano-layer corresponds to a shift in emission wavelength demonstrating the potential of our DFB laser for surface sensing applications. Sur-face sensing is demonstrated up to a stack thickness of≈70 nm and there is the potential to detect additional layers beyond this thickness as the magnitude of the shift in wavelength for the final layer added was 0.18 nm which is well beyond the de-tection limit of our system (currently 0.06 nm, limited by the resolution of our spectrometer). After the first six layers the shift in wavelength is roughly linear up to the 17th layer. The slope of the wavelength shift per nm of adsorbed material is 3.8% as indicated in the inset in Fig. 5(c). This indicates that the DFB laser can detect thicknesses of adsorbed material from the nanometer scale up to several tens of nanometers. A shift of 0.06 nm, the detection limit for our system, corresponds to a nanolayer thickness of<2 nm. A “size” of 2 nm corresponds to proteins with a molecular weight of≈5 kDa [17] indicating that our laser has the potential to detect biomarkers of this size, and larger, which includes many relevant biomarkers.
Fig. 6. (a) Modeled shift in wavelength for thin biolayer adsorption to T3 and typical dye-doped DFB laser. (b) Laser mode intensity profile and device structure for a T3 and (c) a dye-doped laser.
this range was investigated, shown in Fig. 6. Fig. 6 demon-strates that for each bio-layer thickness simulated, the shift in wavelength is greater for the T3 laser than the corresponding dye-doped laser by≈3.5 times.
[image:7.594.315.536.62.351.2]The greater wavelength shift is due to the higher index of the OS gain layer. This leads to a greater overlap of the laser mode with the biomolecule detection region for the T3 laser, as shown in Fig. 6(b) and (c). For example, for a 10 nm nanolayer, the T3 laser mode overlap with this nanolayer is 21%. For the dye-doped laser with the same nano-layer the overlap is only 6%. Therefore, the higher index T3 gain layer results in greater interaction of the laser mode with the biomolecule detection region and leads to a larger shift in emission wavelength upon addition of such a nano-layer at the laser surface. For purely solution processed DFB lasers, the use of a neat, high index
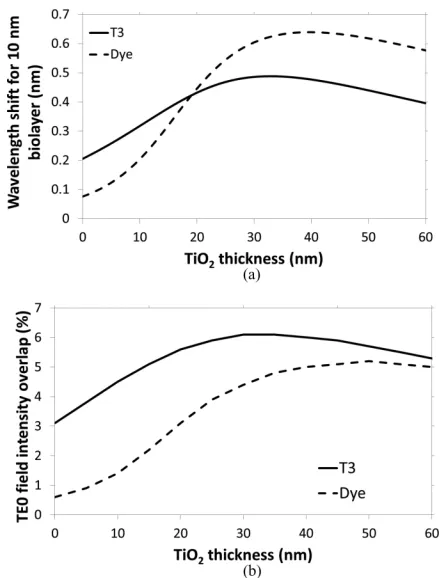
Fig. 7. (a) Modeled shift in wavelength for adsorption of the 10 nm biolayer to the surface of a T3 and a dye-doped laser for a range of different TiO2cladding
layer thicknesses, and (b) the modeled laser mode profile intensity overlap with a 10 nm biolayer for a T3 and dye-doped laser for a range of TiO2 thicknesses.
OS gain material results in improved sensitivity relative to the equivalent dye-doped DFB laser. The improvement in bulk sen-sitivity for dye-doped DFB lasers upon the addition of a TiO2
cladding layer is so marked, as mentioned previously, because of the relatively low index contrast between the dye-doped gain layer (n=1.52) and typical biological solutions (n=1.35–1.5). The inclusion of a TiO2cladding layer will not result in as large
an increase in sensitivity for a T3 layer but is still expected to provide a significant boost to the sensitivity of the T3 DFB laser.
C. Inclusion of a High Index Cladding Layer
A high index TiO2 cladding layer can be deposited to the
surface of the gain material via evaporated ion beam deposi-tion [12] amongst other methods. While this addideposi-tional fabrica-tion step does lead to a more complex fabricafabrica-tion process, the improvement in surface sensing performance may offset this shortcoming. The effect of adding a TiO2 cladding layer to the
T3 layer was investigated using our model. The shift in wave-length for the addition of a thin (10 nm) bio-layer (n=1.4) in a reference buffer (n=1.35) was modeled for a range of TiO2
thicknesses, shown in Fig. 7(a). The shift in wavelength for the addition of the 10 nm bio-layer, with no TiO2 cladding layer,
corresponds to a shift in wavelength of 0.21 nm for a T3 layer and 0.08 nm for a dye-doped laser. The magnitude of the shift in wavelength increases up to a maximum of 0.49 nm for a TiO2
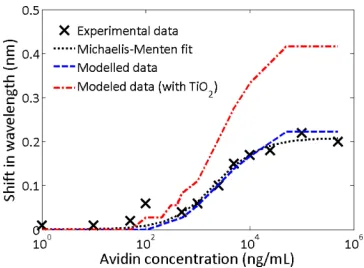
Fig. 8. Experimental and modeled data for the specific detection of avidin on a biotin functionalized T3 laser.
T3 and dye-doped laser respectively. Up to a TiO2 thickness of
20 nm, the surface sensing response of the T3 laser is greater than that of the dye-doped laser. This is due to the increased overlap of the resonating mode with the biomolecule detection region, as shown in Fig. 7(b). Although the overlap of the laser mode within the biolayer remains higher for a T3 laser than that of the dye-doped laser up to a TiO2 thickness of 60 nm, the
influence of the total structure effective refractive index results in this increased overlap translating to an improved sensitivity, relative to that of the dye-doped laser, only up to a TiO2
thick-ness of 20 nm [12]. A thin layer of TiO2may be preferable for a
number of reasons. Device cost is one consideration, with lower cost being associated with a thinner TiO2layer but more
impor-tantly, a thicker TiO2 layer may increase lasing threshold. The
lasing threshold is dependent on the overlap of the laser mode with the gain layer with a greater overlap resulting in a lower las-ing threshold. Previous studies of dye-doped DFB lasers reports that the gain layer overlap for TE modes decreases for a TiO2
thickness greater than 20 nm [12]. Therefore, a TiO2 thickness
<20 nm may be preferable to balance the increase in surface sensing sensitivity without compromising laser threshold.
D. Specific Biosensing
For biosensing applications, specific detection of molecules requires functionalization of the laser surface with probes. To demonstrate proof-of-principle specific biosensing, we func-tionalized the T3 laser surface with biotin for the detection of avidin, shown in Fig. 8. To determine the avidin limit of detection, repeated measurements (4×) of avidin binding (10μg·mL−1) were performed on different lasers. The standard deviation of the wavelength shift attributed to avidin binding of these independent measurements was 0.02 nm. A shift in wave-length is deemed to be “detectable” if it has a magnitude of three times the standard deviation [18]. Therefore, the minimum level of avidin detection is defined as the avidin concentration result-ing in a shift in wavelength≥0.06 nm. The limit of detection corresponded to an avidin concentration of≈1μg/mL, which is expected to represent a sparse layer of avidin based on the size of avidin (molecular weight of 67 kDa [19]) and the size of the shift expected, as discussed previously. Saturation of all
of the biotin binding sites occurs for a concentration around 100μg/mL, as shown by the plateau in wavelength shift values. Experimental data was fitted to the Michaelis–Menten equa-tion, which can be used to describe molecular binding kinetics [20]. Our multilayer slab waveguide was also modified to take into account the change in refractive index of the avidin bio-layer deposited for each concentration. In brief, the deposited avidin molecule/buffer layer volume fraction was assumed to follow a Langmuir relationship and the refractive index was estimated by minimizing the effective medium approximation, shown in Eq. (10), where prepresents the fraction of bound target biomolecules and is unity when the biolayer consists only of biomolecules andn1 andn2are the refractive indices of the
buffer and avidin molecules [21]
(1−p).n1−1 n1+ 2
+p .n2−1 n2+ 2
= 0. (10)
The modeled data closely follows the Michaelis–Menten fit and estimates an avidin limit of detection of ≈1 μg/mL. In order to demonstrate the improvement in avidin detection with the presence of a TiO2 layer, the response to avidin detection
was modeled in the presence of a 20 nm TiO2 layer, shown
in Fig. 8. Here the limit of detection reduced by two thirds to around 300 ng/mL. It should be noted that at this stage there was no attempt to optimize the binding kinetics of the biotin and avidin interaction. Optimization of factors such as the buffer and pH may influence the limit of detection and may be investigated in future.
IV. CONCLUSION
In conclusion, we hypothesized that a DFB laser sensor with a neat OS gain layer would enable higher surface sensing sen-sitivity relative to a DFB laser with a lower index dye-doped gain layer. We have demonstrated optimization of the gain layer thickness for our T3 laser to maximize sensitivity and the agree-ment between our multilayer model with experiagree-mental sensing results. The bulk sensing results for a T3 DFB laser were com-pared to those of a DFB laser with a conjugated polymer of lower refractive index. The ratio of the shift in wavelength per RIU to the emission wavelength was 3.9% for a BBEHP-PPV DFB laser and 5.1% for the equivalent T3 laser, indicating improved sensitivity for the higher index T3 laser. We also showed that the overlap of the laser mode with the biomolecule detection region is greater for a T3 laser than for a dye-doped laser, resulting in improved sensitivity for surface sensing. Furthermore, modeled results suggest the addition of a thin, high index cladding ma-terial, such as TiO2, to the T3 surface results in an increased
sensitivity for surface sensing relative to that of a dye-doped laser, up to a TiO2thickness of 20 nm.
ACKNOWLEDGMENT
REFERENCES
[1] M. R. Trusheim, E. R. Berndt, and F. L. Douglas, “Stratified medicine: Strategic and economic implications of combining drugs and clinical biomarkers,” Nature Rev. Drug Discov., vol. 6, no. 4, pp. 287–293, 2007. [2] M. Kristensen et al., “Photonic crystal biosensor chip for label-free detec-tion of bacteria,” presented at the Optical Sensors Conf., Optical Society America, Toronto, Canada, 2011, Paper SWB1.
[3] M. Lu, S. S. Choi, C. J. Wagner, J. G. Eden, and B. T. Cunningham, “Label free biosensor incorporating a replica-molded, vertically emitting distributed feedback laser,” Appl. Phys. Lett., vol. 92, no. 26, art. no. 261502, 2008.
[4] A.-M. Haughey et al., “An organic semiconductor laser based on star-shaped truxene-core oligomers for refractive index sensing,” Sens. Actua-tors B, Chem., vol. 185, pp. 132–139, 2013.
[5] Y. Yang, G. A. Turnbull, and I. D. W. Samuel, “Hybrid optoelectronics: A polymer laser pumped by a nitride light-emitting diode,” Appl. Phys. Lett., vol. 92, no. 16, art. no. 163306, 2008.
[6] T. Riedl et al., “Tunable organic thin-film laser pumped by an inorganic violet diode laser,” Appl. Phys. Lett., vol. 88, no. 24, pp. 241116-1– 241116-3, 2006.
[7] A. L. Kanibolotsky et al., “Synthesis and properties of monodisperse oligofluorene-functionalized truxenes—Highly fluorescent stshaped ar-chitectures,” J. Amer. Chem. Soc., vol. 126, no. 42, pp. 13695–13702, 2004.
[8] A. Rose, Z. Zhu, C. F. Madigan, T. M. Swager, and V. Bulovi´c, “Sensitivity gains in chemosensing by lasing action in organic polymers,” Nature, vol. 434, pp. 876–879, 2005.
[9] M. Lu, S. S. Choi, U. Irfan, and B. T. Cunningham, “Plastic distributed feedback laser biosensor,” Appl. Phys. Lett., vol. 93, no. 11, pp. 111113-1–111113-3, 2008.
[10] J. Chilwell and I. Hodgkinson, “Thin-films field-transfer matrix theory of planar multilayer waveguides and reflection from prism-loaded waveg-uides,” J. Opt. Soc. Amer. A, vol. 1, no. 7, pp. 742–753, 1984.
[11] J. Voros, “The density and refractive index of adsorbing protein layers,” Biophys. J., vol. 87, no. 1, pp. 553–561, 2004.
[12] C. Vannahme, C. L. C. Smith, M. Brøkner Christiansen, and A. Kristensen, “Emission wavelength of multilayer distributed feedback dye lasers,” Appl. Phys. Lett., vol. 101, no. 15, art. no. 151123, 2012.
[13] C. Foucher et al., “Highly-photostable and mechanically flexible all-organic semiconductor lasers,” Opt. Mater. Express, vol. 3, no. 5, pp. 584–597, May 2013.
[14] Y. Tan et al., “Plastic-based distributed feedback laser biosensors in mi-croplate format,” IEEE Sensors J., vol. 12, no. 5, pp. 1174–1180, May 2012.
[15] I. D. Block, N. Ganesh, M. Lu, and B. Cunningham, “A sensitivity model for predicting photonic crystal biosensor performance,” IEEE Sensors J., vol. 8, no. 3, pp. 274–280, Mar. 2008.
[16] G. Ladam et al., “In situ determination of the structural properties of initially deposited polyelectrolyte multilayers,” Langmuir, vol. 16, no. 3, pp. 1249–1255, 2000.
[17] H. P. Erickson, “Size and shape of protein molecules at the nanometer level determined by sedimentation, gel filtration, and electron microscopy,” Biol. Proced. Online, vol. 11, pp. 32–51, 2009.
[18] B. Cunningham, Label-Free Optical Biosensors: An Introduction, M. Cooper, Ed. Cambridge, U.K.: Cambridge Univ. Press, 2009, pp. 1–28. [19] E. P. Diamandis and R. C. Morton, “Time-resolved fluorescence using a europium chelate of 4,7-bis-(chlorosulfopheny1)-1,10-phenanthroline-2,9-dicarboxylic acid (BCPDA): Labeling procedures and applications in immunoassays,” J. Immunol. Methods, vol. 112, no. 1, pp. 43–52, 1988. [20] A. D. Attie and R. T. Raines, “Analysis of receptor-ligand interactions,”
J. Chem. Educ., vol. 72, no. 2, p. 119, 1995.
[21] M. Erol, H. Du, and S. Sukhishvili, “Control of specific attachment of proteins by adsorption of polymer layers,” Langmuir, vol. 22, no. 26, pp. 11329–11336, 2006.
Anne-Marie Haughey received the M.Phys. degree in 2007, the M.DSc. degree in 2010, and the Eng.D degree in 2014. She is currently a Researcher at the Fraunhofer Centre for Applied Photonics, Glasgow, U.K.
Glenn McConnell received the M.Eng. degree in 2013. He is currently working toward the Eng.D degree with the Institute of Photonics, Glasgow, U.K.
Benoit Guilhabert received the Engineering degree in 2003, the D.E.A. degree in 2004, and the Ph.D. degree in 2008. He is currently a Senior Researcher with the Institute of Photonics, Glasgow, U.K.
Glenn A. Burley received the B.Sc. degree in 1996, and the Ph.D. degree in 2000. He is currently a Senior Lecturer at the Department of Pure and Applied Chemistry, University of Strathclyde, Glasgow, U.K.
Martin D. Dawson (M’86–SM’98–F’09) received the Ph.D. degree in 1985. Since 1996, he has been with the Institute of Photonics, Glasgow, U.K., where he is currently a Professor from 2001.