1
Preferential attachment of specific fluorescent dyes and dye labelled DNA sequences in a
SERS multiplex
Kirsten Graciea, Matthew Mooresb, W. Ewen Smitha, Kerry Hardinga, Mark Girolamib, Duncan Grahama and Karen Fauldsa*
aCentre of Molecular Nanometrology, Technology Innovation Centre, University of Strathclyde, 99 George Street,
Glasgow, G1 1RD, UK
bDepartment of Statistics, University of Warwick, Coventry, CV4 7AL, UK
Abstract
A significant advantage of using surface enhanced Raman scattering (SERS) for DNA detection is the capability to detect multiple analytes simultaneously within the one sample. However, as the analytes approach the metallic surface required for SERS, they become more concentrated and previous studies have suggested that different dye labels will have different affinities for the metal surface. Here the interaction of single stranded DNA labelled with either fluorescein (FAM) or of tetramethylrhodamine (TAMRA) with a metal surface, using spermine induced aggregated silver nanoparticles as the SERS substrate; is investigated by analysing the labels separately and in mixtures. Comparison studies were also undertaken using the dyes in their free isothiocyanate forms, fluorescein isothiocyanate (F-ITC) and tetramethylrhodamine isothiocyanate (TR-ITC). When the two dyes are pre-mixed prior to the addition of nanoparticles, TAMRA exerts a strong masking effect over FAM due to a stronger affinity for the metal surface. When parameters such as order of analyte addition, analysis time and analyte concentration are investigated, the masking effect of TAMRA is still observed but the extent changes depending on the experimental parameters. By using bootstrap estimation of changes in SERS peak intensity, a greater insight has been achieved into the surface affinity of the two dyes as well as how they interact with each other. It has been shown that that the order of addition of the analytes is important and that specific dye related interactions occur, which could greatly affect the observed SERS spectra. SERS has been used successfully for the simultaneous detection of several analytes, however this work has highlighted the significant factors that must be taken into consideration when planning a multiple analyte assay.
Introduction
2 surface of the SERS substrate. In addition, the dyes are readily available and can be covalently attached to a DNA sequence of interest using well-developed attachment chemistry.1-5 One of the main advantages of SERS is the sharp, molecularly specific pattern of peaks obtained from the dyes. They dominate the spectra over the intrinsic SERS response of the DNA sequence itself and can be used to identify different sequences within a mixture at very low concentrations thus enabling in situ detection of several dye labelled DNA sequences simultaneously from the same sample without the need for separation steps.6 Faulds et al. measured the SERS of eight DNA sequences labelled with commercially available fluorescent dyes.7 Limits of detection were calculated for each dye, showing that quantitative SERS analysis at very low concentration levels could be readily achieved. Following this, Stokes et al. analysed 13 DNA sequences that were each labelled with commercially available fluorophores using both silver and gold nanoparticles.8 Detection of multiple labelled DNA sequences simultaneously has been reported for a 2-plex for mutations within the cystic fibrosis gene.3 Following that study, a 3-plex system was developed for the detection of SERS active labelled DNA sequences that corresponded to particular gene sequences from E. coli. More recently, 5 dye labelled DNA sequences have been detected from a mixture using two laser excitation frequencies (514.5 and 633 nm).9 To increase the SERS multiplex to the detection of 6 or more labelled DNA sequences, chemometric analysis was required to clearly identify the presence or absence of the dye labelled DNA sequences in the multiplex mixture. Furthermore, chemometric analysis has proven to be a powerful tool when quantifying each dye labelled DNA sequence present in a multiplex.10-12 These assays used suspensions of citrate reduced silver nanoparticles aggregated with spermine as the substrate. The silver nanoparticles possess a negative surface charge as does the phosphate backbone of DNA.13 Spermine is therefore used to reduce the charge on both the DNA and the nanoparticles resulting in.14 The success of these assays shows that multiple analyte detection is highly effective allowing sensitive and selective detection.
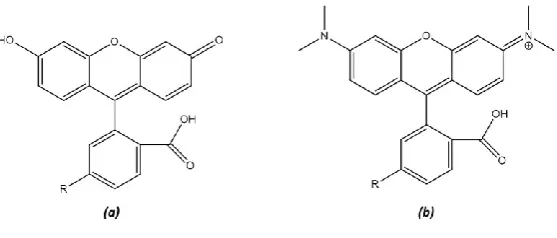
3 (fluorescein), Figure 1, have been investigated using fluorescence spectroscopy.16 Factors such as dye concentration, pH and the presence or absence of spermine were all shown to have an effect on the fluorescence intensity observed.
[image:3.595.159.438.292.411.2]This work makes it clear that the use of SERS for multiplex DNA analysis would be improved if the effect of different dyes on the process used to form the aggregates used to detect the SERS was better understood. To gain insight into the effect of different dye labels on SERS obtained using the silver colloid method, the effect of surface adsorption time and analyte concentration on mixtures of a DNA sequence labelled with either TAMRA or FAM was carried out in combination with bootstrap data analysis methods. The spectra were baseline corrected and changes in the intensity of SERS peaks were estimated using bootstrap confidence intervals.
Figure 1 The structures of the two fluorophores used in this study. (a) Structure of FAM, (b) structure of TAMRA. In both
cases R = NHS ester when the fluorophore is attached to an oligonucleotide and R = isothiocyanate when measurements
were performed on the free dye.
Materials and Methods
Colloid Synthesis
4 estimated using dynamic light scattering (DLS) and was weighted using the intensity of scattering. The approximate sizes of the nanoparticles were determined to be 77.7±0.59 nm. All experiments were performed under ambient conditions without degassing.
DNA Sequences
All sequences were purchased on a 0.2 µM scale with HPLC purification from Eurofins MWG (Ebersberg, Germany), shown in Table 1.
Name Sequence (5’-3’) 5’ Modifications
[image:4.595.66.531.254.315.2]TAMRA labelled oligonucleotide GGTTCATATAGTTATAATAA TAMRA FAM labelled oligonucleotide GGTTCATATAGTTATAATAA FAM Table 1 Fluorescent dye modified DNA sequences used for SERS analysis.
SERS Instrumentation
SERS analysis was carried out using an Avalon Instrument Ramanstation R3 (Belfast, UK), with an excitation wavelength of 532 nm from a diode laser. Disposable 1.5 mL PMMA semi-micro cuvettes were used. Instrument settings were 5 x 1 second accumulations with 0.5 cm-1 resolution. In some experiments, the 1 second exposure time had to be reduced due to oversaturation of the detector. The data was corrected to account for the change in exposure time.
Time Studies
Time studies, using TR-ITC/F-ITC and TAMRA/FAM labelled single stranded DNA (T20 and F20 respectively), were performed to determine what affect the order of addition of the analyte had on the SERS intensities observed. One of the free dyes or dye labelled DNA sequences (10 µL, 1 µM) was premixed in a microcuvette with spermine (20 µL, 0.1 M) and distilled water (220 µL) and to this mixture silver nanoparticles (150 µL) were added. The second dye or dye labelled DNA sequence was added in quick succession followed immediately by SERS analysis. SERS measurements of five replicate samples, each analysed three times, were recorded every 5 minutes for 20 minutes.
Concentration Studies
5 followed by the addition of silver citrate reduced nanoparticles (150 µL). The second dye or dye labelled DNA sequence (10 µL, varying concentration) was added followed by immediate SERS analysis. SERS measurements were recorded of five replicate samples, each analysed three times. Data Analysis
Before analysing the data, the observed spectra were pre-processed to correct for background fluorescence. The subtracted baseline was estimated by fitting a 6th degree polynomial using iterated least squares.19 Examples of pre-processed spectra are shown in Figure 2. The spectral signatures of the free dye, Figure 2(a), and dye-DNA, Figure 2(b), were recorded at 100% concentration. These spectra were subsequently used as a reference for comparison with the SERS intensities that were observed in the concentration studies and time studies. 95% bootstrap confidence intervals20 for SERS peak intensity were computed relative to the reference spectra by drawing 1,000 samples of 5 spectra with replacement. The bootstrap is a nonparametric method for chemometrics that requires minimal assumptions about the distribution of the observed data. This is important because the multiplexed spectra do not conform to the usual assumptions of linearity, independence, nor homoscedasticity (constant variance), as we will demonstrate. Instead, our comparison is based on the empirical distribution of the observations themselves, using random resampling of the data. All methods were implemented in R (R Foundation for Statistical Computing, Vienna, Austria) using the packages ‘hyperSpec’21 and ‘baseline’.22 Data is represented using box plots23 as the error between measurements is not normally-distributed. The variation in intensities between technical replicates and repeats was not constant, but varied considerably throughout the time and concentration studies. Statistical summaries of the intensity values that were measured in all studies are shown in Table S1-S4 in the supplementary information.
Results and Discussion
6 surface adherence of ssDNA labelled with both dyes.9 With respect to the system used in this study, spermine was always in vast excess compared to the nanoparticles and dye/DNA concentrations. The free dyes labels are used to compare to the labelled sequences and to ascertain whether effects observed are due to the dye label itself of the combination of DNA and label. Both possess a surface seeking isothiocyanate (ITC) group to aid adsorption onto the silver nanoparticle surface.
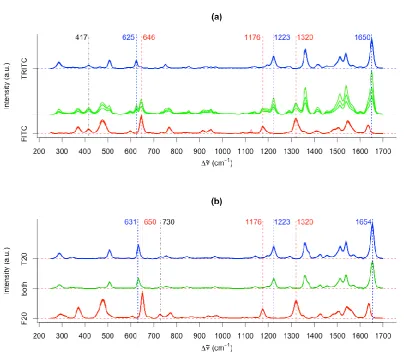
7 Figure 2 Stacked spectra of (a) the free dyes F-ITC (red) and TR-ITC (blue) individually and in a multiplex (green) and (b) the dye labelled DNA sequences, F20 (red) and T20 (blue), individually and in a multiplex (green). Multiple SERS spectra were recorded using an excitation wavelength frequency of 532 nm.
To carry out a more detailed analysis, the focus will be on specific bands that correspond to peaks of F-ITC (646 cm-1, 1176 cm-1, 1320 cm-1) and TR-ITC (625 cm-1, 1223 cm-1, 1650 cm-1) rather than considering the entire spectrum. Slightly different peak positions for dye-DNA spectra were chosen to adjust for changes in the spectral signatures due to attachment of the dye to the DNA sequence for F20 (650 cm-1, 1176 cm-1, 1320 cm-1) and T20 (631 cm-1, 1223 cm-1, 1654 cm-1). The specific peaks for F-ITC/F20 and TR-ITC/T20 shown in the main body of text are 646/650 cm-1 and 1650/1654 cm-1 respectively. The data for the other specific peak positions are shown in the supplementary information (Figures S1 to S8)and show similar trends.
8 S9-S13). Therefore, 20 minutes was deemed the safe time period where most accurate information would be gained about the surface attachment of the free dyes and dye labelled DNA sequences. TR-ITC was added to a solution of spermine and silver nanoparticles followed immediately by F-TR-ITC before SERS analysis (Figure 3a,b). The intensity of the TR-ITC peak at 1650 cm-1 decreases from 80% at 0 minutes (95% bootstrap confidence interval, CI of [0.77; 0.83]) to 51% intensity after 20 minutes (CI [0.49; 0.53]); please refer to the Materials and Methods for more detailed information of peak percentage analysis. The FITC peak intensity at 646 cm-1 is negligible; it is at a maximum at around 5% after 10 minutes (CI [0.035; 0.051]) then decreasing to less than 2% after 20 minutes (CI [0.012; 0.015]). The decrease in TR-ITC peak intensity over time suggests that the TR-ITC fluorescent dye is being displaced from the silver nanoparticle surface, which could be due to the nanoparticles aggregating in the presence of spermine over the analysis time period. The observation of the F-ITC peak at 646 cm-1 show that F-ITC does interact with the nanoparticle surface; however it does not to the same extent at TR-ITC that produced higher peak intensity at 1650 cm-1 indicating a stronger interaction between TR-ITC and the silver nanoparticle surface, regardless of the overall decrease in ITC intensity. Figure S1 contains information on the additional ITC and F-ITC peaks when TR-ITC was added first.
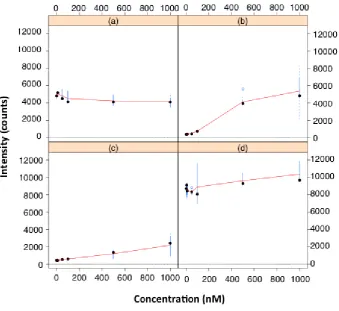
9 Figure 3 Box plots of the peak intensities versus time. (a) F-ITC peak intensity at 646 cm-1 and (b) TR-ITC peak intensity at
1650 cm-1, when TRITC was added first followed by FITC. (c) F-ITC peak intensity at 646 cm-1 and (d) TR-ITC 1650 cm-1
peak intensity when F-ITC was added first before TR-ITC addition. The red lines connect the mean intensity values; the black dots represent the median and the blue boxes represent the inter-quartile range (IQR). The blue circles in (b) represent outliers.
10 When F20 was added first followed by T20, F20 peak intensity at 650 cm-1 can be observed over the time period. The intensity of F20 slightly decreases from 32% at 0 minutes (CI [0.303; 0330]) to 29% after 20 minutes (CI [0.282; 0.301]). The T20 peak intensity at 1654 cm-1 increases from 16% at 0 minutes (CI [0.14; 0.16]) to 23% after 20 minutes (CI [0.21; 0.24]). The increase in T20 peak intensity occurs even through there is no increase in T20 concentration, couple this with the slight decrease in F20 peak intensity; this suggests displacement of F20 by T20 is occurring when the latter is added first. This is in good agreement with the previous discussion that the fluorescent dye TAMRA has a stronger affinity for the silver nanoparticle surface, regardless of it being in the TR-ITC or T20 form.
Figure 4 Box plots of the peak intensities versus time. (a) F20 peak intensity at 650 cm-1 and (b) T20 peak intensity at
1654 cm-1, when T20 was added first followed by F20. (c) F20 peak intensity at 650 cm-1 and (d) T20 1654 cm-1 peak
intensity when F20 was added first, followed byT20 addition. The red lines connect the mean intensity values; the black dots represent the median and the blue boxes represent the inter-quartile range (IQR).
11 and FAM, monolayer coverage was observed at approximately a final concentration of 10-8 M, the concentrations used here are above the monolayer coverage of the silver nanoparticles.26, 27Therefore, concentration studies were performed to observe the changes in spectral intensity as the concentrations of the dyes were increased. Compared to the free dyes (where the spectra were recorded at 1 µM), we would expect the following relationship:
𝑠_{𝐹 + 𝑇} = 𝑐𝐹
1000𝑠𝐹+ 𝑐𝑇
1000𝑠𝑇+ 𝜀𝐹+ 𝑇
Where cF is the concentration (in nM) of dye F, sF is the spectrum of dye Fin isolation, and ε is the additive Gaussian noise.
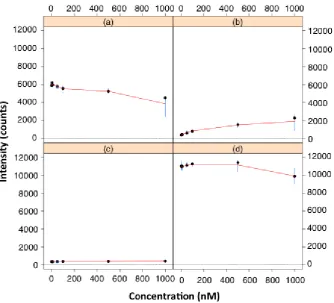
The concentration of F-ITC was held constant at 1 µM, while the concentration of TR-ITC was increased from 1 nM to 1 µM (Figure 5 a, b). The spectral intensity of the 646 cm-1 F-ITC peak started at 89% (CI [0.85; 0.92]) and decreased to 71% (CI [0.65; 0.77]) after the addition of 1 µM TR-ITC. The intensity of the 1650 cm-1 TR-ITC peak started at 2% (CI [0.019; 0.020]) and increased to 55% at 1 µM TR-ITC concentration. The decrease in F-ITC peak intensity, even though the concentration remains constant at 1 µM, suggests that displacement of F-ITC from the nanoparticle surface is occurring when the concentration of TR-ITC is increased. When the concentration of TR-ITC was kept constant at 1 µM and the concentration of F-ITC was increased from 1 nM to 1 µM, the 646 cm-1 F-ITC peak was undetectable at 1 nM (CI [-0.001; 0.001]), Figure 5 c, d. The spectral intensity for F-ITC increased to 0.5% at 5 nM (CI [0.0002; 0.0029]) then up to 29% at 1 µM (CI [0.18; 0.36]). The intensity of the 1650 cm-1 TR-ITC started at 97% (CI [0.93; 0.99]) and appeared to increase above 100% (CI [1.03; 1.14]), regardless of the concentration of TR-ITC remaining constant at 1 µM. Figures S5 and S6 contains information on the additional TR-ITC and F-ITC peaks when the concentrations were altered.
12 Figure 5 Box plots of the peak intensities versus concentration. (a) F-ITC peak intensity at 646 cm-1 and (b) TR-ITC peak
intensity at 1650 cm-1, when the TR-ITC concentration was increased from 1 nM to 1 µM and the F-ITC concentration
remained constant at 1 µM. (c) F-ITC peak intensity at 646 cm-1 and (d) TR-ITC 1650 cm-1 peak intensity when the F-ITC
concentration was increased from 1 nM to 1 µM and the TR-ITC concentration remained constant at 1 µM. The red lines connect the mean intensity values; the black dots represent the median and the blue boxes represent the inter-quartile range (IQR). The blue circles in (b) and (d) represent outliers.
13 Figure 6 Box plots of the peak intensities versus concentration. (a) F20 peak intensity at 650 cm-1 and (b) T20 peak
intensity at 1654 cm-1, when the T20 concentration was increased from 1 nM to 1 µM and the F20 concentration
remained constant at 1 µM. (c) F20 peak intensity at 650 cm-1 and (d) T20 1654 cm-1 peak intensity when the F20
concentration was increased from 1 nM to 1 µM and the T20 concentration remained constant at 1 µM. The red lines connect the mean intensity values; the black dots represent the median and the blue boxes represent the inter-quartile range (IQR).
[image:13.595.114.449.74.377.2]14 Conclusions
Combining SERS and chemometric analysis using baseline correction and the bootstrap has proved to be greatly beneficial in gaining insight into the effect that the order of addition of the analytes, concentration and analysis time has on the observed peak intensities of dyes and dye labelled DNA sequences. The common observation throughout this study was the ability of TAMRA to be readily detected in the presence of FAM; both free dye and dye labelled DNA sequences, from the surface of silver nanoparticles regardless of the experimental parameters.
The time studies demonstrated that in both scenarios involving either dye or dye labelled DNA sequence, the analyte that was added first produced a higher SERS intensity compared to the analyte that was added second. In general, the observed intensity of TAMRA is around four times higher than that of FAM, therefore combining this with the order of addition then it would become increasingly difficult to observe any FAM peaks in the multiplex spectra. The importance of analysis time has also been highlighted. When the dyes were in their free form over aggregation of the nanoparticles was an issue, over the time period analysed, which resulted in a decrease in SERS intensity of both dyes. However, when both dyes were conjugated to a DNA sequence, a stabilising effect was created where no variation in SERS intensities was observed for either dye, which could potentially be beneficial, particularly for multiplex DNA SERS assays. The concentration studies were significant since in many multiplex assays the concentration of the multiple analytes present will not be equimolar, one or more may be in excess and this will seriously affect the ability to accurately quantify the concentration. The main issues were found to be that when F-ITC was added at low concentrations (1 nM) and TR-ITC was in excess (1 μM), the F-ITC signal was essentially undetectable. More significant results were obtained when the dyes were conjugated to the DNA sequences. T20 was shown to strongly adhere to the nanoparticle surface, therefore at low F20 concentrations; it was nearly impossible to detect any F20 signals, regardless of the F20 concentration increasing. This is of high importance when a multiplex SERS assay has been designed based on dye labelled DNA detection. Overall, this study has given a better insight into the competition between multiple dyes in a SERS multiplex, which will impact the experimental design of future multiplex detection assays.
Supporting Information
15 Author Information
Corresponding Author
*Telephone +44 (0)141 548 2507; e-mail [email protected].
Author Contributions: The manuscript was written through contributions of all authors. All authors have given approval to the final version of the manuscript.
Notes: The authors declare no competing financial interest.
Acknowledgements
KF and KG wish to thank the RSC Analytical Trust Fund and EPSRC for funding through the award of DTG funding to KG. DG thanks the Royal Society for support from a Wolfson Research Merit award. MM and MG would like to thank the EPSRC (ref: EP/L014165/1) and an Award for Postdoctoral Collaboration from the EPSRC Network on Computational Statistics & Machine Learning (ref: EP/K009788/2). The research data associated with this paper will become available at the following link from November 2015 http://dx.doi.org/10.15129/2c186689-2334-4746-955e-f9579ca15909.
References
1. D. Graham, W. E. Smith, A. M. T. Linacre, C. H. Munro, N. D. Watson and P. C. White, Anal. Chem., 1997, 69, 4703-4707.
2. N. R. Isola, D. L. Stokes and T. Vo-Dinh, Anal. Chem., 1998, 70, 1352-1356.
3. D. Graham, B. J. Mallinder and W. E. Smith, Angew. Chem. Int. Ed., 2000, 39, 1061-1063. 4. Y. W. C. Cao, R. C. Jin and C. A. Mirkin, Science, 2002, 297, 1536-1540.
5. K. Faulds, L. Stewart, W. E. Smith and D. Graham, Talanta, 2005, 67, 667-671. 6. D. Graham and K. Faulds, Chem. Soc. Rev., 2008, 37, 1042-1051.
7. K. Faulds, W. E. Smith and D. Graham, Anal. Chem., 2004, 76, 412-417.
8. R. J. Stokes, A. Macaskill, P. J. Lundahl, W. E. Smith, K. Faulds and D. Graham, Small, 2007, 3, 1593-1601.
9. K. Faulds, F. McKenzie, W. E. Smith and D. Graham, Angew. Chem. Int. Ed., 2007, 46, 1829-1831.
10. K. Faulds, R. Jarvis, W. E. Smith, D. Graham and R. Goodacre, Analyst, 2008, 133, 1505-1512. 11. M. Zhong, M. Girolami, K. Faulds and D. Graham, J. Roy. Statist. Soc. Ser. C, 2011, 60,
187-206.
12. K. Gracie, E. Correa, S. Mabbott, J. A. Dougan, D. Graham, R. Goodacre and K. Faulds, Chem. Sci., 2014, 5, 1030-1040.
13. P. C. Lee and D. Meisel, J. Phys. Chem., 1982, 86, 3391-3395.
16 15. A. MacAskill, D. Crawford, D. Graham and K. Faulds, Anal. Chem., 2009, 81, 8134-8140. 16. K. Gracie, W. E. Smith, P. Yip, J. U. Sutter, D. J. S. Birch, D. Graham and K. Faulds, Analyst,
2014, 139, 3735-3743.
17. J. Yguerabide, E. Talavera, J. M. Alvarez and B. Quintero, Photochem. Photobiol., 1994, 60, 435-441.
18. J. Yguerabide and E. E. Yguerabide, Anal. Biochem., 1998, 262, 137-156. 19. C. A. Lieber and A. Mahadevan-Jansen, Appl. Spectrosc., 2003, 57, 1363-1367.
20. B. Efron and R. J. Tibshirani, An introduction to the bootstrap, Chapman & Hall/CRC Press, United States of America, 1993.
21. C. Beleites and V. Sergo, hyperSpec: a package to handle hyperspectral data sets in R, https://cran.r-project.org/web/packages/hyperSpec/hyperSpec, 2014.
22. K. H. Liland and B.-H. Mevik, Baseline: Baseline Correction of Spectra, https://cran.r-project.org/web/packages/baseline/baseline , 2014.
23. J. W. Tukey, Exploratory Data Analysis, Pearson, United States of America, 1977. 24. S. E. J. Bell and N. M. S. Sirimuthu, J. Am. Chem. Soc., 2006, 128, 15580-15581.
25. N. G. Greeneltch, A. S. Davis, N. A. Valley, F. Casadio, G. C. Schatz, R. P. Van Duyne and N. C. Shah, J. Phys. Chem. A, 2012, 116, 11863-11869.
26. C. McLaughlin, D. Graham and W. E. Smith, J. Phys. Chem. B, 2002, 106, 5408-5412.
17