Effective Evaluation of Classification of Indian News Using
Various Data Mining Algorithm
Sushilkumar Rameshpant Kalmegh
Associate Professor, Department of ComputerScience, Sant Gadge Baba Amravati University, Amravati, Maharashtra, 444606, India.
ABSTRACT
Classification may refer to categorization, the process in which ideas and objects are recognized, differentiated, and understood. Classification is an important data mining technique with broad applications. It classifies data of various kinds. Recent developments of e-learning specifications such as Learning Object Metadata (LOM), Sharable Content Object Reference Model (SCORM), Learning Design and other pedagogy research in semantic e-learning have shown a trend of applying innovative computational techniques, especially Semantic Web technologies, to promote existing content-focused learning services to semantic-aware and personalised learning services. This paper has been carried out to make a performance evaluation of classification using Various Data Mining algorithm. The paper sets out to make comparative evaluation of classifiers in the context of dataset of Indian news to maximize true positive rate and minimize false positive rate. For processing Weka API were Used. The results in the paper on dataset of Indian news also show that the efficiency and accuracy NNge, OneR and FT is 100%.
Keywords: Decision Table, NNge, JRip,OneR, PART, Ridor, FT,
J48
1. Introduction
Each of the past three centuries has been dominated by a single technology. The eighteenth century was the time of the great mechanical systems accompanying the Industrial Revolution. The nineteenth century was the age of the stream engine. During the twentieth century, the key technology has been information gathering, processing and distribution. Among other developments, we have seen the birth and unprecedented growth of the computer industry. Now as we have entered in the twenty-first century all the most of all manual services are replaced by machine operation i.e. complete computerization and hence released human intelligence is utilized in further developments.
INTERNET has become a major channel of the resources and information. All most all e-activities are based on the Internet. Among these e-Activities, e-Learning is the fastest growing activity as it has huge market potential. e-Learning encompasses the collection of different
resources like Text, Image, Video, Audio, Web-Links etc. This inclusion makes it different than the web pages. As the latest stage of learning and training evolution, e-Learning is supposed to provide intelligent functionalities not only in processing multi-media education resources but also in supporting context-sensitive pedagogical education processes.
Searching the Internet using the keywords for the expected text may be a simple task but integration of other multimedia resources which are semantically relevant to the e-Learning topic becomes a difficult task unless and until specific keywords are assigned manually. Being e-Learning as an organized information and knowledge base, it needs proper inclusion of available multimedia resources. This inclusion is generally based on the keywords. However, if a semi automatic methodology designed, the task of proper inclusion of the resource can be done efficiently.
In this case, there is a need of a design of a framework which can integrate dynamic multimedia content to the existing e-contents. This paper discusses the methodology for such integration. In order to get the details of this methodology, this paper is organized into five parts. First part discusses the concept of e-learning followed by the literature required for analysis of methods implemented. Fourth one discusses the technique of classification. Fifth one is System Design followed by datasets used for analysis. Seventh is the Performance Analysis and then conclusions.
2. e-Learning
E-learning is a new education concept by using the Internet technology, it deliveries the digital content, provides a learner-orient environment for the teachers and students. The e-learning promotes the construction of life-long learning opinions and learning society.
definition extends the environment on the Internet. It means that the Internet provides a learning environment for the students and teachers. This environment is learner-oriented, so we can throw out the thoughts of traditionally teacher-centre’s instruction in classroom. As a new concept of education, e-learning gives a condition for us to realize the life-long learning principle and help us to build a more real learning society. E-learning plays a major role in high education for the reason of fast need of high education.
The e-learning industry refers to the effective integration of a range of technologies across all areas of learning, e-learning technologies are designed to support learning by encompassing a range of media, tools, and environments. It allows for both synchronous and asynchronous learning environments. E-learning acts as a catalyst for authentic and meaningful learning experiences [1].
3. Literature Survey
The major implementation that includes the intelligence in e-Learning is ConKMEL. To resolve the knowledge integration and management problem in multimedia e-Learning, it has proposed a semantic context aware approach, which features an integrated contextual knowledge management framework to support intelligent e-Learning.[2]
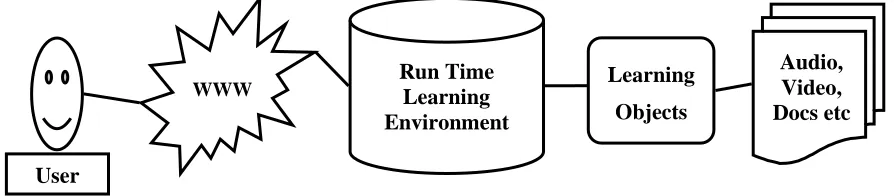
Traditional web-based e-learning systems use a web browser as the interface. Through run-time learning environments (either compatible or incompatible with SCORM) [3] users could access the learning objects, which are directly linked to multimedia learning resources such as lecture video/audio, presentation slides and reference documents. However, the limitation in generic specification support does not affect their compliancy with e-Learning standards such as SCORM (Shareable Content Object Reference Model) [3] for content management and LOM (Learning Object Model) [4] for learning object description. A flow in traditional
e-Learning system is given in Fig 1.
Weihong Huang et. al. [5] has proposed an intelligent semantic e-Learning framework which presents semantic information processing, learning process support and personalized learning support issues in an integrated environment. Architecture of the above framework is as given below in Fig 2. In addition to the traditional learning information flow, three new components namely semantic context model, intelligent personal agents and conceptual learning theories are introduced to bring in more intelligence Intelligent personal agents perform adequate personal trait information profiling and deliver personalized learning services. Semantic context model uses semantic information for static resource and dynamic process retrieves information from WWW and the future Semantic Web, referring to ontologies or knowledge bases. The semantic e-Learning framework consists of three stages, namely
1. Pre Learning Process 2. Learning Process 3. Post Learning Process
Pre Learning process is designed for Instructors and learners. Instructors indentify the multimedia resources on the web, assigns contextual information to it, design learning path for different types of learners and design learning activities and assessment for individual sessions and whole course. Learners are indentifies and are profiles based on the questionnaire given to it. This profiling is used to identify the personality of the learner based on which a course is catered to it.
Learning process contribute various kinds of learning activities involving, locating learning material, reading material, writing reflection, discussions with peers, self evaluation and revision etc. More precisely this is a learner centric stage where complex learning activity is a combination of simple activities.
Post learning process is the final stage involving reporting and evaluation of learning outcome on both the sides i.e. learner and instructor sides.
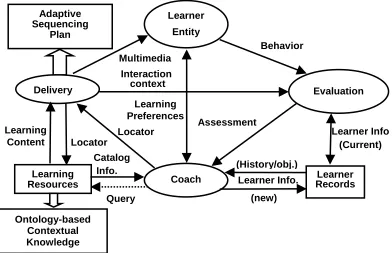
Hyunjong Choe et al. [6] has concentrated on the IEEE Learning Technology System Architecture (LTSA) which
User
WWW
Run Time
Learning
Environment
Learning
Objects
Audio,
Video,
Docs etc
represent a variety of learning system from different domains. Following figure 3 show the model referred above. In the figure, two squares shows ontology-based model containing adaptive sequencing plan and the ontology-based contextual knowledge, In this model learning rescurces is combined with ontological
knowledge as a resource for contextual learning. Queries are used to search the resulted resources. The evaluation component is used to measure the learner's performance and finally the result is stored in the database named "learner records". Coach component uses learner records to locate a new context.
User
WWW
Context
Model
Run Time
Learning
Environment
Learning
Objects
Video, Docs
Audio,
etc
Ontology/
Knowledge
Base
Learning
Activities
Predefined
Models
Semantic
Web
Fig 2: Semantic e-Learning Framework
Learning Preferences Learning
Content
Query
Learner Info (Current) Learner
Entity
Coach
Evaluation Delivery
Learning Resources
Learner Records Adaptive
Sequencing Plan
Ontology-based Contextual Knowledge
Locator
Locator
Catalog Info.
Learner Info. (History/obj.)
(new) Assessment Interaction
context Multimedia
Behavior
4. Classification
Classification may refer to categorization, the process in which ideas and objects are recognized, differentiated, and classifier. The term "classifier" sometimes also refers to the mathematical function, implemented by a classification algorithm that maps input data to a category.
In the terminology of machine learning, classification is considered an instance of supervised learning, i.e. learning where a training set of correctly identified observations is available. The corresponding unsupervised procedure is known as clustering or cluster analysis, and involves grouping data into categories based on some measure of inherent similarity.
Classification is a data mining algorithm that creates a step-by-step guide for how to determine the output of a new data instance. The tree it creates is exactly that: a tree whereby each node in the tree represents a spot where a decision must be made based on the input, and to move to the next node and the next until one reach a leaf that tells the predicted output. Sounds confusing, but it's really quite straightforward.
There is also some argument over whether classification methods that do not involve a statistical model can be considered "statistical". Other fields may use different terminology: e.g. in community ecology, the term "classification" normally refers to cluster analysis, i.e. a type of unsupervised learning, rather than the supervised learning. [7].
4.1 Decision Table Classifiers :
The entire problem of learning decision tables consists of selecting the right attributes to be included. Usually this is done by measuring the table’s cross validation performance for different subsets of attributes and choosing the best performing subset. Fortunately, leave-one-out cross-validation is very cheap for this kind of classifier. Obtaining the cross-validation error from a decision table derived from the training data is just a matter of manipulating the class counts associated with each of the table’s entries, because the table’s structure doesn’t change when instances are added or deleted. The attribute space is generally searched by best-first search because this strategy is less likely to get stuck in a local maximum than others, such as forward selection.
Decision Table are one of the simplest hypothesis spaces possible and usually they are easy to understand. Decision Table builds a decision table majority classifier. It evaluates feature subsets using best-first search and can use cross-validation for evaluation. An option uses the
nearest-neighbor method to determine the class for each instance that is not covered by a decision table entry, instead of the table’s global majority, based on the same set of features [8] [9].
4.2 JRip Classifiers :
This implements a propositional rule learner, Repeated Incremental Pruning to Produce Error Reduction (RIPPER), which is proposed by William W. JRip is an inference and rules-based learner (RIPPER) that tries to come up with propositional rules which can be used to classify elements.
JRip implements heuristic global optimization of the rule set. Classes are examined in increasing size and an initial set of rules for a class is generated using incremental reduced-error pruning. An extra stopping condition is introduced that depends on the description length of the examples and rule set.
JRip (RIPPER) is one of the basic and most popular algorithms. Classes are examined in increasing size and an initial set of rules for the class is generated using incremental reduced error JRip (RIPPER) proceeds by treating all the examples of a particular judgment in the training data as a class, and finding a set of rules that cover all the members of that class. Thereafter it proceeds to the next class and does the same, repeating this until all classes have been covered[8] [10] [11].
4.3 NNge Classifiers :
NNge is a nearest-neighbor method for generating rules using non-nested generalized exemplars. Non-Nested Generalized Exemplars (NNGE) is an algorithm introduced by Brent, in 1995. It performs generalization by merging exemplars, forming hyper rectangles in attribute space that represent conjunctive rules with internal disjunction.
4.4 OneR Classifiers :
OneR is a simple and a very effective classification algorithm frequently used in machine learning applications. Even though OneR is difficult to be improved further due to its simplicity, it can be enhanced by providing better methods for handling some of the exceptions.
There is an easy way to find very simple classification rules from a set of instances, called 1R for 1-rule, due to its high accuracy. Perhaps this is because the structure underlying many real-world datasets is quite rudimentary, and just one attribute is sufficient to determine the class of an instance quite accurately. In any event, it is always a good plan to try the simplest things first. Generates a one-level decision tree expressed in the form of a set of rules that all test one particular attribute. 1R is a simple, cheap method that often comes up with quite good rules for characterizing the structure in data. It turns out that simple rules frequently achieve surprisingly
The idea is this: We make rules that test a single attribute and branch accordingly. Each branch corresponds to a different value of the attribute. It is obvious what the best classification to give each branch is; Use the class that occurs most often in the training data. Then the error rate of the rules can easily be determined. Just count the errors that occur on the training data that is, the number of instances that do not have the majority class. Each attribute generates a different set of rules, one rule for every value of the attribute [8] [14].
4.5 PART Classifiers :
PART works by building a rule and removing its cover, as in the separate-and-conquer technique, repeatedly until all the instances are covered. The rule construction stage differs from standard separate-and-conquer methods because a partial pruned decision tree is built for a set of instances, the leaf with the largest coverage is made into a rule, and the tree is discarded. The pruned decision tree helps to avoid the over pruning problem of methods that immediately prune an individual rule after construction. It builds a partial decision tree to obtain a rule. It uses C4.5‘s procedures to build a tree. It uses separate-and-conquer. It builds a partial C4.5 decision tree in every iteration and makes the "best" leaf into a rule. PART obtains rules from partial decision trees . It builds the tree using C4.5’s heuristics with the same user-defined parameters as J4.8. Three rules are found and are intended to be processed in order, the prediction generated for any test instance being the outcome of the first rule that fires. The last, “catch-all” rule will always fire. As with J48, the numbers in parentheses that follow each rule give the
number of instances that are covered by the rule followed by the number that are misclassified (if any). PART Class for generating a PART decision list. Uses separate-and-conquer. Builds a partial C4.5 decision tree in each iteration and makes the ”best” leaf into a rule [8] [15] [16].
4.6 Ridor Classifiers :
Ripple Down Rule learner (RIDOR) is also a direct classification method. Ridor learns rules with exceptions by generating the default rule, using incremental reduced-error pruning to find exceptions with the smallest reduced-error rate, finding the best exceptions for each exception, and iterating. It generates a default rule first and then the exceptions for the default rule with the least (weighted) error rate. Then it generates the "best" exceptions for each exception and iterates until pure. Thus it performs a tree-like expansion of exceptions. The exceptions are a set of rules that predict classes other than the default. IREP is used to generate the exceptions. Incremental Reduced Error Pruning IREP is used to create the exceptions [8] [11] [17].
4.7 FT Classifiers :
FT Classifier for building Functional trees, which are classification trees that could have logistic regression functions at the inner nodes and/or leaves. The algorithm can deal with binary and multi-class target variables, numeric and nominal attributes and missing values. FT combines a standard univariate DT, such as C4.5, with linear functions of the attributes by means of linear regressions. While a univariate DT uses simple value tests on single attributes in a node, FT can use linear combinations of different attributes in a node or in a leaf. In the constructive phase a function is built and mapped to new attributes. A model is built using the constructor function. This is done using only the examples that fall at this node. Later, the model is mapped to new attributes. The constructor function should be a classifier or a regresssor depending on the type of the problem. In the former the number of new attributes is equal to the number of classes, in the latter the constructor function is mapped to one new attribute. Each new attribute is computed as the value predicted by the constructed function for each example. In the classification setting, each new attribute value is the probability that the example belongs to one class given by the constructed model. The merit of each new attribute is evaluated using the merit-function of the univariate tree, and in competition with the original attributes [8] [18].
4.8 J48 Classifiers :
version of this family of algorithms before the commercial implementation C5.0 was released.
The J48 Decision tree classifier follows the following simple algorithm. In order to classify a new item, it first needs to create a decision tree based on the attribute values of the available training data. So, whenever it encounters a set of items (training set) it identifies the attribute that discriminates the various instances most clearly. This feature that is able to tell us most about the data instances so that we can classify them the best is said to have the highest information gain. Now, among the possible values of this feature, if there is any value for which there is no ambiguity, that is, for which the data instances falling within its category have the same value for the target variable, then we terminate that branch and assign to it the target value that we have obtained.
A flow-chart-like tree structure, internal node denotes a test on an attribute Branch represents an outcome of the test Leaf nodes represent class labels or class distribution. Decision tree generation consists of two phases Tree construction At start, all the training examples are at the root. Partition examples recursively based on selected attributes Tree pruning Identify and remove branches that reflect noise or outliers. Use of decision tree: Classifying an unknown sample Test the attribute values of the sample against the decision tree [8] [19].
5. System design
We designed a model based on the machine learning and
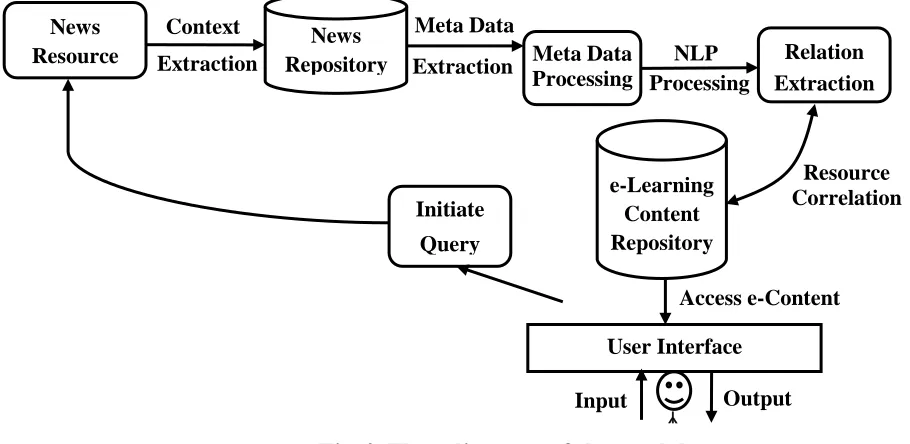
XML search. In order to co-relate News with the categories a model based on the machine learning and XML search was designed. Flow diagram of the model for news resources is shown below in fig 4.
As a input to the model, various news resources are considered which are available online like the news in Google news repository or online paper like Times of India, Hindustan Times etc. Around 649 news were collected on above repository. In order to extract context from the news and co-relate it with the proper e-content, the News was process with stemming and tokenization on the news contents. The news then was converted into the term frequency matrix for further analysis purpose. Based on this data, features (i.e. metadata) were extracted so that contextual assignment of the news to the appropriate content can be done. This process is known as metadata processing in the above flow diagram. Title of the also contains useful information in the abstract form, The title also can be considered as Metadata. The title of the news is processed using NLP libraries (Standford NLP Library) to extract various constituents of it. The output of NLP process was also used to co-relate the News (textual, audio, video) to the concern e-learning contents. This process can be initiated automatically when the user access any content from e-Learning data repository.
As shown in the figure, a news resource is processed to correlate with the e-Contents available. On the similar way, other text resources can be added directly with the e-Content in the repository, Image or Video resource can be processed for meta-data available. And thus can be searched with the related e-Contents.
Fig 4. Flow diagram of the model
NLP
Processing
News
Resource
Context
Extraction
Meta Data
Extraction
News
Repository
Meta Data
Processing
Relation
Extraction
e-Learning
Content
Repository
Resource
Correlation
User Interface
Access e-Content
ᛣ
Initiate
Query
6. D
ATA COLLECTION
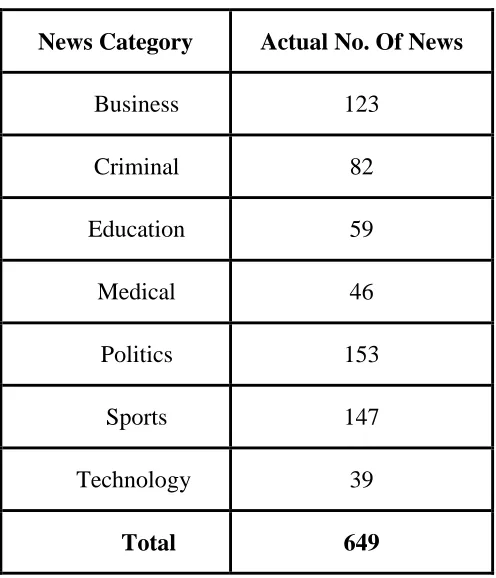
Hence it was proposed to generate indigenous data. Hence the national resources were used for the research purpose. Data for the purpose of research has been collected from the various news which are available in various national and regional newspapers available on internet. They are downloaded and after reading the news they are manually classified into 7 (seven) categories. There were 649 news in total. The details are as shown in Table 1.
The attributes consider for this classification is the topic to which news are related; the statements made by different persons; the invention in Business, Education, Medical, Technology; the various trends in Business; various criminal acts e.g. IPC and Sports analysis. During classification some news cannot be classified easily e.g. (1)Political leader arrested under some IPC code, (2) Some invention made in medicine and launched in the market & business done per annum.
Table 1: Categorization of News
News Category
Actual No. Of News
Business
123
Criminal
82
Education
59
Medical
46
Politics
153
Sports
147
Technology
39
Total
649
Hence, there will be drastic enhancement in e-Contents when we refer to the latest material available in this regards. For example, if some e-Content refers to the political situation of India, then the references needs to be dynamic as the situation may change depending on the result of election.
7. Performance analysis
In the research work, we used the dataset of Indian News. The dataset is manually classified into the classes. In order to classify the News, we used some words which are specific to that class and also the classification given in the News paper. Every News paper classifies the News into various categories, like local, National, International, Sports, Education etc. This titles (as a metadata) are used to classify the News manually. Though there is a possibility of differences in classification from person to person, the differences can be minimized by using News paper classification and the words specific to that category of News.
This manually classified dataset is tested against different models of classification. We choose Decision Table, JRip, NNge, OneR, PART, Ridor, FT and J48 classifiers in order to test the performance of classification of the News. We used Weka implementation of these algorithm. Dataset that we used is divided into 80:20 pattern for Training and Testing of the model.
7.1 Performance using Decision Table Classifier
Table 2 : Confusion Matrix for Decision Table
Classified as Education Business Criminal Technology Politics Medical Sports Education 44 2 3 0 4 0 6
Business 4 79 2 0 9 0 29 Criminal 11 2 55 0 8 1 5 Technology 5 9 2 9 2 0 12
Politics 43 0 3 0 105 0 2
Medical 6 2 0 0 3 31 4
Sports 2 2 1 0 0 1 141
Table 3 : Table Showing True Positive and False Positive Rate of Decision Table
Class TP Rate FP Rate Precision Recall ROC Area Education 74.6% 12% 38.3% 74.6% 86.3%
Business 64.2% 3.2% 82.3% 64.2% 89.3% Criminal 67.1% 1.9% 83.3% 67.1% 89.8% Technology 23.1% 0% 1% 23.1% 66.7% Politics 68.6% 5.2% 80.2% 68.6% 94.8% Medical 67.4% 0.3% 93.9% 67.4% 91%
Sports 95.9% 11.6% 70.9% 95.9% 92.1% Weighted Avg. 71.5% 5.8% 77.2% 71.5% 89.8%
7.2 Performance using JRip Classifier
Overall Performance of JRip algorithm is acceptable, except some of News from Business are classified into Politics. However from the table 4 and table 5 given below, some of the Technology News is distributed into Education, Business and Sports. This is because every category has some or other references of the other category. For example is some Political News refers to the
use of Technology in Politics and have much stress on Technology, it is probable to get it classified into Technology rather than Politics. The News which specifically refers the given category are rare and specific. However, overall JRip algorithm is proved to yield better results for our Indian News Repository.
Table 4 : Confusion Matrix for JRip
Classified as Education Business Criminal Technology Politics Medical Sports Education 54 1 0 2 2 0 0
Business 0 104 2 2 14 1 0
Criminal 3 2 75 0 2 0 0
Technology 0 4 1 27 6 1 0 Politics 5 5 8 0 130 1 4
Medical 0 0 0 0 0 46 0
Sports 1 4 1 0 1 2 138
Table 5 : Table Showing True Positive and False Positive Rate of JRip
Class TP Rate FP Rate Precision Recall ROC Area Education 91.5% 1.5% 85.7% 91.5% 98.5%
7.3 Performance of NNge, OneR and FT Classifier
NNge finds the nearest neighbour for generating rules, using non nested generalized examples. Hence as it can be seen in the table 6 and table 7 below it has given
100% accuracy. However, the performance may vary in case of the mix News, for example a News regarding a movie having use of latest technology, and where the news describes the technology in the News.
Table 6 : Confusion Matrix for NNge
Classified as Education Business Criminal Technology Politics Medical Sports Education 59 0 0 0 0 0 0
Business 0 123 0 0 0 0 0
Criminal 0 0 82 0 0 0 0
Technology 0 0 0 39 0 0 0 Politics 0 0 0 0 153 0 0
Medical 0 0 0 0 0 46 0
Sports 0 0 0 0 0 0 147
Table 7 : Table Showing True Positive and False Positive Rate of NNge
Class TP Rate FP Rate Precision Recall ROC Area Education 100% 0% 100% 100% 100%
Business 100% 0% 100% 100% 100% Criminal 100% 0% 100% 100% 100% Technology 100% 0% 100% 100% 100% Politics 100% 0% 100% 100% 100% Medical 100% 0% 100% 100% 100% Sports 100% 0% 100% 100% 100% Weighted Avg. 100% 0% 100% 100% 100%
OneR is a simple algorithm, in which rules are made that test a single attribute and branch accordingly. Hence the
accuracy of algorithm is highest. The table 8 and table 9 shows these result, as expected with 100% accuracy.
Table 8: Confusion Matrix for OneR
Classified as Education Business Criminal Technology Politics Medical Sports Education 59 0 0 0 0 0 0
Business 0 123 0 0 0 0 0
Criminal 0 0 82 0 0 0 0
Technology 0 0 0 39 0 0 0 Politics 0 0 0 0 153 0 0 Medical 0 0 0 0 0 46 0 Sports 0 0 0 0 0 0 147
Table 9 : Table Showing True Positive and False Positive Rate of OneR
Class TP Rate FP Rate Precision Recall ROC Area Education 100% 0% 100% 100% 100%
Business 100% 0% 100% 100% 100% Criminal 100% 0% 100% 100% 100% Technology 100% 0% 100% 100% 100% Politics 100% 0% 100% 100% 100% Medical 100% 0% 100% 100% 100% Sports 100% 0% 100% 100% 100% Weighted Avg. 100% 0% 100% 100% 100%
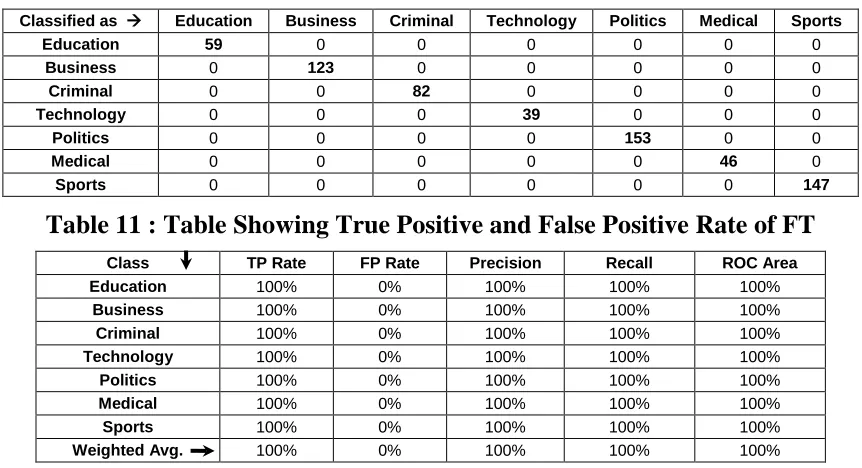
FT, a functional true algorithm use linear regression with standard Univariate Decision Tree. A mapping of model to each attribute is done. This makes FT to achieve high
Table 10: Confusion Matrix for FT
Classified as Education Business Criminal Technology Politics Medical Sports Education 59 0 0 0 0 0 0
Business 0 123 0 0 0 0 0
Criminal 0 0 82 0 0 0 0
Technology 0 0 0 39 0 0 0 Politics 0 0 0 0 153 0 0
Medical 0 0 0 0 0 46 0
Sports 0 0 0 0 0 0 147
Table 11 : Table Showing True Positive and False Positive Rate of FT
Class TP Rate FP Rate Precision Recall ROC Area Education 100% 0% 100% 100% 100%
Business 100% 0% 100% 100% 100% Criminal 100% 0% 100% 100% 100% Technology 100% 0% 100% 100% 100% Politics 100% 0% 100% 100% 100% Medical 100% 0% 100% 100% 100% Sports 100% 0% 100% 100% 100% Weighted Avg. 100% 0% 100% 100% 100%
Here it is to be noted that all three algorithms have gives 100% TP rate.
7.4 Performance of PART Classifier :
PART works by building a rule and removing its corner, until all instances are covered. It uses C4.5 procedure to
build a tree. The performance for Indian News repository has given 96.1% TP and 0.7% FP and area under ROC curve is 99.8%. It can be seen from following Table 12 and Table 13. The algorithm can be used for classifying the News so that it can then be made available to the e-Learner as per his /her selection.
Table 12 : Confusion Matrix for PART
Classified as Education Business Criminal Technology Politics Medical Sports Education 55 0 0 1 3 0 0
Business 1 118 1 1 1 0 1
Criminal 2 0 78 0 2 0 0
Technology 2 1 1 33 1 1 0 Politics 0 0 0 1 150 1 1
Medical 0 0 0 2 0 44 0
Sports 0 1 0 0 0 0 146
Table 13 : Table Showing True Positive and False Positive Rate of PART
Class TP Rate FP Rate Precision Recall ROC Area Education 93.2% 0.8% 91.7% 93.2% 99.7%
7.5 Performance of Ridor Classifier :
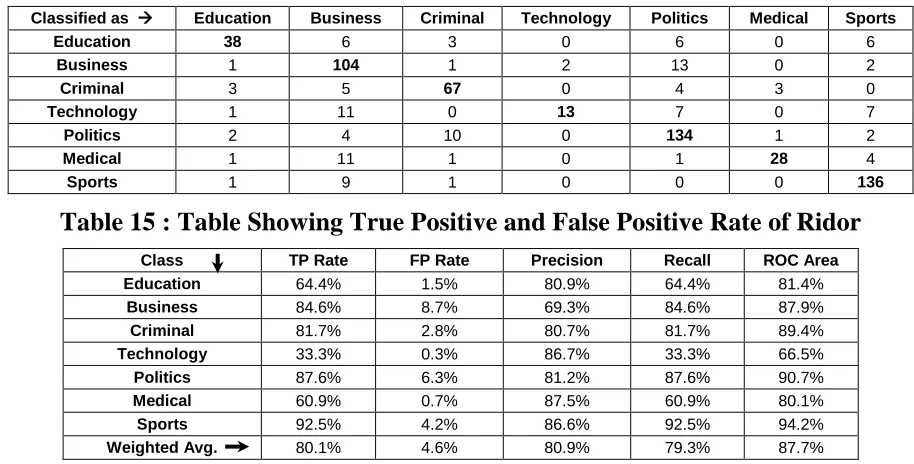
Ridor generates a default rule first and then the exceptions for default rule with least error rate. When Ridor algorithm is used for the repository a mix of results were found. This may be because of use of similar attribute in making a rule
for various categories. The words may refer to multiple categories and depending on where they are used, they take the meaning. If such words occurred in the in the text of news, rule generation using Ridor may be affected. Hence some error may get induced which can be seen in the table 14 and table 15 given below.True Positive rate of 80.1% and False Positive rate of 4.6% is achieved with Ridor, Area under ROC is 87.7%.
Table 14 : Confusion Matrix for Ridor
Classified as Education Business Criminal Technology Politics Medical Sports
Education 38 6 3 0 6 0 6
Business 1 104 1 2 13 0 2
Criminal 3 5 67 0 4 3 0
Technology 1 11 0 13 7 0 7
Politics 2 4 10 0 134 1 2
Medical 1 11 1 0 1 28 4
Sports 1 9 1 0 0 0 136
Table 15 : Table Showing True Positive and False Positive Rate of Ridor
Class TP Rate FP Rate Precision Recall ROC Area Education 64.4% 1.5% 80.9% 64.4% 81.4%
Business 84.6% 8.7% 69.3% 84.6% 87.9% Criminal 81.7% 2.8% 80.7% 81.7% 89.4% Technology 33.3% 0.3% 86.7% 33.3% 66.5% Politics 87.6% 6.3% 81.2% 87.6% 90.7% Medical 60.9% 0.7% 87.5% 60.9% 80.1% Sports 92.5% 4.2% 86.6% 92.5% 94.2% Weighted Avg. 80.1% 4.6% 80.9% 79.3% 87.7%
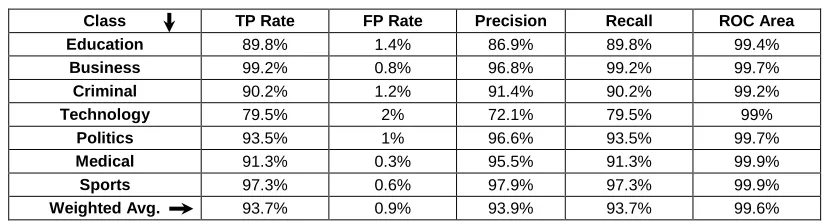
7.6 Performance of J48 Classifier
J48 is widely used classifier. It produces flow chart like tree structure. Internal node denotes a test on attribute and branch represents an outcome of test, and leaf node represent class label. When News repository was
processed for J48, we achieved good accuracy where TP rate is 93.7% and FP rate is 0.9%. This can be seen from table 16 and table 17. However it can be shown that J48 performance is stable which is necessary as News may contain the words which can make decision about class difficult.
Table 16 : Confusion Matrix for J48
Classified as Education Business Criminal Technology Politics Medical Sports Education 53 1 1 2 1 0 1
Business 0 122 0 0 1 0 0
Criminal 1 2 74 3 1 0 1
Technology 4 0 1 31 1 1 1 Politics 3 0 4 2 143 1 0
Medical 0 1 1 2 0 42 0
Table 17 : Table Showing True Positive and False Positive Rate of J48
Class TP Rate FP Rate Precision Recall ROC Area Education 89.8% 1.4% 86.9% 89.8% 99.4%
Business 99.2% 0.8% 96.8% 99.2% 99.7% Criminal 90.2% 1.2% 91.4% 90.2% 99.2% Technology 79.5% 2% 72.1% 79.5% 99%
Politics 93.5% 1% 96.6% 93.5% 99.7% Medical 91.3% 0.3% 95.5% 91.3% 99.9% Sports 97.3% 0.6% 97.9% 97.3% 99.9% Weighted Avg. 93.7% 0.9% 93.9% 93.7% 99.6%
Overall, J48, JRip, PART, OneR and FT algorithms are found suitable for the repository that we have used for training and Testing.
7.7 Allocation of News resource to e-Learning
Resource
Once classified, a news resource is to be made available to the e-Learner. A e-Learning resource is always well categorized. However it is not equipped with the current information or resources, e-content developer also needs scrutinized data to add into the e-contents.
Hence, the news so classified, are represented using various XML tags.. Whenever a learner or developer wants to search for a textual, audio or video news resource, it can search in the repository of News meta data maintained in XML repository form, and when the match is found, it can then directly be referred by e-contents. As the News categories and e-contents are well categorized, hence co-relating the news resources with e-content is easy. With the help of the model that we developed, it is even possible to search the current news ( e.g. news from Google News repository ) and find out a match with e-content of our interest and linked it to the e-content so that learner also can have a reference of current affairs, current information related to the e-content he or she is studying. This dynamicity is getting the references for e-content can help it achieve a goal of making learning interesting for the learner.
8. Conclusions
e-Learning is a need of the day, as everyone wants to get aqventained with the latest things / Technology. In this case it becomes difficult to cater the good faculties who can conduct training session for learner.
Quality of e-Learning depends on e-contents and the material and examples referred. Hence, there will be drastic enhancement in e-Contents when we refer to the latest material available in this regards. For example, if some e-Content refers to the political situation of India, then the references needs to be dynamic as the situation
may change depending on the result of election. This research has designed a model which will help the e-Content to refer the latest information in the form of News to get dynamically attached to e-Contents, hence empowering the effectiveness of the e-Learning process by making latest information available to the learner using the framework that we designed.
In the research, it has been observed that categorization of various news is possible; where in accuracy can be achieved reaching 100%. The News repository has Indian News only. Hence it is to be noted that e-Contents that can refer this framework has to be of the type that are available in the form of classes of the news. These classes can also be increased by collecting and categorizing manually these News into the class of interest. It is to be noted here that depending on complexity of the News and relevance of a class of News with other class, accuracy may vary. But average accuracy of 100% can be achieved, with the help of our frame work for the dataset we used.
References
[1] Bassoppo-Moyo, T.C.,Evaluating e-learning: A front-end, process and post hoc approach. International Journal of Instructional Media, 33(1). Retrieved October 28, 2007, from ProQuest database.
[2] Weihong Huang, Alain Mille, ConKMel: a contextual knowledge management framework to support multimedia e-Learning, Published online: 8 July 2006, Springer Science + Business Media, LLC 2006
[3] SCORM (2003) Advanced distributed learning initiative, sharable content object reference model (SCORM). http://www.adlnet.orgl/
[4] LOM (1999) IEEE P1484.12 learning object metadata working group, learning object metadata. http://ltsc.ieee.org/wg12/
[5] Weihong Huang, David Webster, Dawn Wood and Tanko Ishaya, “An intelligent semantic e-learning framework using context-aware Semantic Web technologies”, British Journal of Educational Technology, Vol 37 No 3, pp 351–373, 2006 [6] Hyunjong Choe, Taeyoung Kim , Chungbuk Korea, "An
Enhanced LTSA Model Providing Contextual Knowledge for Intelligent e-Learning Systems", Journal Information Science and Engineering, 2005, pp. 849-858,
[7] http://en.wikipedia.org/wiki/Classification
Edition, Morgan Kaufmann Publishers is an imprint of Elsevier
[9] Ron Kohavi., The power of Decision Tables. European Conference on Machine Learning (ECML) 1995.
[10] Anil Rajput , Ramesh Prasad Aharwal., J48 and JRIP Rules for E-Governance Data International Journal of Computer Science and Security (IJCSS), Volume (5) : Issue (2) : 2011 201
[11] C. Lakshmi Devasena, T. Sumathi, V.V. Gomathi and M. Hemalatha., Effectiveness Evaluation of Rule Based Classifiers for the Classification of Iris Data Set. Bonfring International Journal of Man Machine Interface, Vol. 1, Special Issue, December 2011
[12] Nada Lavraˇc, Matej Gaˇsperin., Case Study on the use of Data Mining Techniques in Food Science using Honey Samples, February 2007
[13] Daniela Zaharie, Lavinia Perian and Viorel Negru., A VIEW INSIDE THE CLASSIFICATION WITH NON-NESTED GENERALIZED EXEMPLARS, IADIS European Conference Data Mining 2011
[14] Gaya Buddhinath ,Damien Derry., A Simple Enhancement to One Rule Classification Department of Computer Science & Software Engineering University of Melbourne
[15] R.P.Datta, Sanjib Saha., An Empirical comparison of rule based classification techniques based classification techniques in medical databases. 2nd International Congress on Pervasive Computing and Management 12-13, Dec 2009 at Sydney, Australia
[16] Geoffrey Holmes, Mark Hall and Eibe Frank., Generating Rule Sets from Model Trees, Department of Computer Science University of Waikato, New Zealand
[17] M. Thangaraj, C.R.Vijayalakshmi., Performance Study on Rule-based Classification Techniques across Multiple Database Relations. International Journal of Applied Information Systems (IJAIS) – ISSN : 2249-0868 Foundation of Computer Science FCS, New York, USA Volume 5– No.4, March 2013
[18] Trilok Chand Sharma, Manoj Jain., WEKA Approach for Comparative Study of Classification Algorithm. International Journal of Advanced Research in Computer and Communication Engineering Vol. 2, Issue 4, April 2013 [19] Anshul Goyal and Rajni Mehta., Performance Comparison of
Naïve Bayes and J48 Classification Algorithms. International Journal of Applied Engineering Research, ISSN 0973-4562 Vol.7 No.11 (2012)