DOI: 10.1051/0004-6361:20077186
c
ESO 2007
Astrophysics
&
Unveiling the X-ray point source population of the Young Massive
Cluster Westerlund 1
,
J. S. Clark
1, M. P. Muno
2, I. Negueruela
1,3, S. M. Dougherty
4, P. A. Crowther
5, S. P. Goodwin
5, and R. de Grijs
5,61 Department of Physics & Astronomy, The Open University, Walton Hall, Milton Keynes, MK7 6AA, UK
e-mail:[email protected]
2 Department of Physics and Astronomy, University of California, Los Angeles, CA 90095, USA
3 Departamento. de Física, Ingeniería de Sistemas y Teoría de la Señal, Universidad de Alicante, Apdo. 99, E03080 Alicante, Spain
4 National Research Council, Herzberg Institute of Astrophysics, Dominion Radio Astrophysical Observatory, PO Box 248,
Penticton BC. V2A 6K3, Canada
5 Department of Physics & Astronomy, University of Sheffield, Sheffield, S3 7RH, UK
6 National Astronomical Observatories, Chinese Academy of Sciences, 20A Datun Road, Chaoyang District,
Beijing 100012, PR China
Received 29 January 2007/Accepted 3 October 2007
ABSTRACT
Aims.We investigate the nature of the X-ray point source population within the Young Massive Cluster Westerlund 1.
Methods.Chandra observations of 18 ks and 42 ks were used to determine the X-ray properties of emitters within Wd 1, while a comprehensive multiwavelength dataset was employed to constrain their nature.
Results.We find X-ray emission from a multitude of different stellar sources within Wd 1, including both evolved high mass and low mass pre-MS stars. We attribute the X-ray emission from the high mass component to both single stars and colliding wind binaries on the basis of their observed flux and spectral properties, with binaries being systematically harder and more luminous than single stars. We are able to infer a high binary fraction for both WN (10/16) and WC stars (7/8), resulting in a combined Wolf Rayet binary fraction of>∼70%. These represent the most stringent limits currently placed on the binary fraction of very massive (>45M) stars. We place the first observational constraints on X-ray emission from stars transitioning between the Main Sequence and Wolf Rayet phases, finding that both hot (B hypergiants) and cool (yellow hypergiants and red supergiants) spectral types appear to be intrinsically X-ray faint. The B[e] star W9 is found to be X-ray bright and shows similarities to both the X-ray binary SS433 and the Luminous Blue VariableηCarinae. Globally, we find the point source population to be systematically fainter than those found in younger massive star forming regions such as NGC 3603 and R136/30 Doradus, consistent with a loss of the most massive stars to SNe and a reduction in emissivity from the low mass pre-Main Sequence stars. No unambiguous evidence for X-ray emission due to accretion onto relativistic objects of any mass is found, although the current data do not exclude the presence of either a High Mass X-ray Binary or an Intermediate Mass Black Hole accreting at a low rate. Finally, we suggest the progenitor mass for the magnetar CXOU J164710.2-455216 is comparable to that of SGR 1806-20 (∼55M), while that for SGR 1900+14 appears significantly lower (∼15M), implying that magnetars may form from stars with a wide range of initial masses.
Key words.stars: evolution – open clusters and associations: individual: Westerlund 1 – X rays: stars
1. Introduction
Starburst galaxies are strong X-ray sources, with the emission originating in the young stellar population that results from the vigorous ongoing star formation. Characteristically, this activity yields numerous dense Young Massive Clusters (YMCs;Mtot≥
105 M), which one might expect to significantly contribute to the global X-ray emission of their host galaxy. However the cur-rent generation of telescopes cannot spatially resolve YMCs in external galaxies and therefore it is difficult to determine the rel-ative contributions to their X-ray output from diffuse (cluster winds & Supernovae (SNe) remnants) and point (stellar) sources (e.g. Oskinova 2005a).
Partially based on observations obtained at the European Southern Observatory, Paranal and La Silla, Chile (ESO 071.D-0151, 073.D-0327, 0.76.D-0037).
Table 1 and Appendix A are only available in electronic form at
http://www.aanda.org
X-ray emission is associated with both high and low mass stars at many different evolutionary stages, but stellar X-ray pro-duction within YMCs is expected to be dominated by:
• T-Tauri and protostars, which demonstrate magnetic activity resulting in the production of high temperature X-ray emit-ting plasma, with fluxes reachingLX ∼ 1031−32 erg s−1
dur-ing transient flares (e.g. Feigelson & Montmerle 1999; Favata et al. 2005).
• Single OB stars emitting at Lx ∼ 10−7 Lbol (e.g.
1031−33 erg s−1; Long & White 1980; Seward & Chlebowski
1982) via shocks embedded in their stellar winds (e.g. Lucy & White 1980).
• Shocks between the colliding winds of OB+OB and OB+Wolf Rayet (WR) binaries (Lx ∼ 1032−35 erg s−1; e.g.
Pollock 1987).
• The post-SN relativistic remnants of>8 Mprogenitors, via accretion in binary systems (Lx ∼ 1033−39 erg s−1) or, more
quiescentLx ∼1033−36erg s−1; e.g. Meregheti et al. 2004) or
rotational energy (radio pulsars, whereLx ∼1029−36 erg s−1;
e.g. Cheng et al. 2004).
By virtue of their extreme masses, the rich co-eval stellar pop-ulations of YMCs make them important laboratories for the study of such X-ray bright objects. Indeed, by identifying both low mass pre-MS stars and high mass colliding wind binaries (CWBs) X-ray observations may inform studies of the Initial Mass Function (IMF) and binary fraction of such clusters, im-portant parameters for constraining both the formation mecha-nism and long term evolution of YMCs.
Moreover, it is possible that the stellar densities present in such systems may facilitate the formation of “exotic” X-ray emitting objects that are absent from less extreme star form-ing environments. An obvious example would be the putative “Intermediate Mass” Black Holes (IMBHs; 102−4 M
), which,
for example, Portegies Zwart et al. (2004) propose can be pro-duced via the runaway merger of cluster stars and which have been proposed as the central engines of Ultraluminous X-ray Sources (ULXs;Lx≥1039erg s−1).
Consequently, significant effort has been expended determin-ing the X-ray properties of nearby stellar clusters within which individual stellar emitters may be identified. Examples include NGC3603 (Moffat et al. 2002), and the Arches and Quintuplet clusters (Law & Yusef-Zadeh 2004; Rockefeller et al. 2005). However, each of these clusters appears to be at least an or-der of magnitude smaller in mass than typical YMCs, and so it is not immediately clear that they form viable templates for such objects. Recently, optical observations of the Galactic clus-ter Wesclus-terlund 1 (Wd 1; Clark & Negueruela 2004; Clark et al. 2005) have suggested a mass of∼105M
and consequently that
it may be the first example of a YMC in our Galaxy.
At an age of 4−5 Myr (Crowther et al. 2006), Wd 1 is in-triguingly placed at an age between stellar winds and SNe being the dominant cluster wind driver and source of X-ray emission (Oskinova 2005a). Moreover, the combination of age and large mass has resulted in a rich population of short lived transitional objects e.g. Luminous Blue Variables (LBVs), Red Supergiants (RSGs) and Yellow Hypergiants (YHGs), providing the first op-portunity to quantify the X-ray properties of these stellar types, which has hitherto not been accomplished due to the rarity of such stars. Finally, we might expect∼102SNe to have already
occurred in Wd 1 (Sect. 7.1), providing an opportunity to study the final post-SN products of a stellar population of known age, progenitor mass and metallicity.
[image:2.595.335.543.72.379.2]This manuscript is the fourth in a series of papers describ-ing the X-ray properties of Wd 1. Previous papers have de-scribed the detection of the Anomalous X-ray Pulsar (AXP) CXO J164710.2-455216 (Muno et al. 2006a) – which Muno et al. (2007) subsequently demonstrated to be a magnetar – and the properties of the diffuse X-ray emission (Muno et al. 2006c). In this paper we complete the analysis by describing the proper-ties of the point sources and their optical and/or near-IR coun-terparts. An analysis of the X-ray data by Skinner et al. (2006) associates 12 of the point sources with WR cluster members and a thirteenth with the enigmatic emission line object W9. We ex-tend this analysis to include the global properties of the X-ray point sources, while employing new spectroscopic and photo-metric datasets from optical-radio wavelengths to elucidate the nature of the emitters.
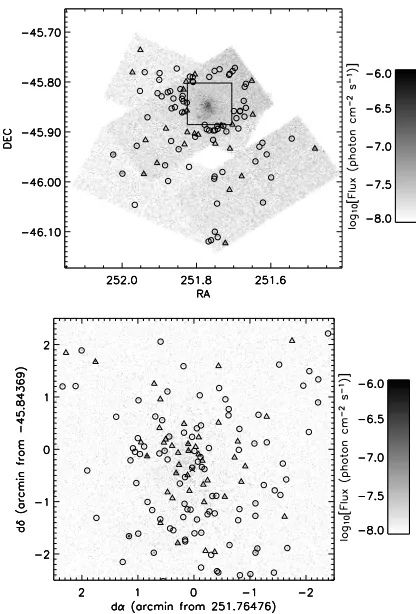
Fig. 1.Top panel: image of the locations of X-ray photons received by CCDs 0, 1, 6, and 7. The X-shaped pattern was produced because the observations were taken with different roll angles, 26◦ in 2005 May and 326◦in 2005 June. The raw count image has been binned by a factor of 4 to enhance the contrast, and then was divided by the exposure map constructed for 2 keV photons. Point-like X-ray sources are indicated with circles and those with optical or IR counterparts by triangles (cf. Sect. 3, Tables 1 and 3). The square indicates the location of the 5×5 field shown in thelower panel. For an adopted distance of 5 kpc the upper and lower panels are on a side∼44 pc and∼7.3 pc respectively.
2. X-ray observations
Wd 1 (l = 339.5, b = −0.4) was observed with theChandra X-ray ObservatoryAdvanced CCD Spectrometer Spectroscopic array (ACIS-S; Weisskopf et al. 2002) on 2005 May 22 for 18 ks (sequence 6283) and 2005 June 20 for 42 ks (sequence 5411). We reduced these observations using standard tools that are part of CIAO version 3.2. First, we created a composite event list for each observation. We corrected the pulse heights of the events for position-dependent charge-transfer inefficiency and excluded events that did not pass the standard ACIS grade filters and ChandraX-ray Center (CXC) good-time filters. We searched for intervals during which the background rate flared to≥3σabove the mean level, and removed one such interval lasting 3.6 ks from sequence 5411. The composite image of the full field we analysed is displayed in Fig. 1, with a smoothed version of the central 5×5region displayed in Fig. 2.
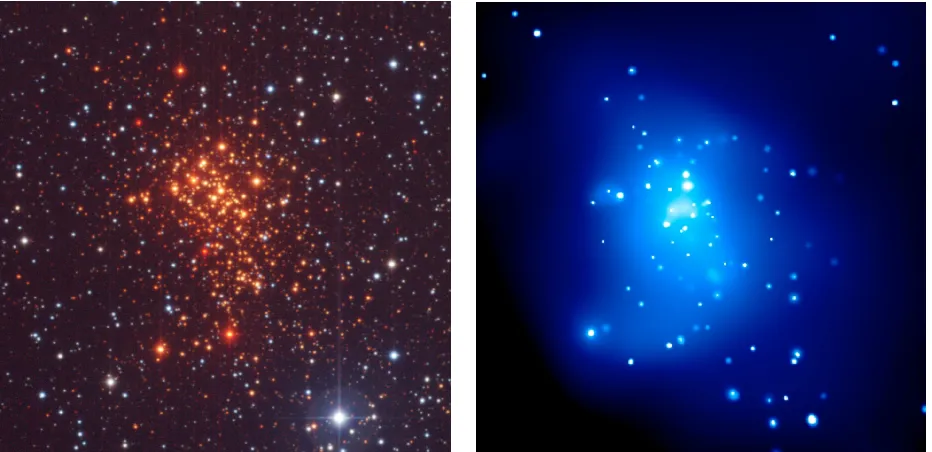
Fig. 2.Comparative plots of the central 5×5(7.3 pc on a side at 5 kpc) region of Wd 1 –left panel: 3 colour optical image (Vband – blue,Rband, green,Iband – red),right panel: smoothed X-ray image from the observations presented here (an analysis of the diffuse emission is presented in Muno et al. 2006c). North is to the top and East to the right in both images.
absorbed by metals in the ISM), and 4−8 keV to provide sensi-tivity to highly-absorbed sources. We searched the three images for each energy band using sequences of wavelet scales that in-creased by a factor of √2: a central, un-binned image of 8.5 by 8.5searched from scales 1−4, an image binned by a factor of two to cover 17by 17searched from scales 1−8, and an image binned by a factor of four to cover the entire field searched from scales 1−16. We used a sensitivity threshold that corresponded to a 10−6 probability of detecting a spurious source per PSF
el-ement, so that we expect only one spurious source in our search of each image (Freeman et al. 2002).
To register the astrometric frame of each observation, the lo-cations of the point-like X-ray sources were compared to the cat-alogue from the Two Micron All-Sky Survey (2MASS). Based on this comparison, we were able to register the frames with an accuracy of 0.15. In order to derive a complete list of X-ray sources, we combined the images from the two observations us-ing the corrected astrometry, re-applied the above search algo-rithm, and combined the resulting source list with those derived by searching the individual observations. The complete list of candidate sources contained 241 objects. Of these there were 70 sources in the May 22 observation, 119 in the June 18 obser-vation, and 25 in the union of the two samples. The remaining 77 faint sources were only found using the combined images.
In order to refine our estimates of the positions of each X-ray source we used the acis_extract routine from the Tools for X-ray Analysis (TARA)1 to compute the mean position of
the counts from each source, and to cross-correlate the image of each source with that of a model PSF for that location (based on the method adopted by Getman et al. 2005). For sources within 5of the aim point, we used the centroid of the counts received as the final position. For sources beyond 5, we used the position derived by cross-correlating the PSF with the source photons.
We checked the positional accuracy by cross-correlating the X-ray sources with the catalogs in Sect. 3. Initially, we used
1 www.astro.psu.edu/xray/docs/TARA/
a search radius given by Eq. (5) in Hong et al. (2005), which we added in quadrature to the 0.15systematic uncertainty. We found that for offsets<5from the ACIS aim point the X-ray po-sition of counterparts to optical/IR sources agreed to within 0.5 in 90% of cases. We take this as our positional uncertainty for offsets <5. It is generally an improvement over the uncertain-ties in the
wavdetect
positions reported by Hong et al. (2005). For larger offsets from the aim point, we found positional uncer-tainties consistent with Hong et al. (2005).2.1. Spatial distribution
The X-ray sources in Figs. 1 and 2 appear to be highly-concentrated toward the core of Wd 1. We can estimate the number that are likely to be associated with the star cluster by comparing the number of X-ray sources in these images to the number inChandraobservations obtained by Ebisawa et al. (2001) of a region of the Galactic Plane atl=28◦andb=0.2◦ that was selected to avoid known concentrations of X-ray emit-ting objects. Based on Monte Carlo simulations described in Muno et al. (2006a), we estimate that we can detect 90% of sources with X-ray fluxes of 6×10⁻⁷ ph cm−2 s−1 within 5 of the aim point in our observations of Wd 1. In the longer Galactic Plane observations of Ebisawa et al. (2001), there are 0.17 sources arcmin−2 at this flux level. Therefore, we expect
only 12 sources brighter than this completeness limit within 5 of the aim point of our observations to be un-associated with Wd 1. Instead, we find 66 sources in the region, for an average density of 1.7 sources arcmin−2.
Under the assumption that the excess X-ray sources are members of Wd1, we can estimate its size and centre from their distribution2. We assumed that the cluster profile had a
Lorentzian shape (see, e.g., Nilakshi et al. 2002), and modeled the distribution by maximising the likelihood that the data would
2 Note that the density of X-ray sources is low enough such that
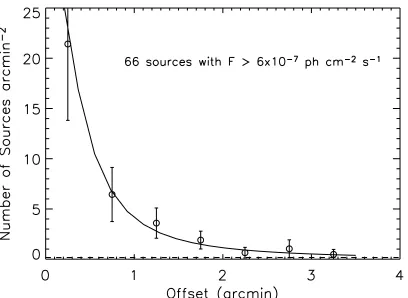
Fig. 3.The binned radial distribution of point sources brighter than our 90% completeness limit. We find the centroid to be atα,δ=16 47 03.7, –45 51 00 (J2000). The solid line is the best-fit Lorentzian model of the
unbinneddistribution, which has a width ofθ0=0.3±0.1 arcmin and a central surface density ofρ0 = 35+−1913sources arcmin−
2. The expected
contribution from the Galactic Plane is indicated by the dashed line.
result from the assumed model. This technique is explained in Cash (1979), and was implemented by minimising
C = −2
i
lnP(θi)
= −2
i
ln ⎛ ⎜⎜⎜⎜⎜ ⎜⎜⎜⎝K1
⎡ ⎢⎢⎢⎢⎢ ⎢⎢⎢⎣ 2πρ0θi
1+θi
θ0
2 +2πρcθi ⎤ ⎥⎥⎥⎥⎥ ⎥⎥⎥⎦ ⎞ ⎟⎟⎟⎟⎟
⎟⎟⎟⎠. (1)
Here,ρ0is the central surface density,ρcis a term denoting the
uniform density of foreground and background sources,θ0is the
width of the spatial distribution, and θi=
(α−α0)2cos2(δ0)+(δ−δ0)2 1/2
(2) is the offset from the assumed center of the cluster, denoted by the free parametersα0, δ0. The probability must be normalised
to 1 overθi = [0, θmax], which is accounted for by the term
K = πρ0θ02ln[1+(θmax/θ0)2]+πρcθ2max. We note that in order
to implement this algorithm, we needed to divide the normaliza-tionρ0out of Eq. (1), so that instead of usingρcas a free
parame-ter, we used the ratioψ=ρc/ρ0. To solve forρ0, we minimizedC
with respect to the free parameters (θ0,α0,δ0, andψ), and then
solved forρ0 by setting the normalizationK to be equal to the
number of sources observed withinθmax =5. The 90%
uncer-tainties were calculated by noting thatCis distributed as aχ2
dis-tribution with 1 degree of freedom. Therefore, we varied each parameter about their best-fit values, allowing the other param-eters to be fit freely, until∆C =1. We then used the upper and lower bounds of the free parameters to compute bounds onK, and in turn onρ0(Lyons 1991).
The best-fit values yielded a constant background source density ofρc < 0.02 sources arcmin−2 (a factor of 10 smaller
than expected from Ebisawa et al. 2001), a full width half max-imum of θ0 = 0.3 ±0.1 arcmin, a central density of ρ0 =
35+19−13sources arcmin−2, and a centroid ofα=16h47m3.4s(±6),
δ = −45◦5116 (±12). The X-ray centroid is consistent with the centroid of optically-detected stars reported by Piatti et al.(1998), and the width is consistent with the 25core radius reported by Clark et al. (2005) and Piatti et al. (1998). Using the observed radial distribution in Fig. 3, we find that there is a significant excess of X-ray sources out to≈2 from the clus-ter centre. This is significantly larger than the 1.2outer radius
reported by Piatti et al. (1998), but consistent with the angular separation of outlying cluster members as determined by Clark et al. (2005)3. For a distance of 5 kpc, angular radii of 0.4and 2
correspond to 0.6 pc and 3.0 pc, respectively; we note that both high and low mass cluster members have been detected at such radii (Clark et al. in prep.; Brandner et al. 2007).
2.2. Photometry
We extracted photometry, spectra, and light curves for each point source using
acis
_
extract
, CIAO version 3.2, and HEASOFT v. 5.2. For each source, we extracted source events from within the 90% contour of the point spread function (PSF). We estimated the background contribution near the sources using annular regions around each point source that ex-cluded ≈92% of the photons from known point sources. The outer radius of each background annulus was chosen so that it contained 100 photons. Source and background spectra were produced from the event lists, and the effective area and response functions were calculated using standard CIAO tools.We computed the net number of counts from each source us-ing four energy bands: 0.5−2.0 keV, 2.0−3.3 keV, 3.3−4.7 keV, and 4.7−8.0 keV. These bands were chosen so that they sampled regions of the effective area function (also known as an ancillary response function, or ARF) with roughly constant areas. The net counts in each energy band were computed from the total counts in the source region minus the estimated local background. The uncertainties on the net counts were computed by summing the squares of the 1-σupper limits from both the source and back-ground counts (Gehrels 1986). We also computed 90% confi-dence intervals through a Bayesian analysis, with the simplifying assumption that the uncertainty on the background was negligi-ble (Kraft et al. 1991). If the 90% confidence interval on the net counts in a band was consistent with 0, we used the 90% upper limit as the uncertainty. For 18 candidate sources, the number of net counts derived in this manner for the full band (0.5−8.0 keV) was consistent with zero, so we removed these from our cata-logue. The complete catalogue of 241 X-ray sources is presented online in Table 1.
We computed approximate photon fluxes (in units of ph cm−2s−1) for each source by dividing the net counts
[image:4.595.74.278.73.222.2](using negative values when they occurred) in each sub-band by the total live time and the mean value of the ARF in that energy range. Note that this value incorporates variations in exposure due to chip gaps and dead columns. The sum of the photon fluxes over all of the bands (0.5−8.0 keV) are listed in Table 1, and are used throughout the paper. Since the energy bands sampled the ARF for the ACIS-I detector well, these photon fluxes differed from those derived from later spectral fits using XSPEC (Sect. 2.4) by no more than the uncertainty expected from Poisson counting noise.
2.3. Variability
Variability would be expected from young stellar objects, CWBs, or compact objects accreting from the winds of mas-sive stars. To search for long-term variability, we searched for sources for which the standard deviation of the two flux mea-surements was larger than 3 times the uncertainty in the diff er-ence. For those sources with few counts (∼10−20) identified as
3 However, it should be noted that both estimates were determined
long term variables, this represents a significant detection in one observation but not the other. To search for short-term variabil-ity on the timescale of hours, we applied a Kolmogorov-Smirnov (KS) test to the un-binned arrival times of the events during each observation. If the cumulative distribution of the arrival times differed from a uniform distribution (which would imply a con-stant flux) with greater than 99.9% confidence in any observa-tion, we considered the source to vary on short time-scales. In total we found that 35 out of 241 objects exhibited significant variability. In Table 1, they they are identified as eitherlong or
short term variables, as appropriate.
As described in Muno et al. (2006a), we searched for pulsars among sources with at least 50 net counts in either observation using the Rayleigh statistic (Z2
1; Buccheri et al. 1983). There
were 8 sources brighter than this count limit in the May observation, and 16 sources in the June observation. This lower limit on the count rate was chosen in order to detect a fully-modulated signal. The brightest source in the field, CXO J14710.2-455216, exhibited a coherent modulation with a pe-riod of 10.6 s and a root-mean-squared amplitude of 53%. None of the other sources exhibited significant signals over periods from 1.7 s to the length of the observation, with sources with between 100 and 500 net counts providing upper limits between
≈50 and 25% rms.
2.4. Spectral analysis
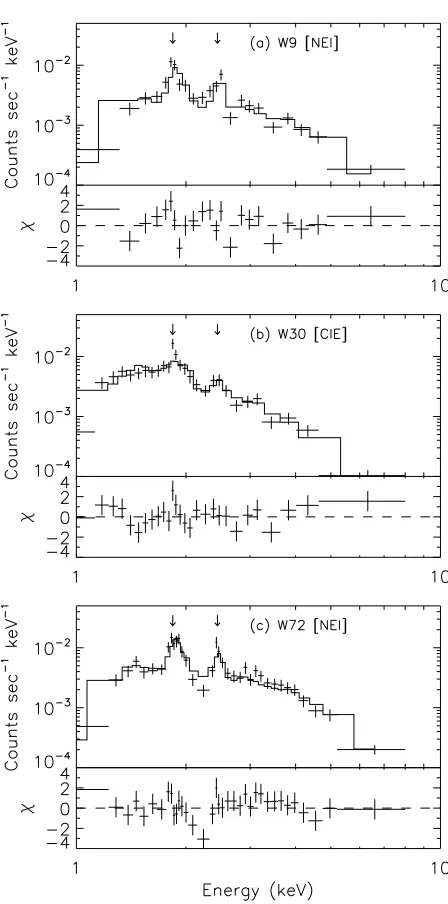
In order to obtain a better understanding of the nature of the X-ray sources, we examined the spectra of the 13 sources that produced at least 80 net counts, noting that in the following anal-ysis the data were adaptively grouped to have>20 net counts per spectral bin. The three brightest stellar sources (WR A, W30a, and W9) exhibit line emission near 1.8 and 2.5 keV (Fig. 4). These lines are near the expected energies of the He-like 2−1 transitions of Si XIII and S XV, which suggests that the X-ray emission is produced by thermal plasma. Therefore, we modeledallthe spectra as plasma absorbed by interstellar gas and dust using the XSPEC version 11.3.1 models “phabs” and “mekal” (Arnaud et al. 1996). We assumed initially that the plasma was in collisional-ionization equilibrium (Mewe et al. 1985, 1986; Liedahl et al. 1995), and that the metals had solar abundances. This model adequately reproduced the spectra of many of the fainter sources. However, for the brighter sources, we found that residuals were present near the positions of the line emission. In three cases (W30a, the magnetar and a fore-ground source, CXO J164656.1−455314), these residuals could be removed by allowing the metal abundances to have sub-solar values.
However, in four sources (most prominently the sgB[e] W9 and the broad lined WR star, WR A) we found that the ener-gies of the observed lines near 1.8 and 2.5 keV were≈20 eV lower than expected from Si XIII and S XV, and that the lines were unusually strong compared to the continuum. We there-fore relaxed the assumption that the plasma was in collisional equilibrium (Borkowski et al. 2001), and found that the result-ing model (“nei”) adequately reproduced the data (followresult-ing the analyis of WR140 by Pollock et al. 2005). The model parame-ters in the most complicated case were the column of inparame-terstellar gas and dust (NH), the electron temperature of the plasma (kT),
the metal abundance of the plasma (Z), the characteristic time scale for ionisation in the plasma (net), and the normalisation
of the plasma emission, which is proportional to the emission measure, nenHdV. The best-fit values for all 13 sources are
[image:5.595.309.533.66.518.2]presented in Table 2. Seven of these sources were found to be
Fig. 4.Spectra of three of the four brightest X-ray sources (the bright-est, the magnetar CXO J14710.2-455216, is displayed in Muno et al. 2006a). Note that W72=WR A. The top panelsdisplay the spectra in detector counts as a function of energy, and therefore the intrinsic shapes of the source spectra are convolved with the detector response. Thebottom panelscontain the difference between the data and the best-fit plasma model, divided by the Poisson uncertainty on the data points. Prominent line emission is evident at 1.8 and 2.5 keV in each spectrum. Model parameters are listed in Table 2.
associated with massive stars within Wd 1 (Sect. 3), while of the other six, one is the magnetar, and the remaining five are likely foreground sources unconnected with Wd 1.
Our qualitative results agree with those of Skinner et al. (2006). Most of the emission is detected above 1 keV, which is not surprising given the high absorption to the cluster. The emission, with kT ≈ 2 keV, is generally hotter than expected for isolated O/WR stars (∼0.5 keV). However, the fluxes rived from our modeling are systematically lower than those de-rived by Skinner et al. (2006). We speculate that this is due to their model fits employing a lower temperature thermal plasma (kT =1 keV) and a higher value ofNH(=3×1022cm−2) than we
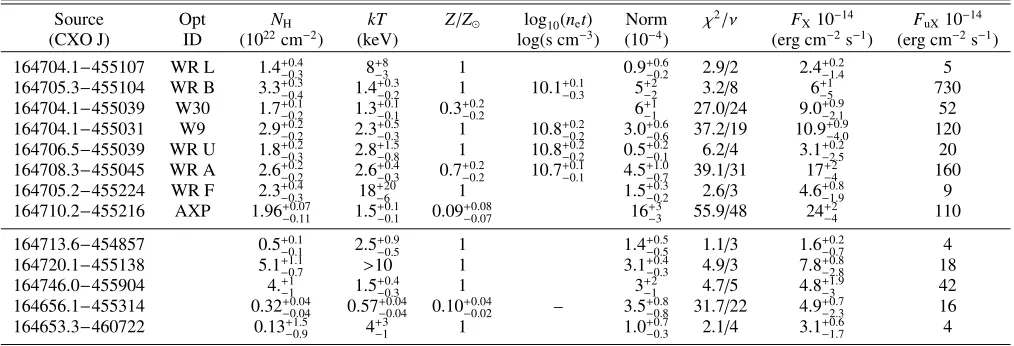
Table 2.Spectral properties of the 13 brightest X-ray point sources. Pre-empting Sect. 3, the upper panel presents those sources associated with the cluster, while the lower panel contains those sources associated with foreground objects. Source IDs are given in Col. 2, the definitions of Cols. 3−5 given in Sect. 2.4 and the normalisation is related to the emission measure by 10−14/4πD2× n
enhdVcm−5. Finally, the observed and un-absorped 0.5–8 keV fluxes are presented in Cols. 9 and 10. X-ray luminosities for individual cluster sources may be obtained by multiplying the final column by 4πD2; given the uncertain distance to the foreground sources we have refrained from presenting these.
Source Opt NH kT Z/Z log10(net) Norm χ2/ν FX10−14 FuX10−14
(CXO J) ID (1022cm−2) (keV) log(s cm−3) (10−4) (erg cm−2s−1) (erg cm−2s−1)
164704.1−455107 WR L 1.4+0.4
−0.3 8+ 8
−3 1 0.9+
0.6
−0.2 2.9/2 2.4+ 0.2
−1.4 5
164705.3−455104 WR B 3.3+0.3
−0.4 1.4+ 0.3
−0.2 1 10.1+ 0.1
−0.3 5+ 2
−2 3.2/8 6+ 1
−5 730
164704.1−455039 W30 1.7+0.1
−0.2 1.3+ 0.1
−0.1 0.3+ 0.2
−0.2 6+
1
−1 27.0/24 9.0+ 0.9
−2.1 52
164704.1−455031 W9 2.9+0.2
−0.2 2.3+ 0.5
−0.3 1 10.8+ 0.2
−0.2 3.0+ 0.6
−0.6 37.2/19 10.9+ 0.9
−4.0 120 164706.5−455039 WR U 1.8+0.2
−0.3 2.8+ 1.5
−0.8 1 10.8+ 0.2
−0.2 0.5+ 0.2
−0.1 6.2/4 3.1+ 0.2
−2.5 20
164708.3−455045 WR A 2.6+0.2
−0.2 2.6+ 0.4
−0.3 0.7+ 0.2
−0.2 10.7+ 0.1
−0.1 4.5+ 1.0
−0.7 39.1/31 17+ 2
−4 160
164705.2−455224 WR F 2.3+0.4
−0.3 18+ 20
−6 1 1.5+
0.3
−0.2 2.6/3 4.6+ 0.8
−1.9 9
164710.2−455216 AXP 1.96+0.07
−0.11 1.5+ 0.1
−0.1 0.09+ 0.08
−0.07 16+
3
−3 55.9/48 24+ 2
−4 110
164713.6−454857 0.5+0.1
−0.1 2.5+ 0.9
−0.5 1 1.4+
0.5
−0.5 1.1/3 1.6+ 0.2
−0.7 4
164720.1−455138 5.1+1.1
−0.7 >10 1 3.1+
0.4
−0.3 4.9/3 7.8+ 0.8
−2.8 18
164746.0−455904 4.+1
−1 1.5+ 0.4
−0.3 1 3+
2
−1 4.7/5 4.8+ 1.9
−3 42
164656.1−455314 0.32+0.04
−0.04 0.57+ 0.04 −0.04 0.10+
0.04
−0.02 – 3.5+ 0.8
−0.8 31.7/22 4.9+ 0.7
−2.3 16
164653.3−460722 0.13+1.5
−0.9 4+ 3
−1 1 1.0+
0.7
−0.3 2.1/4 3.1+ 0.6
−1.7 4
We note that when fitting the spectrum of the magnetar with a thermal plasma, the lack of line emission (low inferred metal abundances) makes it distinctly different from the stellar sources. The spectrum is best described by an optically thick blackbody (Muno et al. 2006a). This suggests that in X-ray observations of other star clusters, pulsars can be selected by searching for sources that lack X-ray line emission and have no optical/IR counterparts.
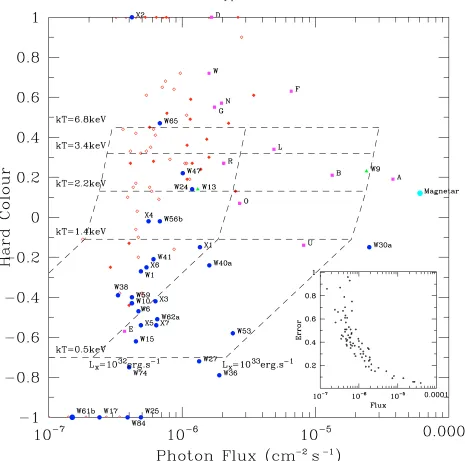
Finally, we computed an X-ray colour forall sources, de-fined as the fractional difference between the count rates in two energy bands, (h−s)/(h+s), wheresis the number of counts in the 0.5−2.0 keV energy band, andhis the number of counts in the 2.0−8.0 keV band. The resulting ratio is bounded by−1 and +1. The hardness ratios are listed in Tables 1 and 3, with uncer-tainties calculated according to Eq. (1.31) in Lyons (1991; p. 26). In Fig. 5, we display the photon flux and hardness of each source. Using the Portable Multi-Mission Simulator (PIMMS)4
and XSPEC, we simulated the colours and fluxes produced by a thermal plasma spectrum absorbed by a column equivalent to 2×1022 cm−2 of H (appropiate for the extinction to the
cluster), for a range of temperatures and intrinsic luminosities (0.5−8.0 keV, assumingD=5 kpc). The resulting grid is over-plotted in Fig. 5.
3. Multiwavelength correlation and spectral classification
We have employed data from a number of other surveys to con-strain the multiwavelength properties of the X-ray point source population of Wd 1. Optical data used here includes the mate-rial published in Clark et al. (2005) and Negueruela & Clark (2005). AdditionalRandIband spectroscopy was obtained on 2004 June 11−13 with FORS2 mounted on the VLT/UT1 and on 2006 February 15−17 with EMMI on the NTT (Negueruela et al., in prep.). JHKs broadband photometric observations of a 4.5×4.5field centred on Wd 1 were obtained with NTT/SofI on 2001 June 9 (Brandner et al. 2007). Additional near-IR nar-row band imaging observations designed to identify cluster WRs
4 http://heasarch.gsfc.nasa.gov/Tools/w3pimms.html
were made on 2004 May 1, with follow up IJ and HK classifica-tion spectroscopy on 2005 June 29−30 (Crowther et al. 2006)5.
3.1. Optical and near-IR cross correlation
To determine the optical/near-IR counterparts of the X-ray sources associated with Wd 1 we have relied primarily on the deepest optical and near-IR photometric datasets avail-able to us which cover a significant proportion of the cluster (Clark et al. 2005; Brandner et al. 2007). Fortuitously, both are complementary to one another. The optical data are sen-sitive down to V ∼ 20 mag, which we expect to correspond to∼O7-8V stars (∼35M; Crowther 2003) and the near-IR data saturates for objects brighter than Ks ∼ 9−10, with ∼O7-8V stars expected to have magnitudesKs∼10−11. Thus the optical data are expected to sample the massive evolved component of Wd 1, while the near IR data sample the Main Sequence, poten-tially down to∼solar mass stars6
The advantage of this approach is that we are utilising well-defined datasets for which the effects of, for example, in-completeness as a result of the crowding in the near-IR data, are well understood. Moreover, the multiwavelength nature of the data, when combined with the spectroscopic information avail-able for a large number of stars, makes both the discrimination of cluster members and their subsequent spectral classification possible. However, the clear disadvantage is that we are limited to the relatively small fields surveyed (e.g.∼4.5×4.5for the SofI field). With a total of 113 X-ray sources within this region, a number of bona fide cluster sources are likely to excluded from this analysis (cf. Sect. 2.1)
5 HST NICMOS data were also obtained for selected fields within the
NTT/SofI fields, but the only counterparts to X-ray sources identified al-ready had optical counterparts (Sect. 3.1) and hence these observations are not described further.
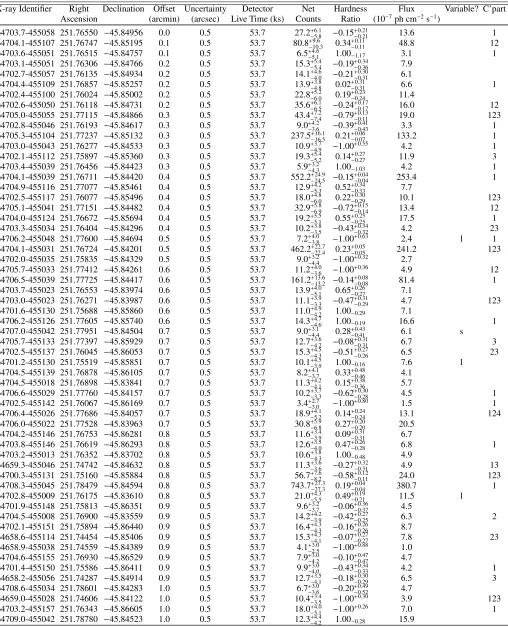
Table 3.Summary of the X-ray and optical properties of the X-ray point sources with high mass stellar counterparts. Columns 1−3 summarise the X-ray nomenclature, photon counts and Hardness Ratio, noting that only 164706.2-455048 was found to be variable in these observations; we highlight this by presenting the photon count in italics. Column 4 is the number of the source on the finding chart (Fig. 6); westronglyadvise that these numbers should not form the basis for a new naming convention. Column 5 contains the optical designation (sources with 2MASS or Piatti et al. (1998) designations are indicated), with Cols. 6−9 presenting relevant broadbandBVRIphotometry. The current spectral classifications for the counterparts are given in Col. 10, noting that for those sources for which no entry is given but for which photometric data are available, we predict a spectral classification earlier than B0.5Ia (Sect. A.3). Finally, in Col. 11 we flag those stars which Bonanos (2007) find to beEclipsing,
Periodic orAperiodic photometric variables.
X-ray Identifier Counts HR Finder Opt. ID B V R I Spec Type Var.?
164703.7-455058 27.2+6.1
−5.8 −0.15+ 0.21
−0.21 1 C07-X1 20.4 18.35 16.18 13.66
164704.1-455107 80.8+9.6
−10.3 0.34+ 0.11
−0.11 2 WR L 22.6 18.86 15.61 12.52 WN9h: A
164702.7-455057 14.1+4.6
−4.0 −0.21+ 0.30
−0.31 3 W41 21.3 17.87 15.39 12.78 O9-9.5Ia
164704.4-455109 13.9+3.8
−4.8 0.02+ 0.31
−0.31 4 – – – – –
164702.6-455050 35.6+6.1
−6.5 −0.24+ 0.17
−0.17 5 W40a 22.2 18.05 15.38 12.73 OB SG
164705.0-455055 43.4+7.2
−7.4 −0.79+ 0.13
−0.11 6 W36 22.8 18.89 16.09 13.38 E
164702.8-455046 9.0+4.2
−3.6 −0.39+ 0.41
−0.43 7 W38 23.2 19.10 16.47 13.81
164705.3-455104 237.5+16.1
−16.5 0.21+ 0.06
−0.07 8 WR B – 20.99 17.50 14.37 WN7o E
164703.0-455043 10.9+3.7
−4.9 -1.00+
0.55 9 – – – – –
164702.1-455112 19.3+5.4
−5.2 0.14+ 0.27
−0.27 10 W24 23.0 18.71 15.96 13.24 O9-9.5Ia
164703.4-455039 5.9+3.2
−4.3 1.00−1.03 11 C07-X2 23.1 19.55 16.71 13.95 164704.1-455039 552.2+24.9
−24.5 −0.15+ 0.04
−0.04 12 W30a 22.4 18.45 15.80 13.20 O9-B0.5Ia bin
164702.5-455117 18.0+4.8
−6.0 0.22+ 0.30
−0.29 13 W47 22.7 19.95 16.36 13.68
164705.1-455041 32.9+5.8
−6.9 −0.72+ 0.15
−0.14 14 W27 21.5 17.94 15.35 12.80 OB SG
164704.0-455124 19.2+5.5
−5.1 0.55+ 0.25
−0.25 15 WR G – 20.87 17.75 14.68 WN7o A
164703.3-455034 10.2+3.8
−3.5 −0.43+ 0.34
−0.32 16 W10 – – – – O9-B0.5Ia SB2 A
164706.2-455048 7.2+4.0
−3.8 −1.00+
0.63 17 W17 22.7 18.87 16.19 13.56
164704.1-455031 462.2+22.7
−22.4 0.23+ 0.05
−0.05 18 W9 21.8 17.47 14.47 11.74 sgB[e] A
164705.7-455033 11.2+4.0
−3.6 −1.00+
0.36 19 W25 21.9 17.85 15.22 12.61 OB SG A
164706.5-455039 161.2+13.6
−13.2 −0.14+ 0.08
−0.08 20 WR U 23.7 19.81 16.98 13.99 WN6o
164703.0-455023 11.1+3.9
−3.3 −0.47+ 0.31
−0.29 21 W6 22.2 18.41 15.80 13.16 O9-B0.5Ia bin P
164706.2-455126 14.3+4.7
−4.6 1.00−0.19 22 WR D – – – – WN7o A
164705.7-455133 12.7+3.6
−4.2 −0.08+ 0.31
−0.31 23 2MASS – – – – E
164702.5-455137 15.3+4.5
−4.3 −0.51+ 0.27
−0.26 24 W62a – – – – O9-9.5Iab A
164706.6-455029 10.2+3.7
−3.3 −0.62+ 0.30
−0.28 25 W15 22.8 18.96 16.38 13.75 O9-9.5Ia A
164706.4-455026 18.9+4.1
−5.2 0.14+ 0.24
−0.24 26 W13 21.1 17.19 14.63 12.06 BIa+ E
164706.0-455022 30.8+5.9
−6.8 0.27+ 0.20
−0.20 27 WR R – – – – WN5o A
164703.8-455146 12.6+3.5
−4.0 0.47+ 0.26
−0.28 28 W65 22.9 18.73 16.27 13.68
164659.3-455046 11.3+3.6
−3.6 −0.27+ 0.32
−0.31 29 W1 21.9 18.37 16.09 13.65
164700.3-455131 56.7+7.6
−8.2 −0.58+ 0.12
−0.11 30 W53 22.9 18.51 15.80 13.13 P
164708.3-455045 743.7+27.3
−27.3 0.19+ 0.04
−0.04 31 WR A – 19.69 16.59 13.68 WN7b P
164704.5-455008 14.2+4.2
−3.9 −0.42+ 0.27
−0.25 32 C07-X3 21.9 18.89 16.37 13.76 O9-9.5Ia A
164658.6-455114 15.3+4.3
−4.1 −0.07+ 0.27
−0.27 33 p83 – – – –
164701.4-455150 9.9+3.0
−4.0 −0.43+ 0.34
−0.33 34 W59 23.1 18.97 16.33 13.64
16468.2-455056 12.7+3.5
−4.1 −0.18+ 0.30
−0.29 35 2MASS – – – –
164659.0-455028 10.4+3.4
−3.5 −1.00+
0.30 36 W84? 21.3 17.82 15.60 13.63
164707.0-455012 9.3+3.4
−3.2 −0.75+ 0.29
−0.24 37 W74 – – – – O9-9.5Ia A
164701.0-455006 14.5+3.9
−4.1 −0.43+ 0.26
−0.25 38 – – – – –
164708.9-455029 8.7+3.2
−3.8 −0.09+ 0.40
−0.42 39 2MASS – – – –
164658.8-455145 14.5+3.9
−4.2 −0.02+ 0.28
−0.28 40 W56b 22.8 18.88 16.36 13.76
164707.8-455147 14.5+3.9
−4.2 0.40+ 0.25
−0.27 41 – – – – – A
164705.9-455208 8.0+4.0
−3.3 −0.57+ 0.39
−0.40 42 WR E – – – – WC9 A
164702.7-455212 12.3+3.8
−3.7 −0.02+ 0.30
−0.31 43 C07-X4 23.5 19.29 16.69 14.09 O9-9.5Iab
164705.2-455224 109.6+10.9
−11.3 0.63+ 0.08
−0.08 44 WR F 21.7 17.86 15.39 12.90 WC9d A
164706.9-454940 12.6+3.6
−4.0 −0.33+ 0.29
−0.28 – – – – – – A
164702.3-455233 9.9+2.8
−3.8 −0.54+ 0.31
−0.28 45 C07-X5 22.6 18.96 16.43 13.81
164701.4-455235 11.9+3.1
−4.2 −0.25+ 0.30
−0.29 46 C07-X6 21.3 17.53 15.25 12.85 A
164711.5-455000 5.1+3.1
−2.5 1.00−0.49 – – – – – –
164707.6-455235 54.5+7.7
−8.1 0.07+ 0.14
−0.14 – WR O – – – – WN6o A
164707.6-454922 21.1+5.2
−4.8 0.72+ 0.16
−0.19 47 WR W – – – – WN6h
164654.2-455154 9.7+3.0
−3.6 −0.54+ 0.32
−0.29 – C07-X7 23.6 18.93 16.08 13.26
164707.8-455147 14.5+3.9
−4.2 0.40+ 0.25
−0.27 – – – – – –
164659.8-455525 11.3+3.7
−3.6 0.57+ 0.25
Fig. 5.Hardness-intensity diagram illustrating the spectral properties as a function of intensity for the X-ray point sources within the 5×5field centred on Wd 1. The colours are defined as (h−s)/(h+s) wherehare the counts in the 2.0−8.0 keV band andsare the counts in the 0.5−2.0 keV band. Errorbars are not shown for reasons of clarity but are inversely correlated to flux and are given for individual sources in Tables 1 and 3; the error in the hardness colour as a function of photon flux is also shown in the subpanel. Symbols are coded on the basis of their optical/ near-IR counterparts: violet squares – WRs, green triangles – transitional stars, blue circles – OB supergiants and red diamonds – sources without counterparts (assumed to low mass pre-MS stars). For this final subset of sources the (empty) filled symbols represent (non) variable emission. The grid of dashed lines illustrate the fluxes and colours expected for a thermal plasma with the temperatures and luminosities indicated, absorbed byNH=2×1022cm−2at an assumed distance of 5 kpc.
Since the stellar source list derived from Clark et al. (2005) is known to be incomplete due to the effects of blending, stars falling in the gap between the twin CCDs, and the detection of faint stars in only a subset of wavebands, we supplemented the stellar source list with the photometric datasets of Piatti et al. (1998), the USNO-B1.0 survey (Monet et al. 2003) and the 2MASS catalogue (Cutri et al. 2003; noting that our near-IR dataset is significantly deeper). Finally, we also included those stars for which no photometric data were available, but spectro-scopic data suggested were bona fide cluster members such as the optically faint WR population.
Initially, we attempted an automated cross correlation be-tween the positions of all the X-ray sources given in Table 1 and our combined stellar source list, employing a search radius of 0.57. Where available, photometric data were used to ex-clude foreground objects, notably four stars with USNO-B1.0 B-band detections. Subsequently, we relaxed the search radius
7 For completeness, a cross correlation betwen the 2MASS and
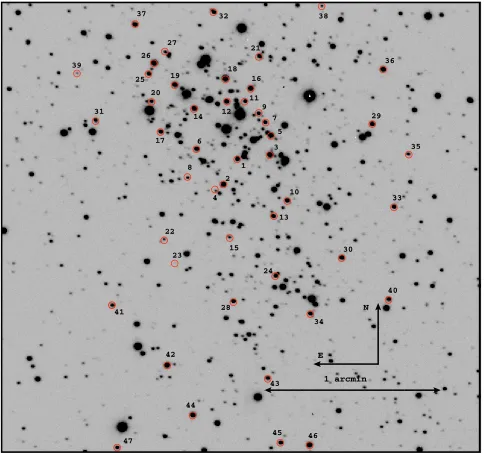
Fig. 6.Finding chart for the X-ray sources with optical counterparts in the crowded inner region of Wd 1. The image is in theRBand and taken with VLT/FORS1 in∼0.6seeing conditions. Note that the size of the circles does not correspond to the positional uncertainty of the X-ray sources and is merely illustrative.
to 1and again utilised photometry to exclude interlopers, yield-ing an additional 6 potential candidates. The complete source list was then examined by eye in the deepR-band image presented in Fig. 6 to check for possible source confusion. A final total of 53 candidate cluster members are found to be associated with X-ray point sources, given in Table 3. We note that by randomly shifting the locations of the X-ray sources, we established with 90% confidence that at most four of these matches are spurious. Of the final counterpart list, seven stars with X-ray emission lack both spectroscopic and photometric confirmation of clus-ter membership (the latclus-ter due to blending). These have been retained in order to exclude them from consideration as poten-tial low mass stars (see below), but are not considered further in any subsequent analysis. An additional four stars were identified as cluster candidates via 2MASS or Piatti et al. (1998) colours and magnitudes. These are identified in Table 3. X-ray emission
was also associated with seven hitherto anonymous cluster members for which additional data are available. We have des-ignated these as C07-X1 through C07-X7 in Table 3. Finally, where possible, we utilised our combined spectroscopic and photometric datasets to provide spectral classifications for the optical counterparts to the X-ray sources. This procedure is de-scribed in detail in Appendix A and the results presented in Table 3.
X-ray sourcesor IR sources find that chance associations be-tween the sources account for an average of 3.3 of these asso-ciations8. Therefore, we conclude that only∼7 of the 60 X-ray
sources are associated with an IR source and that there is no statistically significant association between the vast majority of X-ray sources that lack optical counterparts and the IR sources. Thus we may associate the X-ray sources with no IR counter-part with a (stellar) population with apparent Ks band mag-nitudes ≥16. All we may conclude regarding the ∼7 sources with IR counterparts is that they have Ks magnitudes in the range∼9−16.
3.2. Photometric variables
Of the 53 X-ray bright high mass cluster members, 24 are iden-tified by Bonanos et al. (2007) as variable (Table 3). These are broken down into 4 eclipsing systems, 3 periodic and 17 aperi-odic variables. Based on the results presented in Appendix A, of the 4 eclipsing systems we may refine the classification of W13 to early B hypergiant and photometrically classify W17 as earlier than B0 Ia. While periodic variability might be at-tributed to stellar pulsations, of the 3 systems exhibiting this be-haviour Crowther et al. (2006) identify the spectroscopic signa-ture of an OB companion to WR A, while the optical spectrum of W6 is also suggestive of a short period interacting binary (Appendix A), as are the X-ray properties of W53 (Sect. 4.3). Therefore, we prefer an explanantion of either ellipsiodal mod-ulation and or wind perturbation via binary interaction for the variability in these sytems. The remaining aperiodic variables comprise WRs, OB SGs and the sgB[e] star W9; it appears likely that more than one physical mechanism causes the variability.
4. The high mass stellar sources
TheChandra X-ray observations of Wd 1 reveal a rich popu-lation of X-ray point sources of assumed stellar origin. Given that at an age of∼4−5 Myr a number of physical mechanisms could lead to this emission, we have coded the flux/hardness ra-tio plot for sources within the central 5×5field (Fig. 5) with the spectral classification of their optical counterparts in order to determine the nature of the emission. Furthermore, we iden-tify those sources for which no optical or IR counterparts are found, delineating the subset of these that show variability. Note that only one source with an optical counterpart is found to be variable – the O SG binary W17 (Sect. 4.3).
Sources are segregated in Fig. 5 on the basis of the optical counterparts, or lack thereof. With the exception of the faint, variable source associated with WR E, the WR stars are as-sociated with hard (hardness colour>∼−0.1), relatively bright sources (photon flux>∼10−6cm−2s−1). The two transitional stars
detected also have similar X-ray properties. The OB SGs appear to be significantly softer and/or fainter, with the notable excep-tion of W30a (see Sect. 4.3). We assume that those sources lack-ing counterparts are low mass (<1.5M; Sect. 5) pre-MS stars (Sect. 5). The majority of these are found to be uniformly faint (photon flux<∼10−6cm−2s−1) and hard (hardness colour>∼−0.3).
A subset of OB SGs and WRs are found within the periphery of this region. It is unclear if the emission from these object is in-trinsic to the massive star or is the result of an unseen low mass companion.
8 We note that randomly distributing either the X-ray or IR sources
does not account for the obvious clustering in both, however including this clustering wouldincreasethe number of chance associations.
Globally, we find the X-ray point sources within Wd 1 to be systematically fainter than those of the massive clus-ter NGC 3603 (Moffat et al. 2002) and the Carina (Albacete Colombo et al. 2003) and 30 Doradus (Townsley et al. 2006a) star forming regions. While all four regions host early-type stars with a wide range of intrinsic X-ray luminosities (∼two orders of magnitude), Wd 1 lacks stellar sources with lumi-nosities significantly in excess of 1033 erg s−1, while the other three younger stellar systems all contain sources of between 1034−1035erg s−1. This finding is consistent with the prediction of Oskinova (2005a) for a rapidly diminishing contribution from stellar point sources with age as the high mass objects with pow-erful winds are lost to SNe, and the emission from low mass stars decreases with magnetic activity (Sect. 5).
4.1. The Wolf Rayets
We find 12 of the 24 WR stars within Wd 1 to be X-ray sources, while Skinner et al. (2006) associate emission with 13. There are 11 sources in common between the two studies. Skinner et al. include W9 within their sample, which we formally classify as a sgB[e] star (albeit a likely binary Sect. 4.2.1), while we find the association of X-ray emission to be in error for the WC star WR K9. We identify emission from the newly discovered WN6o
star WR U10, which is a bright, non variable source with a hard
spectrum (kT =2.6 keV; Table 2).
We find that the distribution of the spectral subtypes of X-ray bright WRs is formally consistent with being drawn from the parent population, although we highlight that neither of the two WN8 stars were detected with the
wavdetect
algorithm em-ployed for source selection (Sect. 2), mirroring previous non de-tections of such stars in X-rays (Oskinova 2005a). To the best of our knowledge WRs F and N represent the first X-ray detections of WC9d stars.Based on the high temperatures implied by the spectral fits, Skinner et al. (2006) propose that a significant number of the WN stars are likely to be (colliding-wind) binaries. Moreover, Oskinova et al. (2003) demonstrate that no single WC star is known to be an X-ray source. Thus the X-ray detections of WR E, F and N indicate that they are likely binaries. The pres-ence of hot dust, resulting in excess IR emission, is thought to be another indicator of binarity for WC stars, with Williams et al. (2005) proposing that the high densities that characterise the wind-interaction regions of CWBs are required for dust con-densation. Analysis of the spectral energy distributions of the WCs (Crowther et al. 2006) shows that with the exceptions of WR E and K, all have excess near to mid-IR emission and are therefore strong binary candidates even in the absence of X-ray emission from all but WR N & F. Finally, the∼flat (α ∼0 for Sν ∝ ν−α) radio spectra of WR A, B and V imply contribu-tions from both thermal+non thermal emission mechanisms as expected for CWB systems (Dougherty et al. 2007). Such a re-sult is of particular interest for WR V as to date it shows no other indication of binarity.
Including the WN10-11h/BIa+ star WR S, of the 16 WN stars, 9 are observed to be hard X-ray sources, while WR V demonstrates a composite radio spectrum. This implies a binary fraction of>∼63% for WN stars although only
9 The position of the X-ray source attributed by Skinner et al. (2006)
is found to be∼2.3to the West of the position of WR K in Crowther et al. (2006).
10 Note that WRs #1 & #3 of Groh et al. (2006) are our WR U &
Table 4. Limits on the count rates from spectroscopically-identified stars. Limits on the luminosities can be derived by noting that 1 count is equivalent to 2×1030erg s−1for a 3 keV plasma atD=5 kpc, and 1×1031erg s−1for a 0.5 keV plasma. As with Table 3, we also flag the photometric variables identified by Bonanos (2007) in Col. 6. Note that list is incomplete due to WR J and K being too close to nearby X-ray sources for meaningful limits to be determined.
ID Spectral RA Dec Cnet Var.?
Type
4 F2Ia+ 251.75592 −45.84364 <4.3 A
7 B5Ia+ 251.76508 −45.83728 <5.9 A
8 F5Ia+ 251.76996 −45.84025 6.8+6.0 −5.9 A 12 A5Ia+ 251.75922 −45.84967 <3.6 A 16 A2Ia+ 251.77754 −45.84503 <3.7 A 20 <M6I 251.76958 −45.85661 <5.0 A 26 <M6I 251.77251 −45.84347 <5.5 32 F5Ia+ 251.76529 −45.84542 <6.3 33 B5Ia+ 251.76717 −45.84675 <7.0 A 42 B5Ia+? 251.76353 −45.84781 <4.1 A
57 B3Ia 251.75563 −45.86267 <5.8 A
70 B3Ia 251.78900 −45.84711 <5.6 A
71 B3Ia 251.78517 −45.84703 <4.4 A
75 <M6I 251.78667 −45.83289 <5.3 237 <M6I 251.76286 −45.87189 <4.7 A 243 LBV 251.78146 −45.87458 7.0+5.5
−5.8 A 265 F5Ia+ 251.77608 −45.82325 <3.7 A
C WC9d 251.76833 −45.85106 <7.9 H WC9d 251.76708 −45.85556 <6.4 I WN8o 251.75696 −45.85553 <6.6 M WC9 251.76649 −45.86042 <8.1 P WN8 251.75626 −45.86250 <5.5 Q WN6o 251.73084 −45.85944 6.3+5.8
−4.7 S WN10-11h 251.76237 −45.83875 4.0+5.3
−3.7 A
T WC9d 251.69292 −45.79944 <6.4 A
V WN8o 251.76588 −45.84408 22.0+9.0 −9.0 X WN5o 251.80875 −45.80888 6.0+5.0
−4.0
WR A & B show unambiguous signatures of binarity (spectro-scopic and photometric, respectively). Of the 8 WC stars, 6 are found to have an IR excess, while the apparently dust free star WR E is an X-ray source, suggesting a binary fraction of>∼88%. Thus we find a lower limit to the total WR binary fraction of 70%11 However, since some WC binaries are episodic dust
makers (e.g. see Williams et al. 2005) we suspect that long-term near-IR monitoring – combined with a long term radial velocity survey – will reveal that the WR binary fraction probably approaches unity.
4.2. The transitional stars
The age and mass of Wd 1 results in a uniquely rich population of hot and cool transitional stars, and as such these observations represent the first systematic survey of the X-ray properties of many of these rare spectral types. The detected stars have already
11 Of the 17 WR binary candidates, 11 are found to be
photometri-cally variable by Bonanos (2007), whereas only one of the 7 apparently single WRs is found to be. We therefore speculate that the causes of the periodic and aperiodic variability in the WRs is related to binarity, possibly due to elipsoidal modulation and/or wind perturbation.
been summarised in Table 3; Upper limits12 for the remaining transitional stars are given in Table 4.
4.2.1. The sgB[e] star W9
The high X-ray luminosity of W9 and the similar spectrum to WR A suggests that it too is a binary. However, unlike WR A, there is no unambiguous corroboration for a CWB identifica-tion in either the optical or radio data (Dougherty et al. 2007). An alternative explanation for the X-ray emission is accre-tion onto a compact companion. Two high mass X-ray binaries (HMXBs) contain sgB[e] primaries; XTE 0421+560/CI Cam and IGR J16318-4848 (e.g. Clark et al. 1999; Filliatre & Chaty 2004), both of which also demonstrate rich emission line spec-tra. Additionally, while not formally classified as a sgB[e] star, the spectrum of the HMXB SS433 also shows line emission of comparable strength to W9, along with an IR excess attributable to hot dust (e.g. Clark et al. 2007). In such a scenario the low luminosity and lack of variability evidenced by W9 might be explained by the observations coinciding with the long periods of X-ray quiescence between short lived outbursts exhibited by both CI Cam and IGR J16318-4848. Indeed the quiescent lu-minosity reported for CI Cam (L1−10 keV ∼ 1033erg s−1; Boirin
et al. 2002) is directly comparable to that of W9.
However, a serious objection to such an hypothesis is the comparative lack of local extinction to the X-ray emitter within W9. Both HMXBs with a sgB[e] primary demonstrate NH ≥
1024 cm−2 (e.g. Filliatre & Chaty 2004), which is attributed to
the accretor being deeply embedded within the circumstellar envelope of the mass donor. Given the presence of circumstel-lar ejecta, and a dense outflow inferred from radio observations ( ˙M ∼ 10−4 M
yr−1: Dougherty et al. 2007) it is difficult to
reconcile the presence of an accretor with the low intrinsic ab-sorption (NH∼1022cm−2) unless it is in a wide orbit. However,
the lack of local extintion also proves similarly problematic for a CWB identification.
Finally we note that either binary hypothesis could ac-commodate the high velocity outflow inferred from the optical He
i
profiles (Sect. A.2), which might arise from the system pri-mary in both scenarios (cf.ηCar), an evolved, possible WR com-panion (CWB) or from an accretion driven outflow (cf. SS433; e.g. Clark et al. 2007). We suspect that as withηCar, a com-bination of high spatial resolution spectroscopy and long term monitoring will be required to establish the viability of W9 as a binary, and the nature of its putative components.4.2.2. The B hypergiants and the LBV W243
As with W9, the emission from the BIa+star W13 appears too hard to be attributed to a single star and the discovery of pho-tometric eclipses by Bonanos (2007) provides compelling evi-dence for its identification as a CWB. None of the cooler B hy-pergiants (W7, 33 & 42) are found to be X-ray sources, while the LBV W243 is only a weak detection.
Oskinova (2005a,b) and Muno et al. (2006b) provide use-ful summaries of existing X-ray observations of LBVs, show-ing emission to vary over ∼three orders of magnitude from 1034−35erg s−1(thebinariesηCar and HD 5980) to<1032erg s−1
(P Cygni, the Pistol Star and FMM362). While LBVs are thought
12 These were obtained by searching for additional X-ray sources at
to have highly structured radiatively driven winds (Davies et al. 2005), it is likely that the relatively low terminal velocities ob-served in cool states (≤200 km s−1; BIa+) are not high enough to
generate X-ray emitting material via wind shocks in single stars, although wind velocities in the hot state (≤500 km s−1; very late
WN subtype)mightsuffice (Pittard & Corcoran 2002)13.
Moreover, due to their high densities, the winds of LBVs are likely to efficiently absorb any low energy X-ray emission gen-erated via shocks. As an extreme example, Pittard et al. (1998) show that the column depth of the wind fromηCar can reach NH ∼1023 cm−2during X-ray eclipse. Thus even if a luminous
companion is present, an LBV (or B hypergiant) CWB may be an intrinsically faint X-ray source. Consequently we suggest that the apparent lack of X-ray emission from the hot transitional stars within Wd 1 is due to a combination of their current wind properties (low velocity, high density) and/or the lack of a bi-nary companion, and that outside of the hot state, X-ray emission from such stars will likely signify binarity.
4.2.3. The A-M super/hypergiants
Achmad et al. (1997) investigated the wind properties of lumi-nous A-G stars and found that for A SGs (Teff ∼9500−8000 K) the observations were well matched by radiatively driven out-flows. However, the wind velocities are probably too small to yield significant X-ray emission from shock heating, explain-ing our non detections of W12 & 16. Unfortunately, “quiescent” wind parameters for F & G super-/hypergiants are poorly con-strained, although it appears likely that despite their apparently highly structured outflows (e.g. Lobel et al. 2003), wind veloci-ties are again likely to be insufficient to generate X-ray emitting plasma from shock heating.
An alternative source of X-ray emission might be a puta-tive high temperature chromosphere/corona. A subset of G su-pergiants have long been known to be X-ray sources, with solar-like far UV spectra dominated by high excitation species indi-cating the presence of a high temperature chromosphere (Ayres et al. 2005, and references therein). However, compared to these “active” supergiants, a second subset of “inactive” stars show UV spectra dominated by much lower excitation species and blueshifted absorption components in the chromospheric reso-nance lines suggestive of the presence of a cool dense wind. High excitation linesarepresent in their far-UV spectra, although sig-nificantly weaker than in the “active” stars.
Hartmann et al. (1980) denoted these objects as “hybrid chromospheric stars” due to the apparent coexistence of both high and low temperature regions within their circumstellar en-vironments. Subsequent X-ray observations also revealed emis-sion from such “hybrid”’ stars, although at a lower level than “active” stars of similar spectral type (Lx/Lbol ∼10−8and 10−6
respectively; Ayres et al. 2005). The difference is attributed to absorption of the X-rays by the dense cool winds of the ‘hybrid’ stars, which the “active” stars lack (Ayres 2005).
However, the ∼G0Ib stars observed by Ayres et al. have evolved from substantially less massive stars (∼5−9 M) than the Wd 1 YHGs, and thus it is not clear whether the latter should possess chromospheres. Observations of ρ Cas are inconclu-sive but suggest that apermanentchromosphere is likely absent
13 The post shock temperature is given byT =(3/16)(m/k)v2, wherek is the Boltzmann constant,vthe wind velocity, andmis the average particle mass. For a fully ionised plasma with solar abundances, and adoptingm=10−24g,kT =0.05 keV forv=200 km s−1and 0.3 keV for 500 km s−1.
(Lobel et al. 2003). Given the sensitivity of our observations, if the Wd 1 YHGs were as X-ray bright as the “active” G super-giants observed by Ayres et al. (2005) they would have been de-tected14. Hence the lack of emission in W4, 32 and 265 suggests
either the absence of a chromosphere/corona of sufficient tem-perature to generate X-rays and/or the presence of a dense cool wind that attenuates any emission. Such a dense outflow is sug-gested by the detection of radio emission associated with each YHG (Dougherty et al. 2007). Clearly, the confirmation of emis-sion associated with W8 is of considerable interest in resolving whether YHGs can support high temperature chromospheres and hence coronal X-ray emission. Interestingly, W8 has no radio de-tection from a putative externally ionised wind.
Finally we turn to the M type SGs within Wd 1. Such stars are known to possess a chromosphere (e.g.αOri; Hartmann et al. 1984), although of such low temperature (Lobel & Dupree 2000; Dupree et al. 2005) that X-ray emission would be unexpected. In any event, the dense cool winds expected for such stars (e.g. Crowther 2003) would totally veil any putative X-ray emission from a chromosphere and hence the lack of X-ray detections for the RSGs within Wd 1 is unsurprising.
4.3. The OB supergiants
Following the results of Clark et al. (2005; also Sect. A.3.1) we expectindividualOB SGs within Wd 1 to have∼40 M pro-genitors, and hence bolometric luminosities in the range 3−5× 10⁵L
. Then assuming they follow the empiricalLx∼10−7Lbol
relation we should expect them to lie on theLx ∼1032 erg s−1
locus in Fig. 5, with a hardness colour of∼−0.5, appropiate for the canonical 0.6 keV expected for shock-heated material within O star winds (Feldmeier et al. 1997).
Unfortunately, the 90% completeness limit for a 0.6 keV emitter is 2×1032 erg s−1 (assuming D = 5 kpc and N
H =
2×1022cm−2), hence we are likely incomplete for emission for
single OB supergiant stars. Given the lack of a complete census of OB SGs (cf. Negueruela et al. in prep.) and the potentially significant scatter in the X-ray luminosities of stars of a given bolometric luminosity (cf. NGC 3603; Moffat et al. 2002), we are currently unable to quantify the degree of incompleteness or the global X-ray properties of the population of OB supergiants detected here15.
Moreover, due to the low count rates, uncertainties on the hardness ratio are large for photon fluxes <10−6 cm−2s−1.
Nevertheless, for those sources with photon fluxes below this value we find that the majority of OB SG detections have a hard-ness ratio within 1σof∼−0.5, consistent with emission from single stars. However, a handful of these sources appear signif-icantly harder. While these most likely represent statistical out-liers, if their hard X-ray spectra are confirmed they may signify either the presence of low mass pre-MS companions or that they are CWBs for which a low temperature X-ray component is ab-sent due to the significant interstellar extinction.
14 Assuming log(L
bol/L) ∼ 5.7 for the YHGs, and Lx/Lbol ∼ 10−6yieldsL
x∼2×1033erg s−1. For a 107K thermal plasma – as found forβDra by Ayres et al. (2005) – andD=5 kpc andNH=2×1022cm−2, we may derive a detection limit of∼5×1031 erg s−1 for our current observations.
15 At an age of 4−5 Myr one would not expect Main Sequence stars
Only eight OB SGs have photon fluxes in excess of 10−6 cm−2s−1. Four of these (W24, 30a, 47 and X-1) appear to
have spectra significantly harder (>∼1.4 keV) than 0.6 keV, while the luminosities of four of them (W27, 30a, 36 and 53) are at least an order of magnitude larger than expected from a single star. Hence we believe all to be strong binary candidates, not-ing that Oskinova (2005a) argues that CWBs need not always be hard sources if their emission is dominated by the intrinsic flux of both component stars, rather than the wind collision zone.
Of these objects, optical spectroscopy reveals W30a to be an interacting binary (Sect. A.3), while Bonanos (2007) finds W36 to be an eclipsing binary and W53 to be a periodic (1.3 day) photometric variable, for which it is tempting to attribute the be-haviour to ellipsoidal modulation in a close binary. Moreover, both W24, and 27 have bolometric luminosities significantly in excess of that expected for single cluster SGs (with low S/N spectra of W27 hinting at binarity; Sect. A.3).
However, a number of stars for which optical spectroscopic (W6, 10, 31, 34 and 238; Sect. A.3 and Negueruela et al. in prep.), photometric (W52; Bonanos et al. 2007) or radio (W16b and W17; Dougherty et al. 2007) observations indicate (pos-sible) binarity have X-ray properties consistent with emission from single stars, or lack detections. This could result from their winds not reaching terminal velocity, leading to systematically weaker shocks and/or the colliding wind region being deeply embedded in the X-ray photospheres of the stars, resulting in de-tectable hard X-ray emission only along preferred lines of sight. Conversely, the limited temporal resolution of our current observations limits our ability to detect putative binaries spec-troscopically, while a binary composed of a supergiant+MS star, would likely escape photometric detection. Thus we suspect that stars with excessive hard X-ray emission such as W47 may be confirmed as binaries upon further investigation.
The fact that the WRs are harder and more luminous in X-rays than the OB SGs (Fig. 5) can be explained by a combi-nation of binary and stellar evolution. The increase in mass-loss rates and wind velocity as the star evolves from mid-O MS→WR will lead to greater X-ray emission from a wind-collision region, while the mass loss and/or quasi-conservative mass transfer in a close binary will act to increase the orbital separation, reducing the effects of wind opacity.
Lastly, we comment on the distribution of the spectral types of the X-ray emitters, and the apparent lack of emission from stars later than∼B0.5Ia. Utilising an exospheric approximation, Owocki & Cohen (1999) show that the X-ray emission natu-rally scales as a function of the wind-density parameter ( ˙M/v∞), rather than the canonicalLx/Lbol relation. Given that one would
naturally expect ˙M/v∞to vary with spectral type, our observa-tions support this assertion; assuming evolution at∼const. Lbol
during the OB supergiant phase, one would not expect a depen-dance of the X-ray flux on spectral type – as we find – if emission solely scaled withLbol. While beyond the scope of this work,
tailored non-LTE model atmosphere analysis of both the X-ray emitting and non-emitting members of Wd 1 should allow this hypothesis to be investigated.
5. Low mass pre-main sequence stars
The final stellar X-ray emitters to be considered within Wd 1 are the low mass, pre-MS stars, where magnetic reconnection events produce high temperature (T ∼ 10 MK) plasma, resulting in hard, variable X-ray emission with peak fluxes of∼1032erg s−1
(see e.g. Feigelson & Montmerle 1999). Clearly, the properties of the X-ray point sources without counterparts are consistent
with these expectations, as is the fact that counterparts to this population must be fainter than Ks ∼ 16 mag. Conversion of this limit to a stellar mass requires accurate fitting of theoreti-cal isochrones. Such an analysis is currently underway and will be presented in a future paper (Brandner et al. 2007). However preliminaryresults suggest that such a magnitude likely corre-sponds to stars of<1.5 M, which at an age of∼4 Myr would correspond to stars that have still to evolve onto the ZAMS.
Utilising the findings of the Chandra Orion Ultradeep Project (Feigelson et al. 2005), in principle we can estimate the underlying population of pre-MS stars required to yield the X-ray bright population we detect. To accomplish this, we first define a statistically meaningful sample of sources that are bright enough to detect at least 90% of the time. For akT > 1 keV plasma spectrum we requireFX>8.2×10⁻⁷ph cm−2s−1, which
corresponds to LX > 3 ×1031 erg s−1 for D = 5 kpc and
NH =2×1022cm−2. Using this criterion, we find 45 candidate
pre-MS stars within 5of the cluster core16.
Preibisch & Feigelson (2005) report that X-ray emission in young low-mass stars decreases with age at least as rapidly as τ−0.3. Thus, correcting for the greater age of Wd 1 relative
to Orion, we find the emission will have declined by a fac-tor of at least 1.5. Therefore, our X-ray bright pre-MS sample within Wd 1 corresponds to the pre-MS stars within Orion with LX >∼ 5×1031 erg s−1 andM < 1.5 M. Getman et al. (2005)
find only 2 of the 1616 pre-MS stars within Orion to potentially satisfy these criteria. Therefore, we conclude that the 45 X-ray bright pre-MS candidates within Wd 1 could form the high lu-minosity tail of a population of more than 36 000 pre-MS stars.
In principle one can estimate the pre-MS population of Wd 1 via a similar analysis of the subset of time variable objects. Within 5 of the core of Wd 1 there are 19 pre-MS candidates with X-ray fluxes that vary between observations, 10 that ex-hibit flares within an observation, and 3 that exex-hibit both. Scaling the results of Favata et al. (2005) for Orion to both the greater distance and extinction to Wd 1, as well as the relative dura-tion of the observadura-tions, we expect up to∼0.1% of the pre-MS stars within Wd 1 to produce detectable flares, yielding an un-derlying population of ∼32 000 pre-MS stars. We caution that this is likely to be an underestimate, given that we have been forced to assume that the properties of the flares in the 1 Myr-old Orion and 4 Myr-old Wd 1 populations are identical. However, since flaring is a manifestation of the same magnetic activity that yields the quiescent X-ray flux, it is reasonable to suspect that it too will show a time dependent decay in duration, frequency or flux. Therefore, we conclude that we are currently only detect-ing a very small subset of the total low mass stellar population of Wd 1, and that in combination with near-IR data, deeper X-ray observations will allow a statistically robust investigation of the evolution of magnetic activity in low mass pre-MS stars.
6. The binary fraction of Wd 1 in context
A synthesis of the datasets described above with the study of Bonanos (2007) suggests the presence of≥15 OB supergiant and
≥17 WR binaries within Wd 1. Given that the census of OB SGs within Wd 1 is currently incomplete, we refrain from attempt-ing to determine a binary fraction for such stars, but find a value of>∼70% for WRs. Given that this has been inferred from a sin-gle epoch of X-ray/IR/radio observations, we suspect the true
16 Within the 5 ×5 field previously considered we find 31 such