This is a repository copy of
Semantic User Profiling Techniques for Personalised
Multimedia Recommendation
.
White Rose Research Online URL for this paper:
http://eprints.whiterose.ac.uk/136952/
Version: Accepted Version
Article:
Hopfgartner, F. orcid.org/0000-0003-0380-6088 and Jose, J.M. (2010) Semantic User
Profiling Techniques for Personalised Multimedia Recommendation. Multimedia Systems,
16 (4-5). pp. 255-274. ISSN 0942-4962
https://doi.org/10.1007/s00530-010-0189-6
[email protected] https://eprints.whiterose.ac.uk/ Reuse
Items deposited in White Rose Research Online are protected by copyright, with all rights reserved unless indicated otherwise. They may be downloaded and/or printed for private study, or other acts as permitted by national copyright laws. The publisher or other rights holders may allow further reproduction and re-use of the full text version. This is indicated by the licence information on the White Rose Research Online record for the item.
Takedown
If you consider content in White Rose Research Online to be in breach of UK law, please notify us by
Semantic User Profiling Techniques for Personalised
Multimedia Recommendation
Frank Hopfgartner and Joemon M. Jose Department of Computing Science
University of Glasgow {hopfgarf,jj}@dcs.gla.ac.uk
Abstract. Due to the explosion of news materials available through broadcast and other channels, there is an increasing need for personalized news video retrieval. In this work, we introduce a semantic based user modelling technique
to capture users’ evolving information needs. Our approach exploits implicit user interaction to capture long-term user interests in a profile. The organised interests are used to retrieve and recommend news stories to the users. In this paper, we exploit the Linked Open Data Cloud to identify similar news stories
that match the users’ interest. We evaluate various recommendation parameters by introducing a simulation-based evaluation scheme.
Keywords: long-term user profiling, video annotation, multimedia recommendation, evaluation, user simulation, semantic web technologies
1 Introduction
A challenging problem in the user profiling domain is to create profiles of users of multimedia retrieval systems. Due to the Semantic Gap, it is not trivial to understand the content of multimedia documents and to find other documents that the users might be interested in. A promising approach to ease this problem is to set multimedia documents into their semantic contexts. For instance, a video about US President
Barack Obama’s speech in Ghana can be put into different contexts. First of all, it shows an event which happened in Accra, the capital of Ghana. Moreover, it is a visit
by an American politician, the current president. Retrieving a video about Obama’s
visit to Ghana might indicate that someone is interested in either Barack Obama, Ghana, or in both. The semantic context can lead to a better understanding of the personal interests. A challenge in user profiling research is the identification of users’ interests in various events. Multiple interests lead to a sparse data representation and approaches need to be studied to tackle this problem, e.g. by creating structured user profiles.
Knowing the context of a video is useful for recommending videos that match the
consumers’ information need. By exploiting these contexts, transcripts can also be linked to other, contextually related transcripts. From a user profiling point of view, these links can be of high value to recommend semantically related transcripts, hence creating a semantic-based user profile. Major challenges which inhibit the creation of
services rely on users explicitly specifying preferences, a common approach in the text retrieval domain. By giving explicit feedback, users are forced to update their need, which can be problematic when their information need is vague [1]. Furthermore, users tend not to provide enough feedback on which to base an adaptive retrieval algorithm. Deviating from the method of explicitly asking the user to rate the relevance of retrieval results, the use of implicit feedback techniques helps by learning user interests unobtrusively. The main advantage is that users are relieved from providing feedback. A disadvantage is that information gathered using implicit techniques is less accurate than information based on explicit feedback [2]. A problem is, hence, to exploit this noisy information to build a user profile.
In this paper, we introduce a semantic user profiling approach for news video retrieval, which exploits a generic ontology to put news stories into a context. In order
to identify a user’s interest in specific news topics, we exploit his/her relevance feedback which is provided implicitly while interacting with the system. Moreover, we incorporate the ostensive model of developing information need [3] in order to capture the evolving focus of interest. We evaluate various parameters by employing a simulation-based user study. The remainder of this paper is structured as follows: In Section 2, we review related work which is relevant in the context of our study. In Section 3, we introduce the research challenges that arise. Section 4 introduces our architecture of capturing daily news, creating semantic annotations, exploiting implicit relevance feedback for user profiling and news content recommendation. In order to evaluate our research questions and hypotheses, we require ground truth data. The generation of such data is introduced in Section 5. Section 6 describes our user behaviour simulation. In Section 7, we present the results of our evaluation and discuss the outcome of this simulation in Section 8.
2 Background
This work builds upon different research domains, including news video retrieval, user profiling and evaluation of interactive systems. In the remainder of this section, we introduce state-of-the-art methodologies to address the research challenges of these domains.
News Video Retrieval
Even though the TRECVid video collections have been useful to evaluate basic technologies for the management and retrieval of large video collections, it is unsuited for studies in user profiling. The main problem is that the available corpus is outdated which is a big drawback for potential user-based evaluation of profiling approaches. Users will behave differently when searching for old news instead of the latest news, hence biasing the outcome of such studies. An important factor for achieving meaningful results in user profiling is therefore to provide users access to an up-to-date news video corpus.
User Profiling
User profiling is the process of learning a user’s interests over a long period of time.
Most state-of-the-art user profiling approaches exploit the textual content of relevant
documents to identify user’s interests. Chen and Sycara [4] follow internet users during their information seeking task and explicitly ask them to judge the relevance of the pages they visit. Exploiting the created user profile of interest, they generate a personalised newspaper containing daily news. However, providing explicit relevance feedback is a demanding task and users tend not to provide much feedback [5]. Bharat et al. [6] created a personalised online newspaper by unobtrusively observing the
user’s web-browsing behaviour. The web-based interface of their system provides a facility to retrieve news stories and recommends stories to the user based on his/her interest. Although their system is a promising approach to release the user from providing feedback, their main research focus is on developing user interface aspects, ignoring the sophisticated recommendation issues. Introducing user profiling in the news video domain, Luo et al. [36] suggest exploiting users’ personal background knowledge to recommend relevant news videos. Further, they automatically identify associations between different news stories using audiovisual features.
Considering the high importance of concepts such as names, places and organisations in news data, we suggest to use these entities to identify such associations. If a story contains various entities, associations between these entities and other stories’ entities might help to model user interests more accurate. This association between entities, or concepts, can be defined by an ontology. Gruber [11] defines ontologies as “content
by creating knowledge graphs that model the relationship between different concepts in the Linked Open Data Cloud. This collection of ontologies unites information about many different freely available concepts. The backbone of the cloud is DBpedia, an information extraction framework which interlinks Wikipedia content with other databases on the Web such as Geonames or WordNet. As of now, the
DBpedia Knowledge Base contains more than 2.6 million graph elements1 which are
interlinked with each other. Being a representation of Wikipedia, however, both quantity and quality of these links differs tremendous. While some concepts are interlinked with many related concepts, other concepts are linked with few related concepts only. In this work, we exploit this data cloud to link automatically segmented story videos and to build personalised long-term user profiles. Since we are evaluating the performance bounds of these profiles, a direct comparison with the above introduced methods is not possible.
Evaluation Methodologies
Different from usability testing [37] experiments as common in the HCI research community, the intended aim of experiments in the information retrieval (IR) domain is to evaluate the underlying retrieval/recommendation system. IR experiments can broadly be categorised into two paradigms. The most dominant one is system-centred evaluation. Indeed, large-scale evaluation campaigns such as TREC are based on it. System-centred experiments are defined by a strict laboratory-based setting. Automatically generated retrieval results are compared with a list of assessed documents, referred to as the ground truth, and standard evaluation metrics such as precision and recall are computed. The metrics of both systems are then used to evaluate the effectiveness of the introduced method.
Even though system-centred evaluation is suitable for some experiments, it cannot easily be applied to study some research approaches which are focused around the user [38, 28]. This is especially problematic in adaptive information retrieval which is
based on adapting retrieval results to satisfy users’ personal interests. In user-centred evaluation, user satisfaction is used as evaluation measure. User-centred evaluation schemes are very helpful in getting valuable data on the behaviour of interactive search systems. Various problems, however, arise when solely relying on this paradigm [39]. First of all, user satisfaction is highly subjective. Moreover, it is almost impossible to test all the variables involved in an interaction and hence compromises are needed on many aspects of testing. Furthermore, such a paradigm is inadequate in benchmarking various underlying retrieval algorithms.
In order to evaluate the performance of long-term adaptation, user studies will be required where users interact with the system over several iterations. As argued before, both system-centred and user-centred evaluations are not suitable for this scenario.
An alternative, well-established way of evaluating such systems is the use of simulations. An early example is given by Finin [10], who allowed software
developers to test their systems by feeding them with simple stereotype user behaviour. Simulation-based evaluation schemes have been used extensively, as the survey on state-of-the-art user simulation given by Ivory and Hearst [9] indicates. The objective of this paper is to introduce a simulation framework which can be used to evaluate long-term user profiling methods.
3 Research Hypotheses
Various problems arise when aiming at recommending news videos based on users’ long-term interests.
The first problem is how the users’ evolving interests can be captured in a long-term user profile. What a user finds interesting on one day might be completely irrelevant on the next day. In order to model this behaviour, we incorporate the Ostensive Model of developing Information Need [3]. In this model, providing feedback on a document is considered as ostensive evidence that this document is relevant for the user’s current interest. As argued before, however, users tend not to provide constant feedback on what they are interested in. Thus, one condition we set is that a user profile should be automatically created by capturing users’ implicit interactions with the retrieval interface. This guarantees a constant feedback of (implicit) relevance, opposed to explicit relevance feedback that could be given rather occasionally. Our first hypothesis is hence that implicit relevance feedback techniques can efficiently be employed to create efficient long-term user profiles. The more users show interest in a specific news story, the higher it will be ranked in their profile.
Having the users’ interests captured in a profile, the next question is how to identify this interest from their profile. One challenge is that users can show interest in multiple news topics. For example, users may be interested in Sports and Politics or in Business news. Further, they can even be interested in sub categories such as Football, Baseball or Hockey. A specification for a long-term user profile should therefore be to automatically identify these multiple aspects. Preliminary results [29] indicate that separating user profiles based on broader news categories leads to a structured representation of the users’ interests. Moreover, results in [21] suggest that a hierarchical agglomerative clustering of the content of these category-based profiles can be used to effectively identify sub categories. As explained, the proposed user profiling approach gives a higher weighting to those stories that achieved a higher attention by the user. An open question is, however, how many entries in such user
profile should be used to represent the user’s current topics of interest.
exploiting this context can lead to appropriate news video recommendations. An open question is, however, how many concepts should be considered to identify similar news stories to recommend to the user.
In order to evaluate the quality of the recommendations over a longer time period, a long-term user experiment is required where users are free to use the system to satisfy their personal information need. The constrictions of laboratory-based interactive experiments with pre-defined search tasks do not allow such scenario, since users will not be able to search for the content they are really interested in. Consequently, a general list of assessed documents cannot be used, since the user decides what topic he/she is searching for. Moreover, the evaluation of different parameters requires a larger number of runs. A user-centric evaluation is therefore inadequate, since it would require many users to repeat the same steps various times. Tackling these problems, we therefore propose the generation of a test collection for long-term user modelling. The collection can be used to study above research questions by simulating users interacting with the video recommendation system.
Summarising, we address the following hypotheses in this work:
(H1) Implicit relevance feedback techniques can be exploited to create efficient long-term user profiles.
(H2) Ontologies can be exploited to recommend relevant news documents.
Further, we address the following research questions:
(Q1) How many entries in a user profile should be used to represent the user’s current topics of interest?
(Q2) How many concepts should be considered to identify similar news stories
to recommend to the user?
4 System Description
In order to evaluate the stated research questions and hypotheses, we implemented a news video recommender system. In this section, we first introduce the data capturing phase, followed by a description of the system architecture.
Data Collection
In this study, we focus on the daily BBC One O’Clock News and the ITV Evening News, the UK’s largest news programmes. Each bulletin has a running time of thirty minutes and is broadcast on work days. Both channels enrich their broadcasts with a closed caption (teletext) signal that provides textual transcripts. Between November 2008 and April 2009, we captured the broadcasts of both channels and stored the video transmissions in MPEG-1 format. The smallest unit in a video broadcast is a video shot. A shot is defined as a part of the broadcast that has been created by a continuous recording from a single camera. Following O’Connor et al. [33], we use a colour-histogram based approach to detect shot boundaries in the MPEG-1 videos. In the video retrieval domain, shots are usually visualised by static, representative key frames of the shots. In order to determine such key frames, we calculate the average colour histogram for each shot and extract the frames with the shot which are closest to the average. This results in a set of key frames for each shot which we then combine to a single animated key frame in GIF format. The next challenge is to combine these shots to larger, semantically related, story segments. The news broadcasts are segmented into stories by individually processing the video and teletext streams. The story segmentation of the video stream is achieved by detecting anchor person shots and the story segments from the text stream are obtained by a semantic Latent Dirichlet Allocation (LDA) based approach. Both individual streams are then combined to identify the story boundaries. The approach is discussed further in [26].
Semantic Annotation
Usually, news content providers classify their news in accordance to the IPTC standard, a news categorisation thesaurus developed by the International Press Telecommunications Council. We assume that a categorisation of our data corpus using this standard will lead toward a structured user profiling approach. Therefore, we use OpenCalais2, a Web Service provided by Thomson Reuters, to classify each
story into one or more news categories as defined by the IPTC. The current version of OpenCalais is able to classify text into the following categories:
Business & Finance
Entertainment & Culture
Health, Medical & Pharma
Politics, Sports
Technology & Internet
Other.
In a next step, we aim to identify concepts that appear in the stories. Once these concepts have been positively identified, the Linked Open Data Cloud can be exploited to further annotate the stories with related concepts. However, we need to address a number of questions in employing this method.
First of all, how can we determine concepts in the story which are strong representatives of the story content? In the text retrieval domain, named entities are considered to be strong indicators of the story content, since they carry the highest content load among all terms in a document. Therefore, we extract persons, places and organisations from each story transcript using OpenCalais.
The second question is how these named entities can be positively matched with a conceptual representation in the Linked Open Data Cloud. For resolving the identity of an entity instance, we again rely on the OpenCalais Web Service, which compares the actual entity string with an up-to-date database of entities and their spelling variations. Once entities have been disambiguated, OpenCalais maps these entities with a uniform resource identifier (URI) and their representation in DBpedia.
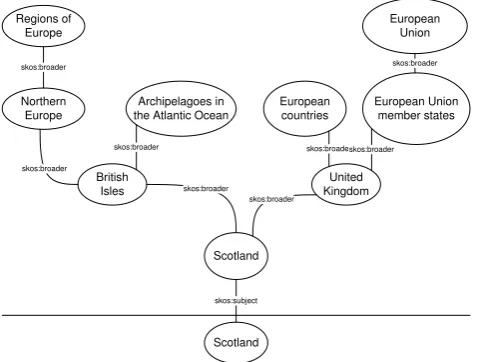
Since the link between the story and the DBpedia graph has been established, DBpedia can now be exploited to put each identified entity into its context. Even though entities in DBpedia are solely nodes in a graph, a semantic hierarchy between most neighboured nodes is defined by the Simple Knowledge Organisation System Reference (SKOS) data model. In order to identify the context of each node, we first extract all neighboured nodes in the graph which represent the category where this node belongs to. The corresponding links are defined by the property “skos:subject”. Further, for each identified category node, we extract all categories that have a
[image:9.595.185.424.484.665.2]semantically broader meaning. These are defined by the property “skos:broader”.
Figure 1 illustrates an example hierarchy for the concept “Scotland”.
Scotland Scotland British Isles United Kingdom Northern Europe Regions of Europe Archipelagoes in the Atlantic Ocean
European countries European Union member states European Union skos:subject skos:broader skos:broader skos:broader skos:broader skos:broader skos:broaderskos:broader skos:broader
In order to set the entities of the video stories into a broad context, we extract up to four layers of broader categories. Note that not all named entities in the data collection have a concept representation in DBpedia. Further, not all identified concepts are linked to broader categories. An overview of the number of entities, concepts and categories (layers L1– L4) in the data collection is given in Table 1.
# Entities # Concepts # L1 Cat. # L2 Cat. # L3 Cat. # L4 Cat.
[image:10.595.137.452.215.239.2]10666 8124 42661 76250 115200 145491
Table 1: Number of entities, concepts and categories in the data collection
Finally, all stories are indexed using MG4J3, an open source search engine.
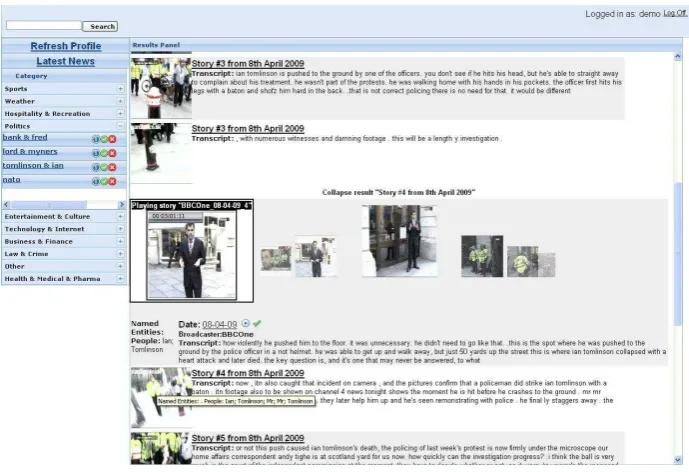
User Interface
Figure 2 shows a screenshot of the news video retrieval interface. It can be split into three main areas: Search queries can be entered in the search panel on top, results are listed on the right side and a navigation panel is placed on the left side of the interface. When logging in, the latest news will be listed in the results panel. Search results are listed based on their relevance to the query. Since we are using a news corpus, however, users can re-sort the results in chronological order with latest news listed first. Each entry in the result list is visualised by an example key frame and a text snippet of the story’s transcript. Keywords from the search query are highlighted to ease the access to the results. Moving the mouse over one of the key frames shows a tooltip providing additional information about the story. A user can get additional information about the result by clicking on either the text or the key frame. This will expand the result and present additional information including the full text transcript, broadcasting date, time and channel and a list of extracted named entities. In the example screenshot, the third search result has been expanded. The shots forming the news story are represented by animated key frames of each shot. Users can browse through these animations either by clicking on the key frame or by using the mouse wheel. This action will centre the selected key frame and surround it by its neighboured key frames. The key frames are displayed in a cover-flow view, meaning that the size of the key frame grows larger the closer it is to the focused key frame. In the expanded display, a user can also select to play a video, which opens the story video in a new panel.
The user’s interactions with the interface are exploited to identify multiple topics of interests. On the left hand side of the interface, these interests are presented by different categories. Clicking on any of these categories in the navigation panel will reveal up to four sub categories for the according category. The profiling approach will be introduced in the following section.
Figure 2: Graphical User Interface of the System
User Profiling
Addressing Hypothesis (H1), we rely on implicit relevance feedback for user profiling. When a user interacts with a result, he leaves a “semantic fingerprint” that he is interested in the content of this item to a certain degree. In this work, we employ a weighted story vector approach to capture this implicit fingerprint in a profile. The weighting of the story will be updated when the system submits a new weighted story to the profile starting a new iteration . Hence, we represent the interaction of a user
at iteration as a vector of weights
= 1
where indexes the story in the whole collection. The weighting of each story expresses the evidence that the content of this story matches the user’s interest. The higher the value of , the closer this match is.
As explained before, each news story has been classified as belonging to one or more broad news categories . Since we want to model the user’s multiple interests, we use this classification as a splitting criterion. Thus, we represent user ’s interest in C in a category profile vector ( ), containing the story weight ( ) of each story of the collection:
In the user interface, each category profile is represented by an item in the navigation panel.
In our category profile, the story weight for each user is the combination of the
weighted stories over different iterations : ( ) = .
Following Campbell and van Rijsbergen [30], we include the ostensive evidence
= 1
+1
1 +1
=2
to introduce an inverse exponential weighting which will give a higher weighting to stories which have been added more recently to the profile, compared to stories which were added in an earlier stage.
Profile categorisation
Each category profile consists of a list of weighted stories, with the most important stories having the highest weighting. A challenge is here to identify different contextual aspects in each profile. We approach this problem by performing a hierarchical agglomerative clustering of stories with the highest story weight at the current iteration. Aiming at Research Question (Q1), we define as the number of stories used for clustering.
Following Bagga and Baldwin [18], we treat the transcripts extracted from clustered stories as term vectors and compare them by cosine. Unlike their approach, however, we use the whole transcript rather than sentences linked by co-references and use the square root of raw counts as our term frequencies rather than the raw counts. We use complete-link clustering since this approach results in more compact clusters. Moreover, we do not use inverse-document frequency normalisation since this value can be important for discrimination. For tokenisation, we use standard filters (conversion to lower case, stop word removal and stemming). The numbers of clusters is a parameter. Since each cluster should contain stories associated with an
aspect of the user’s interest, should be equal to the number of different interests that a user has. In this study, we have set = 4. In the interface, the clusters represent the four sub categories under each category in the navigation panel. The two most frequent named entities in each cluster are used as a label for each sub category. The content of the users’ profiles is displayed on the navigation panel of the left hand side of the interface. Since the idea of such navigation panel is to assist the users in finding other stories that match their interests, the next challenge is to identify more stories in the data corpus that might be of the users’ interests.
News Video Recommendation
Assuming that each of the sub categories contains stories that cover one or more
Jose [29], we formulate a search query based on the content of each cluster. The search results, ranked using Okapi BM25, are then presented as recommendations. In order to evaluate Hypothesis (H2), we define three query formulation approaches, each of which aiming to retrieve other news stories that match the content of the corresponding sub category. Hence, each approach represents another method to recommend other news stories that match the user’s interest as represented by the sub category of the profile. The query length is a parameter used to evaluate research question (Q2). The approaches are as follows:
Baseline run (B): The search query consists of the most frequent nouns and foreign names of all queries in the cluster, combined using the “or” operator.
Concept run (C): The search query consists of the most frequent concepts
of all queries in the cluster, combined using the “or” operator. Concepts are named entities with a representation in DBpedia. Hence, they can be considered to be more specific entities that have been described on Wikipedia.
Category run (DBpedia): The search query consists of the most frequent concepts and the most frequent categories of each category layer,
combined using the “or” operator. Differing from the Baseline and Concept runs, the search query therefore consists of × 5 terms. Following Robertson et al. [32], we define the concepts and each category layer as multiple weighted fields and give a linearly decreasing weighting to higher categories. Retrieval results are therefore ranked using BM25F.
Summary: In order to evaluate Hypothesis (H1), the introduced news video recommender system exploits implicit relevance feedback to create long-term user profiles. The Ostensive Model of Evolving Information Need is employed to give a higher weighting to more recent user feedback. Multiple user interests are identified by categorising the profile content based on broad concepts. Further, a clustering approach is introduced to identify sub categories for these broad concepts. Aiming at our first research question (Q1), the number of stories used for clustering is defined as
.
Moreover, we introduce three different news story recommendation approaches to evaluate hypothesis (H2): A Baseline run (B), a Concept run (C) and a Category run (DBpedia). All of them are based on exploiting the content of each cluster to retrieve related news stories. Addressing our second research question (Q2), the number of search terms used for retrieval is defined as .
5 Relevance Assessment
profile to base the recommendations on. Our user profiling simulation will be introduced in the section that follows.
Assessment Group
In order to generate necessary ground truth data, we recruited eighteen volunteers with a diverse background using various mailing lists and social networking sites. Since the assessment task is a very tedious work, we allowed each participant to follow their own time schedule. Time estimation is therefore not possible. The assessment task was split into two main parts, each part ended with an additional questionnaire where the participants were asked to express their opinion about each part.
Before the actual assessment, the assessors were asked to fill in an entry questionnaire to provide demographic information. The group consisted of 12 male and 6 females with an average age of 26.2 years. A majority of them holds either an undergraduate or postgraduate degree with a background on IT technologies. We were first interested to find out which sources they usually rely on to gather latest news. The most named answers they selected from a predefined list were news media websites, followed by television news and word of mouth. These replies indicate that the participants accept online news, but also rely on television broadcast. Our assessment group corresponds to the most active group in online services [20]. They are hence the ideal audience for news video recommender systems. Moreover, we were interested whether they follow diverse news topics, a premise for the assessment task. Therefore, they were asked to indicate their interests from a list of broad news categories. Further, they were asked to provide different examples for each category to check how diverse their interest really is. The participants provided an average of 2.5 examples per topic. The results indicate that they show interest in a diverse number of news topics. We hence conclude that they are an appropriate group to base our study on.
BBC Online News Assessment
In the first part of the assessment task, we aimed at identifying the participants’ specific interests in news events. Three assumptions underlie this experimental subtask.
1. We assume that each day, national news media report about the most
important news events. More specific, we assume that the BBC, the world’s largest news gatherer, reports about this event on their news website4. This
website is one of the most popular news websites in the UK and well-known for its detailed content.
2. Further, we assume that events with the highest media attention are the most important news events. Apart from “silly season” topics, news media cover stories of general interest.
3. Besides, we assume that “typical” news consumers are mainly interested in the most important news.
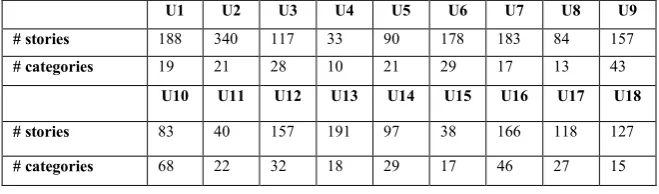
In order to identify those stories on the BBC News website which received the highest media attention on that day, we rely on Google News which clusters similar news stories from multiple sources and ranks them based on their popularity. For each day of our experiment, we retrieved the URL, the headline and a short snippet from the BBC News website as provided by the Google News API. For the assessment task, we generated lists of all retrieved stories, separated by the date and split into blocks of two weeks each. Each list hence contained a maximum of 140 stories (10 stories per day and 14 days). Our participants were now asked to mark all stories in each list, seven in total, which they find interesting. For further information, they were also allowed to check the actual website on the BBC server. In a second step, they had to categorise the selected articles into related groups and provide each group with a common label. They were asked to choose rather broad labels for each category without using too general descriptions. This advice aimed at avoiding categories of very specific events which might have appeared only once within the whole time period. Table 2 provides an overview of assessed news stories and identified news categories.
U1 U2 U3 U4 U5 U6 U7 U8 U9 # stories 188 340 117 33 90 178 183 84 157
# categories 19 21 28 10 21 29 17 13 43
U10 U11 U12 U13 U14 U15 U16 U17 U18 # stories 83 40 157 191 97 38 166 118 127
[image:15.595.133.463.366.463.2]# categories 68 22 32 18 29 17 46 27 15
Table 2 Summary of the BBC Online News Assessment Task
The consecutive questionnaire aimed at evaluating their assessment experience. Using Five-Point Likert scales, we first asked them to judge the difficulty of the assessment task. The majority claimed that they found the task very simple. The main difficulty they reported was that some news stories could be classified as belonging to more than one category which our interface did not support. Since the assessment task took place a few months after the time period of the data corpus, we were interested if this time difference caused troubles for the participants. We therefore asked the participants to judge different statements on Five-Point Likert scales. Some of the scales were inverted to reduce bias. The assessors stated that before starting the task, they had a general idea of which news events happened in the given time period. Moreover, they claimed that they already knew which kind of stories they were interested in before looking at the collection. As we expected, they claimed that they discovered various news events which they were not aware of before. We assume that this might be partly due to the time difference, but also due to a less intensive following of the news events. The majority did not agree with the statement “I marked various news events as interesting even though I was not interested in them at the
therefore be a realistic representation of the assessor’s interests in news within the
time period.
News Video Assessment
Knowing the users’ categories of interest, the second part of the experiment aimed at identifying news reports in the video corpus for each category of interest. In an ideal case, the participants would be asked to assess the full data corpus in order to identify these video clips which are relevant to their identified interests. Due to the size of the data collection, however, this approach is not feasible. Hence, it is necessary to provide the participants with a subset of the corpus which they should assess accordingly.
In order to identify a good subset for each category of interest, we exploit a simple observation: Studies (e.g. [19]) have shown that named entities such as persons, locations or organisations play a key role in news reports. The news documents which have been marked and classified in the preceding subtask mainly consist of reports or interviews and hence contain many named entities. Assuming that the same news events which are broadcast have also been reported online, these terms should also be mentioned in the video report about the same event. Considering that both textual and video news are published by the same news content provider (BBC in our case), it is even more likely that the same entities are used analogically. Moreover, since the textual reports usually contain more details than short video clips, there is a high probability that all entities which are mentioned by the reporter in the video also appear in the text report. The most important named entities from the textual documents should hence provide a good presentation of the content of each category. Further, retrieving news stories using entities as a search query should provide a significantly smaller subset of the data corpus which can then be assessed by the participant.
Therefore, we use the freely available LingPipe toolkit5, at default settings (trained
on the MUC-6 English corpus) to extract all named entities from every assessed document. In a next step, we combine the top ten percent most frequent entities of
each category of interest using the “or” operator to form a search query.
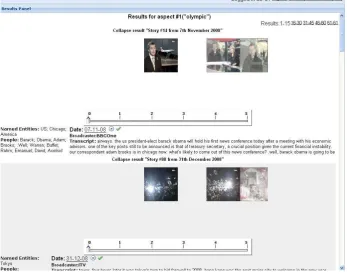
Figure 3: News Video Assessment Interface
Using the interface shown in Figure 3, the participants were now presented a result list of each category of interest. The label of the category, referred to as an “aspect”, is given on top of the list. Results were ranked using BM25 and were visualised in the same way as the expanded results in the interface shown in Figure2. In addition, each retrieved story had an additional ranking bar where users were asked to assess how much this result is relevant to the given category. Search results were split into several pages containing 15 results each and the participants were asked to assess at least the first three pages. After finishing the assessment for one category, they could click on
“Next aspect’s result” on the top of the interface to start the assessment of the next category.
U1 U2 U3 U4 U5 U6 U7 U8 U9
# days with annotated results 70 76 65 39 50 59 73 78 59 # relevant assessed stories 234 297 217 101 112 155 302 99 203
U10 U11 U12 U13 U14 U15 U16 U17 U18
# days with annotated results 44 52 69 58 36 51 69 71 32
# relevant assessed stories 156 137 200 187 69 124 187 160 95
[image:17.595.105.486.585.667.2]Table 3 shows the summary of the news video assessment task. As can be seen, the assessment task ended with diverse results, indicated by the different number of relevant assessed stories and different number of days with annotated results.
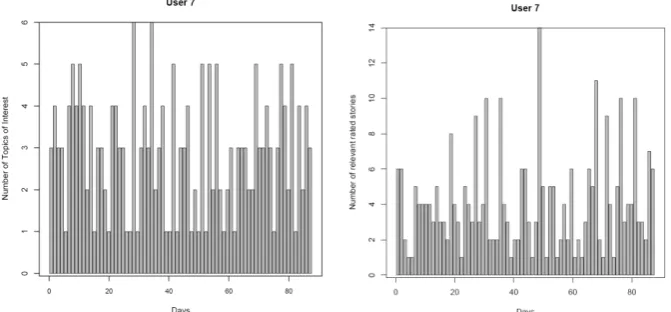
Figure 4: Number of relevant rated stories and number of topics of interest per day for User 7
Figure 4 shows the numbers of relevant rated stories and the distribution of topics of interest per day for User U7. Similar patterns can be observed for all participants.
As these figures illustrate, the distribution of the user’s interest is very sparse. Since users will be interested in various numbers of news stories on different days, thus, we conclude that these incoherent assessment lists reflect realistic user interests.
In the final questionnaire, we aimed at evaluating whether the presented subset of the data corpus was appropriate. Therefore, using Five-Point Likert scales, we asked the participants to judge whether the displayed news stories were related to the according news aspect. Even though the majority had a neutral perception towards this statement, 43% slightly agreed to it. Moreover, they were asked to judge whether the news stories covered most facets of the according aspect on a Five-Point Likert scale. Again, the participants tended to agree with the statement. We therefore conclude that using the news article assessments to identify good search queries resulted in sensible subsets of the actual video data corpus.
6 User Behaviour Simulation
The relevance assessment lists which have been introduced in the previous section express the interests in news events of eighteen potential users of our news video retrieval system. Considering these interests as ground truth data fulfils one requirement for a simulation-based evaluation. Another requirement is a long-term user profile of a representative user who interacted with the system over a longer period of time. In this section, we introduce our approach of creating a simulation-based user profile.
Defining user actions
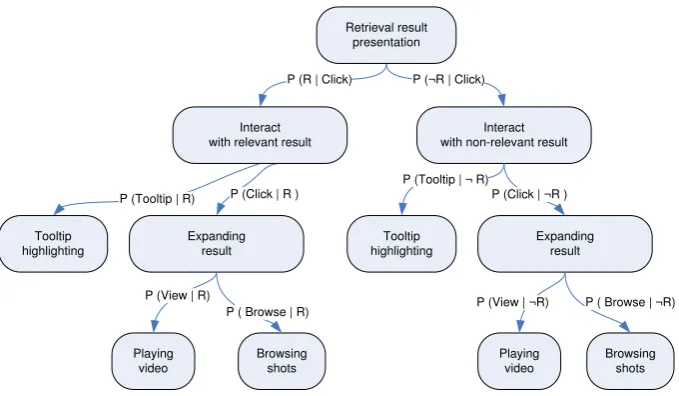
The first step towards evaluating our experimental parameters is to simulate a user interacting with the system. Dix et al. [23] argue that user interactions in interactive systems can be represented as a series of low-level events, e.g. key presses or mouse clicks. The interface shown in Figure 2 supports four types of such events:
1. Tooltip event: Moving the mouse over one of the key frames in the result list pops up a tooltip showing additional information about the news story.
2. Clicking event: A click on a result in the result list will expand the according news story and display further information.
3. Browsing event: A click on any animated shot segment in the expanded view
of a news story will centre the according shot. In this way, the user can browse through the shots of a story.
4. Viewing event: Clicking on the play button in the expanded view will start playing the video.
User actions can be seen as a sequence of one or more of these events. In [22], Hopfgartner and Jose illustrate possible user actions of state-of-the-art video retrieval interfaces. They argue that some events are independent, while other events depend on preceding events. Two of the above introduced events can be triggered independently from others: Users can always move the mouse over a result to get more information (tooltip event) and can always expand a search result (clicking event). Once a story was expanded, the user can browse through the shots (browsing event) or start playing the video (viewing event). The latter events are hence dependent from the clicking event.
Interact with non-relevant result
Tooltip highlighting
Expanding result
Playing video
Browsing shots
Tooltip highlighting
Expanding result
Playing video
Browsing shots P (R | Click) P (¬R | Click)
Retrieval result presentation
P (Click | R ) P (Tooltip | R)
Interact with relevant result
P (View | R)
P ( Browse | R)
P (Tooltip | ¬ R)
P (Click | ¬R )
[image:20.595.138.478.145.343.2]P (View | ¬R) P ( Browse | ¬R)
Table 4 Markov Chain of user actions
Following Vallet et al. [25], the transitions are defined as follows:
) = # relevant clicks # total clicks
¬ ) = # non-relevant clicks
# total clicks = 1 Click)
(Click | R) = # click on relevant stories in result set # relevant rated stories
(Click | ¬R) = # click on non-relevant stories in result set # non-relevant rated stories
(Tooltip | R) = # tooltip on relevant stories in result set # relevant rated stories
(Tooltip | ¬R) = # tooltip on non-relevant stories in result set # non-relevant rated stories
(View | R) = # playing of relevant stories in result set # relevant rated stories
(Browse | R) = # browses in relevant stories in result set # relevant rated stories
(Browse | ¬R) = # browses in non-relevant stories in result set # non-relevant rated stories
Determining Usage Patterns
Having defined a Markov Chain to simulate user interactions, the next step is now to determine realistic probabilities for each transition in the chain. The best way to simulate realistic user interaction patterns is to analyse how real users interact with the video retrieval system. A statistical log file analysis of this study can then provide an insight into real users interaction patterns. Therefore, we asked 16 users to use the system for up to ten minutes each working day for up to seven days to search for any topic that they were interested. In addition, we also created a simulated search task situation as suggested by Borlund [34]. Our expectation was twofold: First of all, we wanted to guarantee that every user had at least one topic to search for. Moreover, we wanted the participants to actually explore the data corpus. Therefore, we chose a scenario which had been a major news story over the last few months:
“Dazzled by high profit expectations, you invested a large share of your savings in
rather dodgy securities, stocks and bounds. Unfortunately, due to the credit crunch, you lost about 20 percent of your investment. Wondering how to react next and what else there is to come, you follow every report about the financial crisis,
including reports about the decline of the house’s market, bailout strategies and worldwide protests.”
They were further asked to indicate whenever they found news stories which interested them. A more detailed description of the user experiment is given in [21]. In order to obtain a set of characterisation parameters, we use statistical information of the 16 users to calculate probabilities of users performing certain types of actions. Our first interest is here to judge the quality of the dataset by analysing the number of clicks performed on relevant stories. Since participants of this user study were motivated to retrieve any topic they wanted, story relevance cannot be generalised. What User A might find relevant is completely irrelevant for User B. Therefore, we first determined the probability value ( |Click) for each individual user, which we then averaged. According to the log files, the average probability of clicking on a document and rating this document ( |Click) is 0.55, a rather high value. In other words, approximately every second story that the users interacted with was labelled to be relevant by the according user. Table 5 shows the averaged probabilities of an implicit action being performed on relevant and non-relevant using the formulae introduced in the previous section.
Action Type Probability
(Click| ) 0.34
(Tooltip| ) 0.21
(Tooltip|¬ ) 0.02
(View| ) 0.42
(View|¬ ) 0.043
(Browse| ) 0.97
(Browse|¬ ) 0.0
Table 5 Probability values of possible action types
Creating long-term user profiles
Since we want to evaluate the effect of various parameters over a longer period of time for various users, we have to create long-term user profiles for each user. Exploiting the possible user actions and the determined probability values, we create these profiles by simulating the users interacting with the system for every day that has assessed ground truth data. We simulate the following usage scenario:
“Imagine a user who is interested in multiple news topics. He registered with our
news recommender system with a unique identifier. For a period of five month, starting in November 2008, he logs into our system, which provides him access to the
latest news video stories of the day. On the system’s graphical interface, he has a list
of the latest stories which have been broadcast on two national television channels. He now interacts with the presented results and logs off again. On each subsequent
day, he logs in again and continues the above process.”
Starting with the first day contained in the individual user’s assessment list, we simulate a user interacting with the news stories of the day according to the introduced user patterns. Each time an event has been triggered, we store this implicit action in the user profile with the according weighting as introduced in Section 4. In this work, we define a static value for each possible implicit feedback event:
=
0.1, when a user browses through the keyframes 0.2, when a user uses the highlighting feature
0.3, when a user expands a result 0.5, when a user starts playing a video
The session simulation is repeated iteratively. This results in eighteen individual user profile containing entries of each day of the data collection with different relevance weighting.
Recommendation approach
terms of each cluster, assuming that these terms represent best the content of the clusters. Finally, we combine these terms using the “or” operator to form a search query for each cluster and trigger a retrieval using this search query. Retrieved results are ranked using BM25.
Summary: In this section, we analysed the user interface of the news recommender system and identified specific feedback events. Moreover, we defined possible user actions, consisting of combinations of these feedback events. Transitions between these events can be expressed in probabilities. Exploiting the log files of a preceding user study, we determined statistical probabilities for each transition and simulated a user using the system over a period of five month. The outcome of this simulation is eighteen user profiles which contain weighted stories of every day in the data collection. Recommendations are presented by identifying the most frequent terms of the corresponding profile content.
7 News Recommendation Evaluation
Each simulated user profile has been created iteratively. For every day which is covered in the ground truth data, new documents have been added, resulting in a daily update of the user profile. In order to evaluate the suggested news recommender approaches with respect to the research questions (Q1) and (Q2), we can now compute standard evaluation measures.
For each day in each user’s profile, we create the search query for every cluster in the profile as explained above. We then trigger a retrieval using this search query and compute standard evaluation measures with the according ground truth data. These
steps are repeated for = {4,5,6,7,8,9,10,20,30,40,50},
= {1,2,3,4,5,6,7,8,9,10,11,12,13,14,15} and
= {Baseline run, Concept run, Category run} . Hence, for each assessed day, we have 11 × 15 × 3 = 495 individual runs for every user.
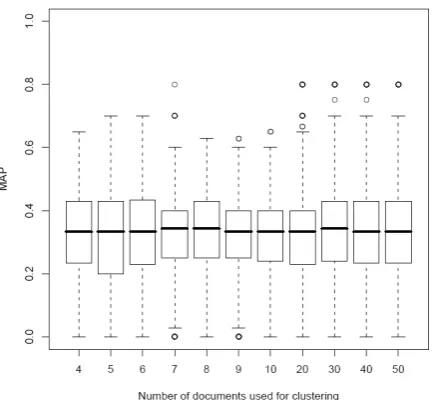
Figure 5: MAP per Number of documents used for clustering for Baseline run (B)
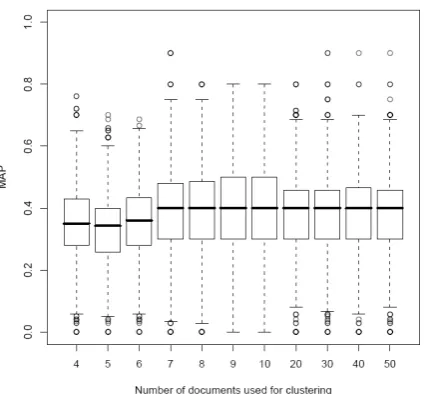
[image:24.595.192.418.384.591.2]Figure 7: MAP per Number of documents used for clustering for Category run (DBpedia)
Various observations can be noted from these figures. First of all, the best performance for all runs can be observed when the search query is based on clusters of 7-10 documents. This suggests that the 7 to 10 highest weighted news stories in a
user profile represent best the user’s current interests, answering research question (Q1). An interesting result is that the parameter does not influence the performance of Baseline run (B) significantly. This indicates that nouns and foreign names are not optimal to represent the content of a document. The more stories are used to determine the most frequent nouns, the higher is the total number of nouns. The Baseline run exploits this increasing number of nouns and combines the most frequent ones using the “or” operator. The stable performance suggests that the increasing number of nouns does not directly influence the retrieval performance. A reasonable explanation for this is that the most frequent nouns are just not specific enough and hence do not retrieve relevant stories. In comparison, the more specific concepts show a better retrieval performance, suggesting that these, more specific entities, are a better source to create a search query. Both Baseline and Concept runs are outperformed by the Category run, which suggests that exploiting the semantic context of stories in the user profile results in better news recommendations.
In order to evaluate the second research question, we compare the MAP of all users for a variable query length . Figures 9, 10 and 11 plot the according values for the Baseline run (B), Concept run (C) and Category run (DBpedia).
Figure 8: MAP per Query Length for Baseline run (B)
[image:26.595.199.395.385.563.2]Figure 10: MAP per Query Length for Category run (DBpedia)
These figures reveal a minimal or no improvement with longer search queries. A saddle point can be seen between 9-10 queries, suggesting that this might be the optimal query length to identify similar news stories. This would answer research question (Q2). Again, the Category run outperforms both Baseline run and Concept run, suggesting the effectiveness of exploiting the generic DBpedia ontology to recommend related news stories.
An important question is whether this performance difference is significant. Therefore, we performed the Wilcoxon rank-sum test [35] on the MAP of all runs of every user for every value of query length and each number of stories used for clustering. Tables 6, 7 and 8 list the values of this non-parametric statistical test for a variable number of stories used for clustering and a constant query length = 9. Note that similar values can be observed for a variable length of the search query.
4 5 6 7 8 9 10 20 30 40 50 U1 0.249 0.093 0.243 0.054 0.855 0.415 0.535 0.591 0.689 0.531 0.651
U2 0.042 0.859 0.416 0.393 0.501 0.042 0.098 0.029 0.353 0.026 0.084
U3 0.386 0.001 0.018 0.019 0.000 0.000 0.002 0.009 0.008 0.178 0.126
U4 0.499 0.485 0.826 0.640 0.503 0.559 0.317 0.556 0.467 0.575 0.679
U5 0.013 0.001 0.040 0.047 0.009 0.022 0.010 0.274 0.069 0.120 0.092
U6 0.002 0.001 0.020 0.069 0.027 0.027 0.009 0.000 0.000 0.000 0.001
U7 0.993 0.571 0.474 0.822 0.293 0.193 0.752 0.769 0.772 0.934 0.927
U8 0.014 0.030 0.020 0.808 0.865 0.892 0.898 0.012 0.089 0.089 0.051
U9 0.627 0.453 0.273 0.961 0.758 0.984 0.204 0.001 0.000 0.000 0.000
U10 0.010 0.023 0.014 0.025 0.174 0.235 0.084 0.027 0.002 0.002 0.002
U11 0.007 0.045 0.085 0.123 0.111 0.053 0.084 0.048 0.084 0.079 0.041
U12 0.139 0.162 0.175 0.059 0.229 0.058 0.260 0.031 0.032 0.047 0.744
U13 0.001 0.001 0.010 0.011 0.006 0.009 0.023 0.066 0.104 0.284 0.002
U15 0.007 0.007 0.002 0.001 0.001 0.003 0.009 0.008 0.014 0.029 0.016
U16 0.001 0.005 0.003 0.013 0.010 0.003 0.001 0.001 0.001 0.001 0.007
U17 0.055 0.046 0.068 0.085 0.172 0.347 0.135 0.060 0.073 0.119 1.138
[image:28.595.118.479.146.190.2]U18 0.046 0.045 0.085 0.123 0.111 0.053 0.084 0.084 0.048 0.060 0.138
Table 6: Wilcoxon rank-sum test for variable number of stories used for clustering (Baseline run vs. Concept run)
4 5 6 7 8 9 10 20 30 40 50 U1 0.004 0.029 0.019 0.020 0.001 0.120 0.097 0.002 0.005 0.026 0.008
U2 0.011 0.344 0.266 0.019 0.129 0.014 0.000 0.000 0.000 0.000 0.000
U3 0.744 0.165 0.134 0.266 0.374 0.035 0.490 0.718 0.287 0.561 0.307
U4 0.179 0.027 0.596 0.966 0.938 0.871 0.501 0.030 0.062 0.107 0.282
U5 0.026 0.001 0.017 0.011 0.003 0.011 0.813 0.319 0.407 0.001 0.878
U6 0.017 0.001 0.129 0.971 0.702 0.021 0.013 0.005 0.001 0.001 0.003
U7 0.000 0.001 0.038 0.301 0.555 0.592 0.170 0.009 0.068 0.064 0.168
U8 0.923 0.708 0.827 0.505 0.151 0.057 0.009 0.048 0.011 0.005 0.008
U9 0.068 0.147 0.035 0.130 0.141 0.111 0.793 0.792 0.812 0.644 0.962
U10 0.483 0.004 0.523 0.009 0.025 0.087 0.155 0.313 0.524 0.524 0.394
U11 0.002 0.008 0.003 0.001 0.001 0.001 0.004 0.008 0.011 0.059 0.023
U12 0.010 0.051 0.013 0.058 0.063 0.020 0.017 0.001 0.003 0.059 0.023
U13 0.035 0.076 0.055 0.124 0.422 0.166 0.108 0.053 0.048 0.095 0.225
U14 0.022 0.030 0.039 0.057 0.051 0.037 0.067 0.047 0.038 0.045 0.028
U15 0.252 0.059 0.041 0.048 0.013 0.013 0.071 0.011 0.021 0.002 0.650
U16 0.163 0.466 0.265 0.209 0.264 0.057 0.072 0.001 0.001 0.002 0.650
U17 0.003 0.001 0.004 0.021 0.018 0.063 0.052 0.097 0.090 0.370 0.019
[image:28.595.120.479.231.421.2]U18 0.030 0.024 0.015 0.001 0.001 0.001 0.016 0.066 0.072 0.161 0.436
Table 7: Wilcoxon rank-sum test for variable number of stories used for clustering (Baseline run vs. Category run)
4 5 6 7 8 9 10 20 30 40 50 U1 0.000 0.000 0.000 0.000 0.004 0.009 0.006 0.022 0.053 0.002 0.005
U2 0.008 0.003 0.043 0.008 0.010 0.793 0.224 0.710 0.021 0.003 0.001
U3 0.035 0.003 0.024 0.040 0.129 0.343 0.274 0.255 0.064 0.155 0.032
U4 0.257 0.250 0.890 0.337 0.963 0.984 0.844 0.421 0.533 0.436 0.344
U5 0.037 0.047 0.258 0.092 0.408 0.649 0.899 0.138 0.614 0.220 0.137
U6 0.806 0.023 0.371 0.285 0.344 0.747 0.799 0.297 0.199 1.000 0.875
U7 0.012 0.007 0.001 0.051 0.001 0.003 0.012 0.102 0.243 0.549 0.016
U8 0.000 0.000 0.000 0.001 0.005 0.001 0.064 0.031 0.199 0.106 0.140
U9 0.133 0.001 0.001 0.008 0.005 0.007 0.048 0.006 0.001 0.003 0.002
U10 0.000 0.000 0.000 0.001 0.001 0.015 0.007 0.000 0.000 0.000 0.000
U11 0.015 0.031 0.015 0.001 0.001 0.006 0.073 0.019 0.115 0.606 0.171
U12 0.034 0.093 0.049 0.103 0.113 0.070 0.029 0.010 0.006 0.013 0.096
U13 0.004 0.058 0.004 0.043 0.176 0.048 0.082 0.018 0.012 0.016 0.037
U14 0.018 0.019 0.030 0.125 0.089 0.074 0.096 0.073 0.077 0.077 0.102
U15 0.571 0.091 0.086 0.013 0.042 0.007 0.173 0.035 0.026 0.032 0.857
U16 0.350 0.388 0.414 0.56 0.321 0.109 0.066 0.004 0.003 0.022 0.318
U17 0.009 0.001 0.010 0.139 0.086 0.237 0.182 0.339 0.258 0.686 0.034
U18 0.044 0.015 0.161 0.414 0.543 0.767 0.724 0.545 0.626 0.950 0.160
[image:28.595.121.478.463.651.2]Overall, the tables support our conclusions drawn from Figures 6-11. Using a significance level of 95%, the Baseline run is, apart from outliers, significantly outperformed by both Concept run and Category run. Further, in most cases, the Concept run is significantly outperformed by the Category run. A large performance difference between different users can be noted though. While the semantic based approaches return significantly better recommendations for some users, it does not provide better recommendations for other users.
[image:29.595.128.471.441.599.2]Figure 11: Recommendation Performance of User 6 for every evaluated day with respect to MAP and P(5)
Figure 12: Recommendation Performance of User 4 for every evaluated day with respect to MAP and P(5)
comparison for a representative user (User 4) where the Category run was not the most successful run.
Various conclusions can be drawn from these two figures. First of all, in both cases, the recommendation quality fluctuates massively. The peaks, however, appear synchronously in all runs. As shown in Figure 4, a similar fluctuation appears in the assessed list of relevant stories. We therefore conclude that the ground truth directly influences the quality of the recommendation. Moreover, the recommendation quality
does not decrease toward the end of each user’s profile. Considering that the user
profiles are created using implicit relevance feedback, this observation is very interesting. It supports our hypothesis (H1) that implicit relevance feedback can be successfully exploited to create efficient long-term user profiles.
8 Discussion and Conclusion
In this paper, we have introduced and fine tuned various parameters of a long-term user profiling and recommendation system. The recommendation technique is based on the idea that ontologies can be exploited to set news stories into their semantic context. We introduced a novel news video recommender system which captures daily broadcasting news and segments the bulletins into semantically related news stories. Moreover, the Linked Open Data cloud is exploited to set these stories into context. This semantic augmentation of the news stories is used as the backbone of our news video recommendation.
We further suggest the development of a new test collection used for studying long-term user modelling techniques in video retrieval. We first introduced an approach of generating independent ground truth lists. In order to reduce the amount
of manual labour, we aimed at adapting the documents to assess to the assessors’
personal interests. Therefore, volunteers were asked to assess a textual news corpus and to identify news stories they are interested in. Further, they were asked to categorise these news stories into specific news topics. This first assessment step
enables us to identify the assessors’ interests in news topics. We further exploit this
knowledge and identify potential relevant videos in a news video corpus. The assessors were then asked to assess the relevance of this subset. In order to study long-term profiling, we propose a simulation based evaluation scheme. We defined unique interaction patterns and identified usage patterns by exploiting a preceding user study. Moreover, we employ both patterns and ground truth lists to generate long-term user profiles. We then used these user profiles to evaluate our hypotheses and to fine tune various recommendation parameters.
One hypothesis we aimed at evaluating was whether implicit relevance feedback can be used to create appropriate long-term user profiles. We introduced an implicit
user modeling approach which automatically captures the users’ evolving information
simulations seem to support both hypotheses. The long-term profiles do not illustrate a lower quality of news recommendations after numerous iterations. Hence, we conclude that implicit relevance feedback can effectively be used for long-term user profiling. Moreover, the ontology-based recommendations outperform the other comparative runs. Therefore, we conclude that the use of an ontology can lead to better recommendations.
Using a classical evaluation scheme, such an evaluation would have been challenging. The main conclusion which can therefore be drawn is that the introduced data collection can be used for the benchmarking of long term recommendation approaches. We therefore conclude that our methodology can play an important role in the development of long-term user profiling approaches. Since all results are achieved by employing a simulation, further runs can be performed to fine tune recommendation parameters. Nevertheless, we believe that even though simulations can be used to indicate which retrieval approach is better, it does not replace real user studies. Real users that actually use the system for their own purpose will behave smarter than simulated users. They will, for instance, not just click on random non-relevant news story. Therefore, we conclude that user simulations can be used for benchmarking different approaches, which then have to be confirmed by a successive user study.
Future work therefore includes a thorough analysis of the outcome of the user simulation, including a long-term user study to support our conclusions.
References
1. Spink, A, Greisdorf, H., and Bateman, J. From highly relevant to not relevant: examining different regions of relevance. Inf. Process. Manage. 34, 5, 599–621, 1998 2. Nichols, D. M. Implicit rating and filtering. In Proc. 5th DELOS Workshop on
Filtering and Collaborative Filtering, pages 31-36, ERCIM, 1998.
3. Campbell, I. and van Rijsbergen, C.J. The Ostensive Model of Developing Information Needs. In Proc. Conf. Library Science, pages 251-268, 1996.
4. Chen, L. and Sycara, K. WebMate: A personal agent for browsing and searching. In
Proc. Autonomous Agents, pages 132-139, New York, 1998.
5. Hancock-Beaulieu, M. and Walker, S. An evaluation of automatic query expansion in an online library catalogue. Journal of Documentation 48, 4 (1992), 406–421. 6. Bharat, K., Kamba, T. and Albers, M. Personalized, interactive news on the Web.
Multimedia Systems, 6(5):349-358, 1998.
7. Smeaton, A. F., Over, P., and Kraaij, W. 2006. Evaluation campaigns and TRECVid. In Proc. MIR’ 2006, pages 321-330, 2006.
8. Smeaton, A.F., Wilkins, P., Worring, M., de Rooij, O., Chua, T.S., Luan, H. Content-based video retrieval: Three example systems from TRECVid. International Journal
Imaging Syst. Technol., 18(2-3):195-201, 2008.
9. Ivory, M., Hearst, M. The state of art in automating usability evaluation of user interfaces, ACM Computing Surveys, 33(4), pages 470-56,2001.
10. Finin, T.W. GUMS: A General User Modelling Shell. User Models in Dialog
Systems, pages 41-430,1989.