by
Horst Posselt
A thesis submitted in partial fulfilment of the requirements for the Master of Arts in Demography at the Australian National University.
DEDICATION
Except where otherwise indicated, this thesis is my own work.
ACKNOWLEDGEMENTS
I wish to express my gratitude to my employer, the Australian Bureau of Statistics, who by offering a Major Study Award enabled me to undertake this study. My gratitude is also extended to management and staff members in the Population Census and Social Analysis and Reporting areas of the Bureau who assisted me in obtaining and generating the required data tapes. Producing the tapes was a task with which I was not familiar and with its many steps proved to be a time consuming process. I am particularly thankful to Simone Knights and Richard Grant who tutored me in these processes. I also thank Jim Elliott who assisted with producing several tables from data tapes held by the Demography Section.
ABSTRACT
In the five year period 1981 to 1986, over 228,000 or one- fifth of people in New South Wales, who, at 30 June 1986 were aged 55 years or older, had changed their place of usual residence. The extent to which this level of mobility alters the spatial distribution of the elderly, who with increasing age have particular requirements in health care, housing and various forms of social support, can have important implications for the planning and delivery of such services. Accordingly, this thesis investigates the residential mobility and patterns of inter-regional migration of elderly people in New South Wales (NSW). The Australian Capital Territory (ACT), landlocked within NSW as it is, is treated as an integral part of the study region. The age group 55 years and over is preferred to an older one as suitably defining the elderly. This choice is made due to the increasing importance of early retirement and the high propensity of early retirees to change their places of usual residence (Chapter 3).
V
CONTENTS
Dedication i
Declaration ii
Acknowledgements iii
Abstract iv
Contents vi
List of Tables viii
List of Figures x
List of Appendices xi
CHAPTER 1 INTRODUCTION 1
1.1 Aims and Scope of the Study 1
1.2 Ageing, Population Redistribution and Elderly
Migration 2
1.3 Relationship to Other Studies 4
1.4 Study Outline 5
1.5 The Data 6
1.5.1 Information Recorded by the 1986 Census
and Its Limitations 6
1.5.2 Data Availability 8
1.5.3 Data Quality 12
CHAPTER 2 LITERATURE REVIEW 17
2.1 Concerns and Study Approaches 17
2.2 Mobility Differentials and Motivations 19 2.3 Economic and Environmental Factors 22 2.4 Kin as a Factor in Mobility Patterns 23
2.5 Typologies of Elderly Migration 25
2.6 Conclusion 26
CHAPTER 3 MOBILITY LEVELS AND DIFFERENTIALS AMONGST
THE ELDERLY POPULATION 28
3.1 Introduction 28
3.2 Age-sex Differentials in Mobility 29
3.3 Marital Status Differentials 31
3.4 Mobility Associated with Retirement 35 3.5 Mobility Associated with Declining
Health Status 37
vii
CHAPTER 4 SPATIAL PATTERNS OF MOVEMENT AND THE IMPACT
OF ELDERLY MIGRATION 40
4.1 Regional Definitions and Population Distribution 40 4.2 Spatial Patterns of Elderly Migration 43
4.2.1 Interstate Migration Flows 43
4.2.2 Within State Flows 47
4.3 The Impact of Elderly Migration on
Administrative Regions 50
4.4 Migration Flows of the Elderly Compared to
General Migration 54
4.5 Locational Preferences and the Impact of Migration
in Local Government Areas 55
4.5.1 Non-metropolitan Areas 56
4.5.2 Sydney Statistical Division 61
4.6 Summary of Migration Patterns 63
CHAPTER 5 MIGRATION BETWEEN ENVIRONMENTAL TYPES,
AND THE CHARACTERISTICS OF MIGRANTS 65
5.1 The Framework for Analysis 65
5.2 Environmental Preferences and Later Life-cycle
Stages 68
5.3 Age, Sex and Marital Status 72
5.4 Living Arrangements 74
5.5 Socio-economic Characteristics 81
5.6 Conclusion 86
CHAPTER 6 REVIEW, FUTURE PROSPECTS AND IMPLICATIONS 87
6.1 Review 87
6.2 Future Prospects and Implications 89
6.3 Avenues for Further Research 91
LIST OF TABLES
Table Page
1.1 The Elderly and Total Population: P r o j e c te d Growth,
A u s t r a l ia and New South Wales 1988-2021 ... 3
1.2 Sele c t e d Age Groups: P e r c entages Not R es po n d i n g to the
1986 Census Internal M i g r a t i o n Questions, A u s t r al ia ... 13
3.1 Persons A g e d 55 and Over: P e r c entages Not in the Labour
Force by Age and Sex, 1976 and 1986, and 1984-1985 M o b i l it y Rates by Age, Sex and Labour Force Status,
A u s t r a li a ... 29
3.2 Persons A g e d 55 and Over: Percentages Who M ov ed by Age,
Sex and Marital Status, N S W - A C T 1981-1986 ... 34
3.3 M o vers in Selected Age Groups: Perce n t a g e Distrib u t i o n
by Scale of Movements, N S W 1981-1986 ... 37
3.4 Persons A g e d 60 and Over: P e r c entages D is a b l e d and
P er c en t a g e s Also H a n d i c ap pe d by Severity of Handicap
and Age, A u s t r a li a 1988 ... 38
4.1 Persons A g e d 55 and Over, Total Population, Percentage
of Total P o p ul a t i o n A g e d 55 and Over and P o pulation
D e n s i t y by Statistical Division, NSW- A C T 1986 ... 42
4.2 Persons A g e d 55 and Over: Inward, O u t w a rd and Net
Interstate Movements, NSW-ACT 1981-1986 ... 44
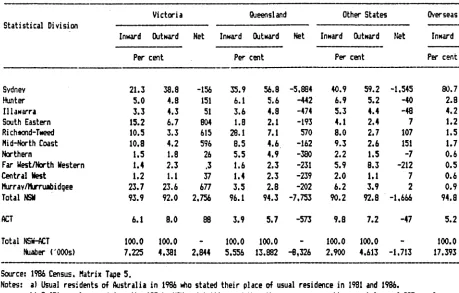
4.3 Persons A g e d 55 and Over: D is tr i b u t i o n of Inward,
O u tw ar d and Net Interstate and Overseas M o v e ments by
Statistical Division, NSW- A C T 1981-1986 45
4.4 P e r sons A g e d 55 and Over: Percen t a g e D is tr i b u t i o n of
I ntra-State O u t - m ig r a t io n Flows, N S W Statistical
D i v isions and the ACT 1981-1986 49
4.5 Persons A g e d 55 and Over: V o l umes and Rates of Inward,
O u tw a r d and Net Movements, N S W Statistical Divisions
and the ACT 1981-1986 51
4.6 Co m p o n e n t A v e r a g e Annual G rowth Rates of the Population
A g e d 55 and Over, N S W Statistical Divisions and the ACT
1981-1986 52
4.7 Persons A g e d 55 and Over: Statistical Local Areas with
the Largest Net M i g ra t i o n Gains and Losses, NS W
ix
Table Page
4.8 Cohorts Aged 55 and Over: Distribution of Net Migration to Coastal Local Government Areas, NSW 1961-1971,
1966-1976 and 1985-1986 60
5.1 Persons Aged 55 and Over: Indices of Preference for Migration Flows Between Environmental Regions by Age,
NSW-ACT 1981-1986 69
5.2 Persons Aged 55 and Over: Summary Age, Sex and Marital Status Characteristics by Intra-State Mobility Status,
NSW-ACT 1981-1986 73
5.3 Living Arrangements of Persons Aged 55-64 and 75 and Over: Percentage Distribution by Sex and Intra-State
Mobility Status, NSW-ACT 1981-1986 76
5.4 Migrants Between Environmental Regions Aged 55 Years and Over Who Moved to Non-Private Dwellings: Age, Sex and Marital Status Characteristics by Type of Non-private
Dwelling, NSW-ACT 1981-1986 80
5.5 Distribution of Nursing Home and Other Institutional
Beds for Elderly People by Region NSW, 1986 81 5.6 Persons Aged 55 and Over: Median Incomes of Selected
Groups by Intra-State Mobility Status, NSW-ACT
1981-1986 83
5.7 Educational Attainment of Persons Aged 55 and Over: Age Standardised Percentages by Sex and Intra-State
Mobility Status, NSW-ACT 1981-1986 85
5.8 Occupations of Employed Men Aged 55-64: Percentage Distribution by Intra-State Mobility Status, NSW-ACT
LIST OF FIGURES
Figure Page
1.1 Persons Aged 55 and Over: Enumeration Characteristics
and 1981-86 Mobility Status, NSW-ACT ... 11 3.1 Persons Aged 55 and Over: Percentages Who Moved by
Age and Sex, NSW-ACT 1981-1986 and 1985-1986 31 3.2 Movers Aged 55 and Over: Distribution by Age and
Marital Status, NSW-ACT 1981-1986 32
3.3 Movers Aged 55 and Over: Sex Ratios by Age, NSW-ACT
1981-1986 32
3.4 Persons Aged 55 and Over: Percentages Who Moved by
Age and Marital Status: NSW-ACT 1981-1986 35 4.1 Persons Aged 55 and Over: Interstate Migration Flows,
1981-1986 43
4.2 Persons Aged 55 and Over: Net Migration Flows To and From Queensland and Victoria, NSW Statistical Divisions
and the ACT 1981-1986 46
4.3 Persons Aged 55 and Over: Net Intra-State Migration
Flows, NSW Statistical Divisions and the ACT 1981-1986. 48 4.4 Persons Aged 55 and Over: Sex Ratios of In-migrants and
Out-migrants, NSW Statistical Divisions and the ACT
1981-1986 53
4.5 Migration Effectiveness Ratios of Elderly and Younger Inter-regional Migrants, NSW Statistical Divisions and
the ACT 1981-1986 54
4.6 Net Impact of Elderly Migration on the Population Aged 55 and Over, NSW Non-metropolitan Statistical
Local Areas 1985-1986 58
4.7 Net Impact of Elderly Migration on the Population Aged 55 and Over, Sydney Statistical Division Local
Government Areas 1985-1986 62
5.1 Persons Aged 55-64 and 75 and Over: Intra-State Migration Flows With at Least Double the Expected Numbers of Migrants, Environmental Regions NSW-ACT
1981-1986 71
5.2 Persons Aged 55-64 and 75 and Over in Private Dwellings Who Did Not Live With a Spouse or Partner: Percentages of Men and Women Who Lived Alone by Intra-State
xi
LIST OF APPENDICES
Page
1 Listing of Local Government Areas and Correponding
Statistical Local Areas in NSW, 1986 Census ... 103 2 1986 Census Matrix Tapes: Tape References and
Specifications ... 104 3 Reference Map of New South Wales, 1986 Census Local
Government Area and Statistical Division Boundaries .. 109 4 Listing of Local Government Areas by Environmental type,
NSW-ACT ... 110
Tables
1 Residents of NSW-ACT: Numbers and Percentages Who Moved
by Age, 1981-1986 112
2 Persons Aged 55 and Over: Gross Interstate Migration
Flows, Australia 1981-1986 112
3 Persons Aged 55 and Over: Gross Intra-State Migration
by Statistical Division, NSW-ACT 1981-1986 ... 113 4 Persons Aged 55 and Over: Absolute and Relative Inward,
Outward and Net Migration by Statistical Local Area,
NSW 1985-1986 114
5 Persons Aged 55 and Over: Gross Intra-State Migration
CHAPTER 1
INTRODUCTION
1.1 Aims and Scope of the Study
This study is concerned with the residential mobility and migration of elderly people within New South Wales, Australia's most populous State. It aims to obtain insights into their movement patterns particularly as they relate to later-life transitions extending from the years associated with retirement from the labour force to those associated with physical infirmity and a greater demand for community assistance. It also aims to identify those areas between which the elderly are migrating and the localities in which the demographic impact of their movements has been greatest. Together these aims are intended to provide information which will assist in predicting future migration patterns and in planning the delivery of various age-related services.
2
regional planning perspective such movements are of little relevance. Second, movements between communities often involve different sets of motivating factors to those that occur within communities. This can be readily appreciated from the fact that a long distance move is likely to disrupt a greater number of previous contacts with friends, relatives and other affiliations associated with the former place of residence.
1.2 Ageing, Population Redistribution and Elderly Migration
The elderly represent the fastest growing age group in Australia. According to projections prepared by the Australian Bureau of Statistics, the numbers of people aged 55 years and over are expected to increase at twice the rate of the rest of the population between 1988 and 2021, with the rates of increase being higher for each older age group (Table 1.1) . The trend in New South Wales (NSW), is similar, although projected rates of increase are slightly lower. Nevertheless, the trend, following from past and continued declines in fertility and increasing longevity, will see the representation of elderly people in NSW increase from 21 per cent of the population in 1988 to 29 per cent by the year 2021, or from 1.17 million in 1988 through 1.48 million in 2001 to 2.34 million in 2021.
populations. The growth rates of elderly populations in particular localities within the State have been highly variable, with internal migration being a major factor accounting for the differences (see Chapter 4). An understanding of recent patterns of elderly migration provides insights into likely future trends, which are essential to the effective planning of age-related services.
Table 1.1 The Elderly and Total Population: Projected 6rowth, Australia and New South Hales 1988-2021
Australia
1988 Population ('000s) Percentage increase 1988-2021 New South Hales
1988 Population ( ‘000s) Percentage increase 1988-2021 Contribution to Total Population
2001 Number ('000s) Per cent 2021 Number ('000s)
Per cent
Age Group
All
55+ 65+ 75+ Ages
3,265.8 114.6
1,799.8 119.9
696.8 132.7
16,531.9 49.6
1,176.1 98.9
648.5 105.0
247.4 120.4
5,699.3 42.7
1,478.3 21.9
842.4 12.5
381.7 5.7
6,754.8 100.0 2,339.6
28.8
1,329.3 16.3
545.4 6.7
8,135.5 100.0 Source: Office of the Commissioner for the Ageing (1989, Tables 1 and 2)
Notes: The projections, prepared by the Australian Bureau of S ta tis tic s , were based on preliminary 'estimated resident population' figures at June 30, 1988 and projection series A assumptions, with the following variants -
M ortality (as for a ll se rie s); F e rtility (High); Overseas Migration (High); In terstate Migration (Low)
4
attention is given to the relative contribution of these components to change in the various administrative regions, but the focus of this study is on the contribution of internal migration to patterns of change. Based primarily on data from the 1986 Census, the study assesses the locational preferences of elderly migrants and the net impact of migration on broad regions (Statistical Divisions) as well as local planning areas (that is, Statistical Local Areas, which for the most part are equivalent to Local Government Areas). By identifying the spatial patterns of movements, some of the reasons for migration can be inferred. An analysis of the characteristics of elderly movers and of mobility levels amongst subgroups within the elderly population is also undertaken. This assessment is important for two reasons: first, consistent variation in particular characteristics between movers and non-movers can make predictions of mobility more feasible; and second, it enables more realistic estimates to be made of the impact of migration.
1.3 Relationship to Other Studies
Goodman and Savage, 1985; Maher, 1985; Hugo, 1986a; Maher and McKay, 1986), but relatively few have been particularly focussed on the elderly. Important studies with this more specific focus include those by Murphy (1981), Barker (1984) and Hugo and Wood (1984), the former of which examines patterns of elderly migration in coastal NSW. These studies have identified the distinctiveness of the movement patterns of the elderly and the importance of coastal migration. However, when examining inter-regional migration flows the studies have generally treated the elderly as a single population group, with less attention being given to the influence of later life cycle stages in shaping migration patterns. Hugo (1986a, 1986b, and 1987) has called for additional studies to enhance our understanding of migration 'amongst' the elderly. This study follows in the descriptive mould of previous census-based studies. However, by using more recent and more detailed information than has previously been available it serves not only to confirm but to enhance knowledge of migration trends and processes within the region.
1.4 Study Outline
6
in the oldest age groups of women.
In Chapter 4, the locational preferences of movers to and within NSW are examined, as is their impact on the redistribution of the elderly. This assessment identifies the major streams of inter-regional migration and then the significance of these moves for regional and local planning areas. It also provides the basis for defining broad environmental types to which elderly migrants are attracted and from which they are drawn. Thus, popular destinations, termed 'coastal/amenity areas', are distinguished from major urban centres and typically rural areas from which many elderly migrants originate.
It is on the basis of these environmental types that Chapter 5 examines differences in movement patterns at different later life-cycle stages. Furthermore, the living arrangements and socio-economic characteristics of movers in the major migration streams are examined and contrasted with those of non-movers in the origin and destination areas. This enhances one's understanding of migration processes and enables more informative assessments to be made of the impact of migration on areas which have realised substantial net migration gains. The study concludes by assessing some of the implications of elderly migration within the NSW-ACT region.
1.5 The Data
1.5.1 Information Recorded in the 1986 Census and Its Limitations
usual place of residence on either 30 June 1985 or 30 June 1981. One limitation of these data is that the census does not provide information about all movements that occurred within the respective time periods. First, only moves of people who had survived and were still resident in Australia at the time of the census were recorded, and second, only net movements over a period were captured. People who moved away from their usual place of residence, but who had returned by the census date, were classified as non-movers, while people who changed their addresses several times are treated as having made only one move.
In the census the current and previous addresses of individuals were coded according to their locations within Statistical Local Areas (SLAs). In NSW the 186 SLAs were, for the most part, equivalent to the State's Legal Local Government Areas (Appendix 1). Studies of migration patterns between such units are obviously appropriate from a planning perspective, and migration patterns can also be assessed for aggregated areas. However, a difficulty with these units is the inability to measure within-area flows. This problem is of most significance in rural areas, since the importance of local flows from farms and smaller communities to larger towns, or vice versa, cannot be gauged.
8
kin/family members affects locational choice. A further basic problem with census data is that the characteristics of movers and their households are those recorded at the time the census was taken and not at the time of migration. For personal attributes that are constant, such as sex, or largely unvarying at older ages, such as educational attainment, this is not a problem. However, for variables such as marital status, income and housing tenure the possibility of change over the one or five year period preceding the census is greater. It is not possible to know precisely the extent to which such factors influenced decisions to migrate, although insights into reasons for migration can nevertheless be gained. This study, therefore, is necessarily driven by the available data. Despite these limitations, it has been from similar census- based studies that much of the current understanding of elderly migration has been obtained.
1.5.2 Data Availability
While the available matrix tapes had the advantage of containing information for the total population, they were severely limited in terms of the number and detail of variables available for cross-tabulation. Thus, for example, some tapes provided detailed geographic information but very few, coarsely-classified data items relating to the characteristics of movers. Apart from age (which was usually insufficiently disaggregated) , sex and marital status, the available variables were more relevant to the study of labour-related migration. While in order to limit costs use was made of the available tapes, additional matrices were generated to overcome some of these difficulties. Full details of tape specifications and their references are provided in Appendix 2. It should be noted that the additional matrix tapes only related to persons aged 55 years and over resident in the NSW-ACT region at the 1986 census. In generating them, it was necessary to compromise between geographic detail, whether one-year or five-year migration patterns were to be assessed, and the degree of disaggregation of cross-classificatory variables. Emphasis was placed on obtaining a range of data items relating to the characteristics of individuals and their households rather than on geographic detail, the latter being sufficiently disaggregated on pre-existing tapes. Most of the available tapes related to the five-year migration period and it was decided to concentrate on this period. A major advantage of doing this is that the observed migration patterns are more likely to be indicative of
longer term trends.
10
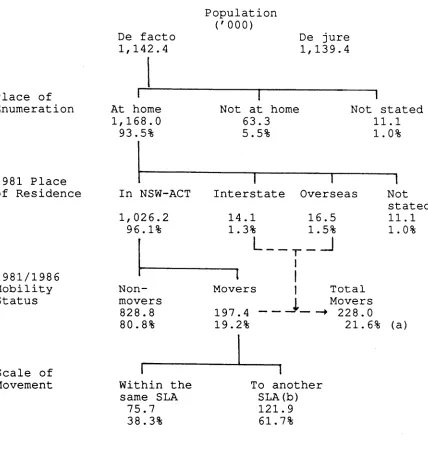
exclude persons who have temporarily left the NSW-ACT region and include temporary visitors from interstate and overseas. Amongst other complications this difference means that population figures in the various chapters do not correspond. While the difference in the base population is small for NSW-ACT as a whole (Figure 1.1), differences become greater within the various sub-regions.
With the tapes specially created for the NSW-ACT region it is possible to separately identify people who were enumerated at their usual place of residence from those who were not. Together, temporary migrants to and within the region represented six per cent of the de facto population (Figure 1.1). The movement patterns of these temporary migrants is itself a topic of interest, particularly since moves may be precursors to more permanent settlement (Krout,
1983:299) and concentrations of temporary migrants in particular localities may have a substantial seasonal impact on the demand for age-related services (Monahan and Greene, 1982 :163) . The focus of this study is, however, on factors associated with more permanent changes in residence.
Figure 1.1 Enumeration Characteristics and 1981-86 Mobility Status of Persons Aged 55 Years and Over in the NSW-ACT Study Region
Population
(' 000)
De jure 1,139.4
Place of Enumeration
1981 Place of Residence
1981/1986 Mobility
Status
De facto 1,142.4
At home 1,168.0 93.5%
In NSW-ACT
1,026.2 96.1%
N o n movers
828.8 80.8%
Not at home 63.3 5.5%
Not stated 11.1 1.0%
Interstate Overseas
14.1 1.3%
I___
T16.5 1.5%
_
J
Not stated 11.1 1.0%
Movers
197.4 -19.2%
Total Movers
228.0
2 1.6% (a)
Scale of
Movement Within the
same SLA 75.7 38.3%
To another SLA(b) 121.9 61.7%
Source: 1986 Census Matrix Tapes
a) Total persons who had moved as a proportion of total persons
enumerated at their places of usual residence in 1986 and who had stated their places of usual residence in 1981.
[image:23.551.54.482.144.599.2]12
migration behaviour of the entire de jure population. It should also be noted that in classifying families and households the census included both temporary absentees (if the absentee(s) was a spouse or dependent family child) and temporary residents when creating particular family types. This means that even for usual residents of a particular dwelling, their usual household/family composition will be misrepresented by the presence of temporary residents or the temporary absence of less directly related individuals.
1.5.3 Data Quality
The census, like all surveys, is subject to a number of sources of error. The main sources are: under-enumeration; partial response; respondent error; processing error; and, in terms of the final data, introduced random error. With respect to coverage, the post-enumeration survey conducted after the census found an under-enumeration rate of 1.9 per cent for Australia as a whole (ABS, 1990, Table 10) . Overall the elderly had an under-enumeration rate below that of the population at large but there was a tendency for the rates to increase with age amongst those aged over sixty. The highest rate amongst the elderly was recorded for women aged 75 and over (2.1 per cent). In NSW, the under-enumeration rate for the total population was 1.5 per cent (ABS, 1990, Table 5).
were highest for the reference date furthest away from census night. These associations suggest that there may be a recall problem amongst the very old and it could also be that the very old are more likely to have census forms filled out on their behalf.
Table 1.2 Selected Age Groups: Percentages Not Responding to the 1986 Census Internal Higration Questions, Australia
Place of Usual Elderly People by Age All
Residence - - - Persons
Reference Date: 55-59 60-64 65-69 70+
30 June 1986 0.8 0.9 1.0 1.1 1.0
30 June 1985 1.3 1.4 1.5 2.2 1.7
30 June 1981 1.6 1.7 1.9 3.2 2.4
Source: 1986 Census, Cross-classified Table CX0008
Reasons for non-response to the migration questions were investigated in census pre-tests prior to the 1981 census
[image:25.551.80.489.79.407.2]14
Respondent error is more difficult to assess. Computer editing procedures were used to detect and correct obvious errors but such editing cannot detect all errors. Information regarding the level and nature of respondent error in respect of the questions on internal migration is again available from the 1981 census pre-tests. The focus of these tests was the accuracy of responses to the question on place of usual residence five years ago. This was assessed by re-interviewing all respondents. Overall, about 95 per cent of respondents had given the correct place of usual residence five years ago. However, the level of respondent error was greater for movers (those who had given 'elsewhere' as a response) than for non-movers. The test found that 97 per cent (of 212 respondents) who gave the answer "here” for their address five years ago gave the same response in the follow up, and that, 92 per cent (of 152 respondents) who answered "elsewhere" did so correctly by giving the same previous address.
Another problem evidenced by the test was the high frequency in which address details were inadequately reported when "elsewhere" had been ticked. Such reporting clearly creates difficulties for accurate coding. Only 77.6 per cent of pre-test movers had given full address details. However,
it was possible to impute the SLA of usual residence for the majority (96.1 per cent) of those not fully responding.
Even where complete and accurate information is available, errors can arise if coders or key-entry staff assign incorrect codes. While such errors were kept to a minimum by a quality control system involving sample checks of completed work and corrective action, discussions with key staff involved in processing the internal migration data have suggested that the complexity and inadequacy of some of the reference materials (street and locality indexes) and insufficient checking, particularly of NSW data due to time deadlines, may have reduced the quality of the final data. Unfortunately, it is not possible to indicate the extent to which these factors affected data quality.
With respect to the other key variable, age, an examination of the distribution of the population by single years of age did not reveal any significant pattern of age heaping. This is evidenced by the extremely low value of the Myers index for age heaping (1.16). The highest level of digit preference was for the digit 9 but, with a deviation from ten per cent of 0.3 per cent, this bias was small. Since much of the analysis is based on five and ten year age groups these deviations can be safely ignored.
16
some limitations with respect to the accuracy of the data. Thus recall error, which may be more significant amongst the aged, and difficulties with accurately capturing the data due to problems with reference materials and time may have further reduced data quality.
CHAPTER 2
LITERATURE REVIEW
2.1 Concerns and Study Approaches
Since the major studies by Barsby and Cox (1975) and Karn (1977) the literature dealing with the mobility and migration behaviour of older people has expanded at an enormous rate. Demographers, geographers and gerontologists have all contributed studies in a variety of geographical settings. Most of this research has been undertaken overseas, particularly in the United States of America, but the findings of the growing number of Australian studies have tended to be in accordance with those of studies undertaken in the other developed countries. A major force in the growth of this literature has been the concern about the regional redistribution of elderly people and its social policy implications. Accordingly, a large number of studies, facilitated (in Australia, since 1976) by the inclusion in censuses of questions on previous places of residence, have described macro-geographic migration patterns and their impact on the growth of numbers of older people in various locations. Australian examples are studies by Barker (1984) and Hugo and Wood (1984) .
18
and 8) has indicated the particular attraction of the Gold Coast and Sunshine Coast regions of Queensland to elderly migrants both from within Queensland and from other States. However, numerous other popular retirement destinations within the respective States, generally situated near to major urban centres, have also been identified (Murphy, 1981:307-309; Hugo and Wood, 1984:42-44 and 75-80).
2.2 Mobility Differentials and Motivations
A dominant theme of the behavioural approach has been the recognition that the likelihood of residential relocation is strongly associated with later life cycle transitions
(Rowland, 1984a; Rogers, 1988) . Thus, the transitions from working life into retirement; from living with dependent children to an "empty nest" situation; from marriage to widowhood; and from good health to increasing frailty,
illness and dependency have been identified as major stimuli to migration.
Such differences reveal themselves in differential mobility rates according to age and marital status and Rogers (1988) has shown persistent regularities in these patterns in a variety of western countries. Typically, mobility levels tend to rise (a little) for those in their late fifties to mid-sixties, the main retirement years, after having fallen from a peak amongst those in their twenties and thirties. They then fall off again for those in their seventies before rising continuously thereafter. When disaggregated by marital status, age-specific mobility rates amongst older people are higher for widowed persons, with the differential compared to married people tending to increase at the oldest ages (Rogers, 1988:365-368). Gerontological research suggests that the fit between chronological age and later- life transitions, and more generally between age and the 'biological', 'social' and 'psychological' states of elderly people, need not be perfect (Birren, 1968:547; Butler,
20
Of course, life-cycle transitions are also important in determining mobility rates amongst younger adults for whom the propensity to relocate is considerably higher. Marriage and family building, as well as family breakdown, generate many moves amongst younger adults. However, in addition to substantive differences in the reasons for moving of this type, a basic distinction can be made with respect to the importance of work and work-related opportunities. Such opportunities do not provide an important motivation for moving amongst the elderly as they do amongst younger adults, and thus they do not tend to direct their movements to locations where work prospects are greatest.
Like general migration, the majority of moves amongst the elderly are made at the local or intra-urban level. It is at this scale that relocation motives relating to housing characteristics are most important, although their importance generally decreases amongst the oldest age groups. In a study of older people in Melbourne and Adelaide (Australian Council on the Ageing et a l . 1985:
separate houses. When investigating the reasons for relocation, the desire for a smaller house was the most commonly cited motive (20 per cent).
With advancing age, however, reasons relating to the need for companionship and/or assistance became more important. Thus, the proportion of people aged 75 and over stating that their reasons for moving were 'to be near friends',
'to live with family', 'bereavement' and 'ill-health self/family' (total 47 per cent) was higher than for those in the 60-64 and 65-74 year age groups (26 and 33 per cent respectively). Meyer and Speare (1985:82), in a longitudinal study of adult residents of Rhode Island, found that local moves for assistance reasons (vis-a'-vis long distance moves and local moves for other reasons) became increasingly predominant with increasing age.
Studies of people migrating across regional boundaries have indicated an over-representation of the relatively affluent aged. In the United States migrants to the sun-belt States tended to be selected from upper income and higher educational ranks and also had better housing and higher home ownership rates (Biggar, 1980:190; Longino and Biggar,
representation of married people in amenity-oriented migration streams.
2.3 Economic and Environmental Factors
Economic considerations are generally given much attention in most thinking on inter-regional migration and, although jobs and employment income are obviously of less significance to the elderly, other kinds of economic concern remain. Murphy (1979:85) points to cost differentials between the larger cities (with high living costs) and the smaller retirement settlements as an important determinant of inter-regional migration. A further economic incentive is provided by the possibility of making a capital gain by trading down from a higher-valued metropolitan dwelling to a lower-priced dwelling in a retirement area. Fournier et a l . (1988:189) hypothesize that elderly migration is a response to the opportunity to improve real incomes, and provide strong evidence of the influence of costs of living in directing inter-state streams of elderly migrants in the United States.
selectivity on the basis of previous occupation. Karn's (1977:34) study in England also revealed differences in the degree of socio-economic selectivity characterising different coastal retirement communities.
In addition to an attraction to places with lower costs, the familiar pattern in elderly migration has been the attraction of migrants to places with high environmental amenity, and in particular, places with warmer climates. In Australia, retirement communities are most commonly found along the coast, but are also located in pleasant mountain or riverside locations (for particular localities in NSW see Murphy, (1981:43) and more generally, Hugo and Wood, (1984: 42-43)) . This form of elderly migration is normally associated with the desire to disengage from previous lifestyles to easier-going situations. Certainly case studies of motivations for movement to retirement resort areas indicate this desire (Karn, 1977:50; O'dea, 1982:39-41 and 63) . The physical attractiveness of the environment, availability of recreational and social opportunities (such as golf, fishing, membership of clubs or church groups), and of shopping and service facilities all play a role in attracting migrants to particular locations. The dominance of these environmental factors is reflected in the distinctive terminology developed in studies of elderly migration; terms such as 'amenity migration' and 'sun-belt migration' are commonly used.
2.4 Kin as a Factor in Mobility Patterns
24
those who are least likely to disrupt family ties by moving (Bultena and Marshall, 1970:91-92; Gober and Zonn, 1983:289 and 292) . It is with the loss of a spouse and the development of chronic health conditions, generally at older ages, that kinship ties have been held to be of particular influence in patterns of relocation. Under these circumstances moves, irrespective of scale, are commonly made towards children (Litvak and Longino, 1987:267).
While Australian studies have revealed a strong preference amongst the elderly to live independently from their children (Kendig, 1981:99; Coleman and Watson, 1984:56), there is overwhelming evidence that they maintain strong bonds and frequent contact with their children. The term 'modified extended family' has been coined to refer to the importance of family networks in providing support for the aged, even though they commonly reside in a separate dwelling (Day, 1985:82). Day indicates that a principle of substitution operates with respect to aged support patterns:
"couples tend to rely on each other, widows tend to rely on their children, and the childless unmarried turn for assistance to community services"
(Day, 1985:82).
In their survey of elderly women in Sydney and Canberra, Coleman and Watson (1984:57) found that the most common reason for relocation, particularly amongst migrants to Canberra, was family considerations. Family considerations were especially prominent in the responses of widows who had relocated. Movement to dwellings near to family members or even into their households may not only be motivated by the desire for assistance and/or companionship; older people can also provide considerable assistance to their offspring, especially in the area of childcare. Nevertheless, proximity to children would appear to be a strong motivation
counter-migration streams to metropolitan areas and to the northern States in the USA have been used to infer kinship migration (Litvak and Longino, 1987:268). Providing some confirmation of these patterns Clifford et al. (1982) investigated the living arrangements of the elderly in various mobility categories. Amongst elderly migrants to and within metropolitan areas they found an over representation of persons with living arrangements indicative of greater dependency (that is, persons who are other relatives of household heads). This selectivity was in marked contrast to elderly migrants from metropolitan to non-metropolitan areas, amongst whom a greater representation of household heads or spouses was evident.
2.4 Typologies of Elderly Migration
26
The developmental approach proposed by Litvak and Longino focuses more particularly on the human life course and its associations with social support systems to predict migration patterns amongst the elderly. Three basic types of move are defined. The first move occurs when retirees are healthy and have intact marriages and retirement income. The reasons for relocation have to do with attraction to amenities, the maintenance of friendship networks and, sometimes, health considerations. Generally moves to warmer climates are favoured. Also, at this stage of life, kin networks are managed from a distance. Movers tend to be healthier, wealthier and younger. The second move is related to the need for assistance arising from the development of chronic conditions. The need is compounded by widowhood. It is argued that friends and formal organisations often cannot provide sustained assistance, setting up the pressure to move towards children. The final type of movement is produced by limitations in the capacity of kin resources to provide continuous care. These moves are to institutional settings and tend to be local rather than long distance. While an elderly person will not necessarily make any of these moves, it is into these three types that Litvak and Longino classify most migratory moves of elderly people.
2.6 Conclusion
frameworks for assessing patterns of inter-regional migration, the primary concern of this study. Research within Australia to date suggests that the behavioural approaches described provide a meaningful basis for assessing internal migration amongst the elderly. Accordingly, this study pays particular attention to the
28
CHAPTER 3
MOBILITY LEVELS AND DIFFERENTIALS AMONGST THE ELDERLY POPULATION
3.1 Introduction
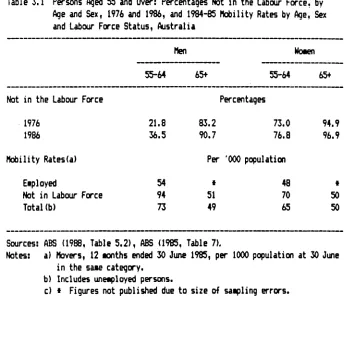
Before examining inter-regional flow patterns, it is instructive to examine the extent to which the elderly are prone to residential relocation and to obtain an impression of the scale of their movements. In this chapter particular attention is paid to age, sex and marital status differentials in the propensity to move. These variables serve as indicators of the later life-cycle transitions (retirement, widowhood and the onset of chronic disabilities) that are noted in the literature as providing keys to an understanding of the patterns of elderly migration. The elderly have been defined as persons aged 55 years and over. The inclusion of persons aged 55 to 64 has been prompted by the fact that an increasing proportion of Australia's population have been retiring before the age of 65, the age at which retirement pensions are granted to men. This trend towards earlier retirement has seen the proportion of retired men (that is, men not in the labour force) in the 55-64 age group increase from 22 per cent in 1976 to 37 per cent in 1986 (Table 3.1).
and 75 and over are, on occasion, referred to as the young- old and old-old respectively.
Table 3.1 Persons Aged 55 and Over: Percentages Not in the Labour Force, by Age and Sex, 1976 and 1986, and 1984-85 Mobility Rates by Age, Sex and Labour Force Status, Australia
Men Women
55-64 65+ 55-64 65+
Not in the Labour Force Percentages
1976 21.8 83.2 73.0 94.9
1986 36.5 90.7 76.8 96.9
Mobility Rates(a) Per '000 population
Employed 54 * 48 *
Not in Labour Force 94 51 70 50
Total(b) 73 49 65 50
Sources: ABS (1988, Table 5.2), ABS (1985, Table 7).
Notes: a) Movers, 12 months ended 30 June 1985, per 1000 population at 30 June in the same category.
b) Includes unemployed persons.
c) * Figures not published due to size of sampling errors.
3.2 Age-Sex Differentials in Mobility
[image:41.551.86.433.153.503.2]30
younger adults, with the level for those aged 25-34 approaching 70 per cent (Appendix Table 1). In addition to the work and family type factors discussed in the previous chapter, higher levels of home ownership amongst the elderly are suggestive of greater residential stability. This difference was indicated in the census with 82 per cent of Australians aged 55 and over in private dwellings residing in owner-occupied dwellings (69 per cent in dwellings owned outright and 14 per cent in dwellings being purchased) compared to 64 per cent of those aged 25-34 (18 per cent in dwellings owned and 46 per cent in dwellings that were being purchased) (ABS, 1988:Table 7.4). In NSW- ACT the proportion of those aged 55 and over in owner- occupied dwellings was 83 per cent.
The distinctive age-sex differentials observed amongst the elderly in Euro-American societies are also evident amongst the elderly in NSW-ACT (Figure 3.1). The J-shaped age- mobility curves for both men and women reveal that mobility levels tend to be relatively higher around the retirement ages, fall to their lowest levels amongst those in their late sixties and seventies, and then rise continuously through the ages where physical infirmity becomes more common. This age pattern of mobility is apparent for movements occurring over both one and five year intervals prior to 1986.
Figure 3.1 Persons Aged 55 and Over: Percentages Who M o ^ d by Age and Sex, NSW-ACT 1981-1986 and 1 9 8 5 -1 9 8 6
Per oent
1 9 8 1 - 1 6 8 6
1 9 8 5 - 1 8 8 6
55-59 60-64 65-69 70-74 75-79 80-64 85-89
Age Group
Source: 1986 Census. Matrix Taoe 1. to te : See footnotes in Table 3.2.
3 . 3 M a r i t a l S t a t u s D i f f e r e n t i a l s in M o b i l i t y
While most elderly people enter the retirement years as members of married couples, mortality greatly reduces the proportions married as ageing progresses. Thus, the majority of movers amongst the old-old are widowed (Figure 3.2). In addition, the greater longevity of women ensures their greater representation in the oldest age groups, so that most moves associated with widowhood occur amongst elderly women (Figure 3.3).
[image:43.551.73.436.160.405.2]Figure 3.2 Movers Aged 55 and Over: D'stribution by Age and Marital Status, NSW-ACT 1981-1986
100%
75%
-50%
25%
Nevor mai ried
mm
mm55-59 60-64 65-69 70-74 75-79 80-84 85-89 90+ Age Group
Source: 1986 Census. M a trix Tape 1. Note: See fo o tn o te s in Table 3 .2 .
Figure 3.3 Movers Aged 55 and Over: Sex Ratios by Age, NSW-ACT 1981-1986
M ale8/100 Females
55-69 60-64 65-69 70-74 76-79 80-84 86-89 90+ Age Group
[image:44.551.101.446.139.391.2] [image:44.551.106.448.498.739.2]persons seek assistance from others following widowhood, the mobility levels of widowed people are substantially higher than those of married persons. Amongst married people the proportion who had moved between 1981 and 1986 was 18 to 19 per cent, while amongst the widowed the proportion was 25 per cent. The same difference in levels occurs for both men and women but, for both sexes, there is a tendency for the mobility levels of the widowed to increase at a faster rate than those of married people for each older age group. This suggests that with declining health the widowed are more likely to move for assistance reasons than married people.
34
Table 3.2 Persons Aoed 55 and Over: Percentaoes Who Moved bv Age. Sex and Marital Status. NSW-ACT 1981-1986(a)
Sex/Selected 5 vear age groups (b)
Marital Status Never
Married
Married Widowed Separated /Divorced
--- --- | Qtai
Total Movers ('000s) Men
55-59 26.0 20.0 26.0 44.1 22.8 29.8
65-69 24.9 18.5 24.7 36.7 20.7 18.5
75-79 22.6 15.5 22.6 29.2 17.9 7.7
85-89 27.6 21.3 31.0 35.7 26.2 2.1
Total 55+ 25.1 18.7 25.0 38.7 21.2 102.0
Women
55-59 26.2 19.8 26.1 38.4 22.7 28.8
65-69 22.1 16.8 23.2 31.0 20.0 20.7
75-79 20.1 15.6 22.7 25.7 20.3 12.9
85-89 30.6 24.8 34.0 33.3 32.7 6.6
Total 55+ 23.8 18.2 25.1 33.5 21.9 126.0
Persons
Total 55+ 24.5 18.5 25.1 35.9 21.6 228.0
Total Movers
Men 9.0 64.2
COOOs)
10.7 13.1 102.0
Women 8.2 55.5 49.4 12.9 126.0
Persons 17.2 124.7 60.1 26.0 228.0
Source: 1986 Census. Matrix Tape 1.
Notes: a) Excludes persons not enumerated at th e ir places of usual residence as well as people who did not sta te th eir places of usual residence in 1981 and 1986. b) Percentages for intermediate ape groups shown in Figure 3.4.
Figure 3.4 Persons Aged 55 and Over: Percentages Who Moved by Age and Marital Status, NSW-ACT 1981 -1 9 86
Per c e n t
Seperated/DIvoroed
Never Married
Married
55-59 60-64 65-69 70-74 75-79 80-84 85-89 90*
Age Group
Source: 1986 Census. M a trix Tape 1.
t o t e : See fo o tn o te s in T a b le 3 .2 .
3.4 M o b i l i t y A s s o c i a t e d w i t h R e t i r e m e n t
[image:47.551.95.446.72.376.2]36
conducive to this are available from the 1985 ABS Internal Migration Survey. The survey revealed that for the year ending 30 June 1985 the mobility rate of Australian men aged 55-64 who were no longer in the labour force was 75 per cent higher than that of men who were still employed (Table 3.1). The propensity to move clearly increases immediately following retirement, but there is also evidence that many moves amongst the young-old occur in anticipation of retirement. For instance, in the study of elderly migrants to the Shoalhaven Shire, O'dea (1982:34-35) found that half of the sample of elderly people had moved to the area before finally retiring, the majority of these pre-retirement migrants retiring soon after relocation. The significance of the retirement event as a trigger to relocation was further evidenced by the fact that the majority (62 per cent) of migrants who had moved to the area following retirement had done so within two years of retirement.
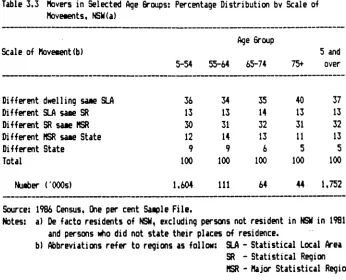
Table 3.3 Hovers in Selected Aqe 6roups: Percentage D is trib u tio n bv Scale of Movements, NSW(a)
Aqe Group Scale of Movement(b)
5-54 55-64 65-74 75+
5 and over
D iffe re n t dwelling sane SLA 36 34 35 40 37
D iffe re n t SLA sane SR 13 13 14 13 13
D iffe re n t SR sate MSR 30 31 32 31 32
D iffe re n t MSR sate State 12 14 13 11 13
D iffe re n t State 9 9 6 5 5
Total 100 100 100 100 100
Number ('000s) 1.604 111 64 44 1,752
Source: 1986 Census. One per cent Saaple F ile .
Notes: a) De facto residents of NSW, excluding persons not resident in NSW in 1981
and persons who did not s ta te th e ir places of residence,
b) Abbreviations re fe r to regions as fo llo w : SLA - S ta tis tic a l Local Area
SR - S ta tis tic a l Region MSR - Major S ta tis tic a l Region
3.5 Mobility Associated With Declining Health Status
[image:49.551.83.429.88.368.2]38
The Survey of Disabled and Aged Persons revealed that about three in five Australians aged 75 and over were in some way disabled due to losses in sight or hearing, restrictions on physical activity, or some other limiting condition, with a similar proportion being handicapped by their inability to perform basic day-to-day tasks (Table 3.4). More particularly, about one in three had a severe handicap requiring personal assistance or supervision to manage with self care, mobility and/or communication. The proportion of people needing such personal help was three times as great for those aged 75 and over as for those aged 65-74 . Clearly, those aged 75 and over are the most dependent group. However, ill-health does not necessarily lead to a residential move. The presence of a spouse or the availability of home-based family or community support services mitigates against any need to relocate. Nevertheless, as dependency increases with the severity of the limiting condition(s), an adjustment in living arrangements may become inevitable.
Table 3.4 Persons Aged 60 and Over: Percentaoes Disabled and Percentaaes Also Handicapped bv S everity of Handicap and Aqe. Australia 1988
Aqe Group
Disabled(a) Handicapped(b) Total
Persons COOOs)
Severe(c) Other Total
60-64 35.6 6.2 24.8 31.0 728.8
65-74 44.2 10.5 24.6 35.1 1,094.4
75+ 63.5 31.4 26.8 58.2 686.0
Total 47.0 15.0 25.3 40.2 2,509.2
Source: ABS (1989. Tables 5 and 10).
Notes: a) Persons with one or more d is a b ilit ie s or impairments which had lasted or were lik e ly to la s t fo r 6 months or more: includes loss of s ig h t, loss of hearing, re s tr ic tio n on physical a c t iv it ie s , and people obtaining long term treatment or medication.
b) A handicapped person is a disabled person fu rth er id e n tifie d as having lim ited a b i li t y to perform tasks in one or more of the following areas: i ) s e lf care i i ) m o b ility i i i ) verbal communication and iv ) employment c) Personal help or supervision required or unable to perform tasks
3.6 Summary
40
CHAPTER 4
SPATIAL PATTERNS OF MOVEMENT AND THE DEMOGRAPHIC IMPACT OF ELDERLY MIGRATION
4.1 Regional Definitions and Population Distribution
This chapter describes the patterns of inter-regional migration of elderly people and the significance of their migration in increasing or decreasing their representation in origin and destination areas. Unless otherwise stated, the focus is on five year migration patterns and the data refer to the usual places of residence of movers at the respective reference dates, 30 June 1981 and 1986. Apart from references to gender, no attention is given to different movement patterns amongst sub-groups of elderly migrants. Such differences are considered in Chapter 5. The migration patterns of the elderly are, however, contrasted with those of the rest of the population.
Unfortunately, the geographic units in the available data sets do not precisely match administrative regions. In the case of State Planning Area equivalents, separate information was not available for the Murray and Murrumbidgee SDs or for the Far West and North Western SDs.
In both cases, the two areas had been combined. At the more refined geographic scale the data relate to Statistical Local Areas (SLAs) . For the most part however, these are equivalent to Local Government Areas. The respective areas are depicted in reference maps provided in Appendix 3.
The investigation of flow patterns (their volume and direction) provides insights into the factors affecting locational choice. Volumes of inter-regional movements are, however, a function of, amongst other factors, the spatial distribution or settlement pattern of the population. A representation of the settlement pattern within NSW-ACT is provided in Table 4.1. As can be seen, the population is highly urbanised, with 60 per cent resident in the Sydney Statistical Division alone. Newcastle (in the Illawarra SD) , Wollongong (in Hunter SD) and Canberra (in the ACT) are the other major urban centres