School Census Results, 2012
SDR 108/2012 11 July 2012
This Statistical First Release is based upon information collected by the Schools’ Census in January 2012. It reports information for the number of pupils by age, gender, free school meal eligibility, ethnicity and SEN (special educational needs), together with information on the number of schools, teachers and support staff. The tables provide all Wales information for each category listed, plus a breakdown to local authority (LA) level for schools, pupils, teachers and support staff.
In previous years, provisional school census results were made available in July with final results available in September. However, due to a shortening of the validation period for local authorities, this release provides final results. Further information may be requested from [email protected]
Key results from the January 2012 school census
Schools and pupils (Tables 1-6)
• In January 2012 there were 22 nursery, 1,412 primary, 221 secondary schools and 43 special schools. Of these, 461 primary and 55 secondary schools were classified as Welsh medium. There were 66 independent schools. Overall, there were 25 fewer LA maintained schools than at January 2011. The number of independent schools remained the same.
• Thetotal number of pupils (headcount) in LA maintained nursery, primary, secondary and special schools was 465,943, a fall of 229 pupils (0.05 per cent) since January 2011.
Chart 1: Number of pupils in maintained schools
0 100,000 200,000 300,000 400,000 500,000
'00 '01 '02 '03 '04 '05 '06 '07 '08 '09 '10 '11 '12
N
um
be
r of
pupils
Primary schools Secondary schools All maintained schools
• Since 2000, the number of pupils in LA maintained schools has decreased year on year.
• Numbers of pupils in secondary schools increased from 2000 to 2004 and have decreased year on year since then.
• Numbers of pupils in primary schools decreased from 2000 to 2010 but have increased year on year since then.
1
Teachers and support staff (Tables 7-10)
• There were 24,600.7 full-time equivalent (FTE) qualified teachers in LA maintained schools, a fall of 253.6 (1.0 per cent) over the year.
• The pupil teacher ratio for all LA maintained schools was 18.4 compared with 18.2 in 2011.
• There were 22,294.5 support staff (FTE) in LA maintained schools, an increase of almost 1,000 staff in the last year and continuing the trend of recent years. The introduction of the Foundation Phase and the Teacher Workload Agreement are the two main drivers behind the increase in support staff.
Free school meals (Table 11)
Chart 2: Percentage of pupils known to be eligible for free school meals
• The percentage of pupils known to be eligible for free school meals in primary, secondary and special schools has fluctuated over the last decade, generally decreasing from 2000 to 2008 and then increasing year on year to 2011. There was a slight decrease from 2011 to 2012. 0
5 10 15 20 25 30 35 40 45 50
'00 '01 '02 '03 '04 '05 '06 '07 '08 '09 '10 '11 '12
%
of
e
ligible
pupils
Primary schools Secondary schools Special schools
• This increase may be related to that seen in the number of claimants of Jobseeker’s Allowance in Wales, which is one of the criteria for
eligibility for free meals.
• The percentage of pupils of compulsory school age in LA maintained schools known to be eligible for free school meals in 2012 was:
Primary schools 20.6 per cent – down from 21.1 per cent in 2011
Secondary schools 17.4 per cent – down from 17.7 per cent in 2011
Special schools 42.8 per cent – down from 44.9 per cent in 2011
Ethnicity (Table 12)
• In LA maintained schools 91.2 per cent of pupils (aged 5 and over) were classified as White British, 7.9 per cent were of minority ethnic origin and 0.9 per cent were unknown or not stated.
Pupils with Special Educational Needs (SEN) (Tables 13 - 14)
• In January 2012 13,426 pupils in schools in Wales had statements of SEN, 416 less pupils than in January 2011.
• In LA maintained sectors:
Primary schools: 1.5 per cent of pupils had statements of SEN and a further 20.1 per cent of pupils had special educational needs but no statement.
Secondary schools: 2.6 per cent of pupils had statements of SEN and a further 18.6 per cent of pupils had special educational needs but no statement
Special schools: 94.6 per cent of pupils had statements of SEN and 5.4 per cent of pupils had special educational needs but no statement.
3
Contents
Page Schools and Pupils
Table 1 Number of schools, by local authority, January 2012 4
Table 2 Welsh medium schools and pupils, by local authority, January 2012 5 Table 3 Number of pupils, by age group, in nursery, primary, secondary and special
schools 5
Table 4 Number of pupils, full-time and part-time, by age and sex, in nursery, primary,
secondary and special schools, January 2012 6
Table 5 Pupil numbers, by local authority, January 2012 7
Table 6 Full-time equivalent pupils, by local authority, January 2012 7
Teachers and support staff
Table 7 Number of qualified teachers, by local authority, January 2012 8 Table 8 Full-time equivalent qualified teachers, by local authority, January 2012 9 Table 9 Pupil teacher ratios within schools, by local authority, January 2012 10 Table 10 Full-time equivalent support staff, by local authority, January 2012 10
Free school meals
Table 11 School meal arrangements in nursery, primary, secondary and special schools 11
Ethnicity
Table 12 Number of pupils aged 5 or over, by ethnic background, January 2012 12
Pupils with Special Educational Needs (SEN)
Table 13 Pupils with special educational needs in independent schools, by major need,
January 2012 13
Table 14 Pupils with a statement of special educational needs in maintained schools, by
type of school and major need, January 2012 14
Table 15 Pupils with a special educational need but no statement, in maintained schools,
by type of school and major need, January 2012 14
Table 16 All pupils with special educational needs in maintained schools, by type of school
and major need, January 2012 15
Schools and Pupils
Here are the key points about schools and pupils:
• The local authority with the most schools was Rhondda Cynon Taf with 138, and the local authority with the fewest was Merthyr Tydfil with 31 schools. (Table 1)
• Gwynedd had the most Welsh medium primary schools with 101, and the local authority with the fewest was Blaenau Gwent with 1 school. Gwynedd had the most Welsh medium secondary schools with 14, and there were 4 local authorities with no Welsh medium secondary schools: Merthyr Tydfil, Blaenau Gwent, Monmouthshire and Newport. (Table 2)
• Of the pupils aged under 5 in maintained schools in Wales, the majority of them were attending school on a full time basis. (Table 4)
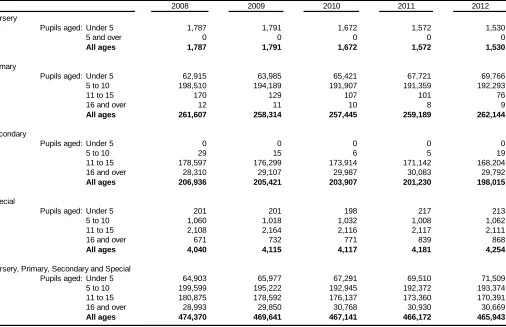
• Although the total number of pupils has declined over the last 5 years, the number aged under 5 has increased, reflecting the recent upturn in birth rates. (Table 3)
• Over the last decade, the total number of pupils in primary schools in Wales has decreased year-on-year, but there was an increase from January 2010 to January 2012, the first increase in the sector since 1998. (Table 4)
• The number of pupils in each local authority ranged between 9,316 in Merthyr Tydfil, to 50,954 in Cardiff. (Table 5)
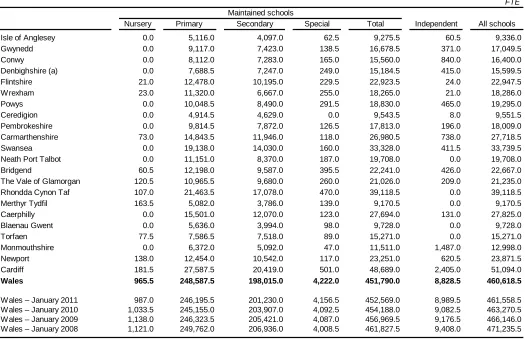
• The number of full-time equivalent pupils in schools was highest in Cardiff at 48,689.0 pupils and lowest in Merthyr Tydfil at 9,170.5 pupils. (Table 6)
Table 1: Number of schools, by local authority, January 2012
Nursery Primary Secondary Special Total Independent All schools
Isle of Anglesey 0 48 5 1 54 1 55
Gwynedd 0 102 14 3 119 3 122
Conwy 0 60 7 1 68 2 70
Denbighshire (a) 0 51 8 2 61 4 65
Flintshire 1 72 12 2 87 2 89
Wrexham 1 60 9 1 71 3 74
Powys 0 99 13 3 115 8 123
Ceredigion 0 57 7 0 64 1
Pembrokeshire 0 61 8 1 70 4 74
Carmarthenshire 1 108 14 2 125 7 132
Swansea 0 83 15 2 100 5 105
Neath Port Talbot 0 68 11 3 82 0 82
Bridgend 2 50 9 2 63 4 67
The Vale of Glamorgan 3 48 8 3 62 3 65
Rhondda Cynon Taf 3 112 19 4 138 0 138
Merthyr Tydfil 3 23 4 1 31 0 31
Caerphilly 0 75 14 1 90 1 91
Blaenau Gwent 0 27 5 1 33 0 33
Torfaen 2 29 7 1 39 0
Monmouthshire 0 32 4 1 37 7 44
Newport 3 49 8 1 61 1 62
Cardiff 3 98 20 7 128 10 138
Wales 22 1,412 221 43 1,698 66 1,764
Wales – January 2011 23 1,435 222 43 1,723 66 1,789
Wales – January 2010 25 1,462 223 43 1,753 64 1,817
Wales – January 2009 28 1,478 223 44 1,773 60 1,833
Wales – January 2008 28 1,509 222 44 1,803 66 1,869
(a) St Brigids School is counted in both the primary and secondary schools establishment numbers. Maintained schools
65
Table 2: Welsh medium schools and pupils, by local authority, January 2012
Table 3: Number of pupils, by age group, in nursery, primary, secondary and special schools (a) (b)
5
Schools Pupils Schools Pupils
Isle of Anglesey 47 5,227 4 3,304
Gwynedd 101 9,562 14 7,423
Conwy 25 2,254 2 1,440
Denbighshire 19 2,147 3 3,141
Flintshire 5 827 1 558
Wrexham 7 1,415 1 800
Powys 23 2,870 5 3,053
Ceredigion 51 3,962 6 3,315
Pembrokeshire 19 2,898 1 1,004
Carmarthenshire 77 9,378 6 5,539
Swansea 10 2,809 2 1,479
Neath Port Talbot 11 2,197 1 996
Bridgend 4 1,082 1 430
The Vale of Glamorgan 7 1,529 1 832
Rhondda Cynon Taf 16 4,771 4 3,258
Merthyr Tydfil 2 576 0 0
Caerphilly 11 2,608 1 1,397
Blaenau Gwent 1 310 0 0
Torfaen 3 737 1 965
Monmouthshire 2 290 0 0
Newport 3 546 0 0
Cardiff 17 4,451 2 2,328
Wales 461 62,446 56 41,262
Wales – January 2011 467 61,073
Wales – January 2010 476 60,318
Wales – January 2009 487 59,989
(a) Primary schools include Welsh Medium, Dual stream and Transitional schools. (b) Secondary schools include Welsh medium and Bilingual schools.
Further information on the definition of Welsh medium schools may be found via the link below:
http://wales.gov.uk/topics/educationandskills/publications/guidance/definingschools?lang=en
56 41,764
58 43,432
55 41,916
Welsh medium Primary schools (a) Welsh medium Secondary schools (b)
2008 2009 2010 2011 2012
Nursery
Pupils aged: Under 5 1,787 1,791 1,672 1,572 1,530
5 and over 0 0 0 0 0
All ages 1,787 1,791 1,672 1,572 1,530
Primary
Pupils aged: Under 5 62,915 63,985 65,421 67,721 69,766
5 to 10 198,510 194,189 191,907 191,359 192,293
11 to 15 170 129 107 101 76
16 and over 12 11 10 8 9
All ages 261,607 258,314 257,445 259,189 262,144
Secondary
Pupils aged: Under 5 0 0 0 0 0
5 to 10 29 15 6 5 19
11 to 15 178,597 176,299 173,914 171,142 168,204
16 and over 28,310 29,107 29,987 30,083 29,792
All ages 206,936 205,421 203,907 201,230 198,015
Special
Pupils aged: Under 5 201 201 198 217 213
5 to 10 1,060 1,018 1,032 1,008 1,062
11 to 15 2,108 2,164 2,116 2,117 2,111
16 and over 671 732 771 839 868
All ages 4,040 4,115 4,117 4,181 4,254
Nursery, Primary, Secondary and Special
Pupils aged: Under 5 64,903 65,977 67,291 69,510 71,509
5 to 10 199,599 195,222 192,945 192,372 193,374
11 to 15 180,875 178,592 176,137 173,360 170,391
16 and over 28,993 29,850 30,768 30,930 30,669
All ages 474,370 469,641 467,141 466,172 465,943
(a) At January each year.
Table 4: Number of pupils, full-time and part-time, by age and sex, in nursery, primary, secondary and special schools, January 2012 (a)
Total Total Total Total
Age as at 31 August 2011 Boys Girls Boys Girls Boys Girls Boys Girls Boys Girls Boys Girls Boys Girls
Pupils aged:
2 and under 32 36 139 138 345 406 430 2,433 2,255 5,524 0 0 0 0 0 3 5 8
3 (born 1/4/07 to 31/8/07) 76 67 197 164 504 1,256 1,208 5,004 4,762 12,230 0 0 0 5 2 13 12 32
3 (born 1/1/07 to 31/3/07) 44 36 116 102 298 992 965 2,832 2,845 7,634 0 0 0 8 6 7 1 22
3 (born 1/9/06 to 31/12/06) 47 50 135 138 370 1,819 1,699 3,532 3,397 10,447 0 0 0 11 8 14 7 40
4 (born 1/4/06 to 31/8/06) 6 7 0 0 13 7,326 7,128 18 13 14,485 0 0 0 34 13 0 1 48
4 (born 1/1/06 to 31/3/06) 0 0 0 0 0 4,158 3,887 3 3 8,051 0 0 0 16 5 0 1 22
4 (born 1/9/05 to 31/12/05) 0 0 0 0 0 5,809 5,574 3 9 11,395 0 0 0 31 10 0 0 41
Total Under 5 205 196 587 542 1,530 21,766 20,891 13,825 13,284 69,766 0 0 0 105 44 37 27 213
5 0 0 0 0 0 16,995 16,229 0 0 33,224 0 0 0 105 48 0 0 153
6 0 0 0 0 0 16,881 15,973 0 0 32,854 0 0 0 86 48 0 0 134
7 0 0 0 0 0 16,514 15,553 0 0 32,067 0 0 0 131 57 0 0 188
8 0 0 0 0 0 16,140 15,390 1 0 31,531 0 0 0 121 71 0 0 192
9 0 0 0 0 0 15,917 14,955 0 0 30,872 0 0 0 132 61 0 0 193
10 0 0 0 0 0 16,307 15,436 2 0 31,745 7 12 19 147 55 0 0 202
Total 5 to 10 0 0 0 0 0 98,754 93,536 3 0 192,293 7 12 19 722 340 0 0 1,062
11 0 0 0 0 0 48 20 0 0 68 16,303 15,592 31,895 268 92 0 0 360
12 0 0 0 0 0 1 3 0 0 4 16,888 16,210 33,098 282 108 0 0 390
13 0 0 0 0 0 0 0 1 0 1 17,375 16,684 34,059 319 109 0 0 428
14 0 0 0 0 0 0 0 0 0 0 18,064 17,314 35,378 369 129 0 0 498
15 0 0 0 0 0 1 2 0 0 3 17,208 16,566 33,774 311 124 0 0 435
Total 11 to 15 0 0 0 0 0 50 25 1 0 76 85,838 82,366 168,204 1,549 562 0 0 2,111
16 0 0 0 0 0 1 1 0 0 2 7,503 8,290 15,793 217 106 0 0 323
17 0 0 0 0 0 2 2 0 0 4 5,624 6,911 12,535 193 127 0 0 320
18 0 0 0 0 0 2 1 0 0 3 692 622 1,314 146 79 0 0 225
19+ 0 0 0 0 0 0 0 0 0 0 50 100 150 0 0 0 0 0
Total 16 to 19+ 0 0 0 0 0 5 4 0 0 9 13,869 15,923 29,792 556 312 0 0 868
Compulsory School Age 0 0 0 0 0 98,804 93,561 4 0 192,369 85,845 82,378 168,223 2,271 902 0 0 3,173
All ages 205 196 587 542 1,530 120,575 114,456 13,829 13,284 262,144 99,714 98,301 198,015 2,932 1,258 37 27 4,254
(a) Age as at 31 August 2011.
Nursery Schools Primary Schools Secondary Schools Special Schools
Part-time
Table 5: Pupil numbers, by local authority, January 2012 (a)
Nursery Primary Secondary Special Total Independent All schools
Isle of Anglesey 0 5,413 4,097 63 9,573 85 9,658
Gwynedd 0 9,681 7,423 139 17,243 371 17,614
Conwy 0 8,657 7,283 167 16,107 840 16,947
Denbighshire (a) 0 8,241 7,247 249 15,737 415 16,152
Flintshire 42 13,341 10,195 233 23,811 24 23,835
Wrexham 46 12,167 6,667 255 19,135 21 19,156
Powys 0 10,249 8,490 295 19,034 465 19,499
Ceredigion 0 5,026 4,629 0 9,655 8 9,663
Pembrokeshire 0 10,324 7,872 127 18,323 196 18,519
Carmarthenshire 73 15,014 11,946 118 27,151 738 27,889
Swansea 0 20,885 14,030 162 35,077 439 35,516
Neath Port Talbot 0 12,149 8,370 188 20,707 0 20,707
Bridgend 68 12,314 9,587 399 22,368 433 22,801
The Vale of Glamorgan 241 11,763 9,680 261 21,945 214 22,159
Rhondda Cynon Taf 107 21,478 17,078 470 39,133 0 39,133
Merthyr Tydfil 168 5,223 3,786 139 9,316 0 9,316
Caerphilly 0 16,639 12,070 128 28,837 131 28,968
Blaenau Gwent 0 6,056 3,994 98 10,148 0 10,148
Torfaen 146 8,052 7,518 89 15,805 0 15,805
Monmouthshire 0 6,612 5,092 47 11,751 1,510 13,261
Newport 276 13,198 10,542 117 24,133 626 24,759
Cardiff 363 29,662 20,419 510 50,954 2,413 53,367
Wales 1,530 262,144 198,015 4,254 465,943 8,929 474,872
Wales – January 2011 1,572 259,189 201,230 4,181 466,172 9,088 475,260
Wales – January 2010 1,672 257,445 203,907 4,117 467,141 9,222 476,363
Wales – January 2009 1,791 258,314 205,421 4,115 469,641 9,302 478,943
Wales – January 2008 1,787 261,607 206,936 4,040 474,370 9,555 483,925
(a) St Brigids School has pupils of both primary and secondary level who are included in the appropriate columns. Maintained schools
Table 6: Full-time equivalent pupils, by local authority, January 2012 (a)
FTE
Nursery Primary Secondary Special Total Independent All schools
Isle of Anglesey 0.0 5,116.0 4,097.0 62.5 9,275.5 60.5 9,336.0
Gwynedd 0.0 9,117.0 7,423.0 138.5 16,678.5 371.0 17,049.5
Conwy 0.0 8,112.0 7,283.0 165.0 15,560.0 840.0 16,400.0
Denbighshire (a) 0.0 7,688.5 7,247.0 249.0 15,184.5 415.0 15,599.5
Flintshire 21.0 12,478.0 10,195.0 229.5 22,923.5 24.0 22,947.5
Wrexham 23.0 11,320.0 6,667.0 255.0 18,265.0 21.0 18,286.0
Powys 0.0 10,048.5 8,490.0 291.5 18,830.0 465.0 19,295.0
Ceredigion 0.0 4,914.5 4,629.0 0.0 9,543.5 8.0 9,551.5
Pembrokeshire 0.0 9,814.5 7,872.0 126.5 17,813.0 196.0 18,009.0
Carmarthenshire 73.0 14,843.5 11,946.0 118.0 26,980.5 738.0 27,718.5
Swansea 0.0 19,138.0 14,030.0 160.0 33,328.0 411.5 33,739.5
Neath Port Talbot 0.0 11,151.0 8,370.0 187.0 19,708.0 0.0 19,708.0
Bridgend 60.5 12,198.0 9,587.0 395.5 22,241.0 426.0 22,667.0
The Vale of Glamorgan 120.5 10,965.5 9,680.0 260.0 21,026.0 209.0 21,235.0
Rhondda Cynon Taf 107.0 21,463.5 17,078.0 470.0 39,118.5 0.0 39,118.5
Merthyr Tydfil 163.5 5,082.0 3,786.0 139.0 9,170.5 0.0 9,170.5
Caerphilly 0.0 15,501.0 12,070.0 123.0 27,694.0 131.0 27,825.0
Blaenau Gwent 0.0 5,636.0 3,994.0 98.0 9,728.0 0.0 9,728.0
Torfaen 77.5 7,586.5 7,518.0 89.0 15,271.0 0.0 15,271.0
Monmouthshire 0.0 6,372.0 5,092.0 47.0 11,511.0 1,487.0 12,998.0
Newport 138.0 12,454.0 10,542.0 117.0 23,251.0 620.5 23,871.5
Cardiff 181.5 27,587.5 20,419.0 501.0 48,689.0 2,405.0 51,094.0
Wales 965.5 248,587.5 198,015.0 4,222.0 451,790.0 8,828.5 460,618.5
Wales – January 2011 987.0 246,195.5 201,230.0 4,156.5 452,569.0 8,989.5 461,558.5 Wales – January 2010 1,033.5 245,155.0 203,907.0 4,092.5 454,188.0 9,082.5 463,270.5 Wales – January 2009 1,138.0 246,323.5 205,421.0 4,087.0 456,969.5 9,176.5 466,146.0 Wales – January 2008 1,121.0 249,762.0 206,936.0 4,008.5 461,827.5 9,408.0 471,235.5
(a) St Brigids School has pupils of both primary and secondary level who are included in the appropriate columns. Maintained schools
Teachers and support staff
Here are the key points about teachers and support staff:
• The number of teachers in each local authority ranged between 3,005 in Cardiff, to 502 in Merthyr Tydfil. (Table 7)
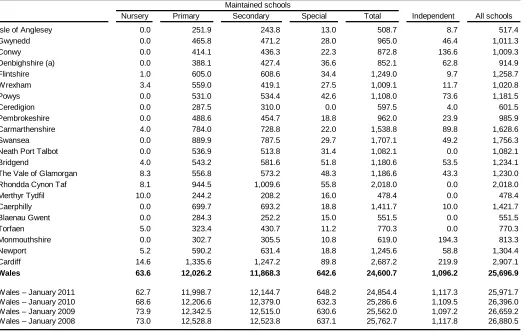
• The number of full-time equivalent qualified teachers in schools was highest in Cardiff at 2,687.2 teachers and lowest in Merthyr Tydfil at 478.4 teachers. (Table 8)
• Ceredigion had the lowest primary pupil teacher ratio at 17.1, and Torfaen had the highest at 23.5. The lowest secondary pupil teacher ratio was also in Ceredigion at 14.9, and the highest was in Merthyr Tydfil at 18.2. (Table 9)
• The pupil teacher ratio is highest in primary schools at 20.7 and lowest in special schools at 6.6. (Table 9) • The number of full-time equivalent support staff in schools was highest in Cardiff at 2,338.2 support
staff, and lowest in Merthyr Tydfil at 416.1 support staff. (Table 10)
• The introduction of the Foundation Phase and the Teacher Workload Agreement are the two main drivers behind the increase in support staff. (Table 10)
Table 7: Number of qualified teachers, by local authority, January 2012
Nursery Primary Secondary Special Total Independent All schools
Isle of Anglesey 0 283 260 14 557 10 567
Gwynedd 0 520 505 28 1,053 54 1,107
Conwy 0 472 464 23 959 151 1,110
Denbighshire (a) 0 441 466 39 946 63 1,009
Flintshire 2 681 655 37 1,375 10 1,385
Wrexham 4 636 452 28 1,120 13 1,133
Powys 0 637 571 47 1,255 94 1,349
Ceredigion 0 335 338 0 673 4 677
Pembrokeshire 0 566 486 21 1,073 28 1,101
Carmarthenshire 4 886 781 22 1,693 114 1,807
Swansea 0 998 838 33 1,869 66 1,935
Neath Port Talbot 0 599 539 36 1,174 0 1,174
Bridgend 5 583 616 55 1,259 65 1,324
The Vale of Glamorgan 10 620 599 54 1,283 55 1,338
Rhondda Cynon Taf 9 1,002 1,069 59 2,139 0 2,139
Merthyr Tydfil 10 262 214 16 502 0 502
Caerphilly 0 754 745 21 1,520 14 1,534
Blaenau Gwent 0 305 257 15 577 0 577
Torfaen 5 344 454 12 815 0 815
Monmouthshire 0 345 326 11 682 214 896
Newport 6 649 664 21 1,340 64 1,404
Cardiff 18 1,533 1,352 102 3,005 265 3,270
Wales 73 13,451 12,651 694 26,869 1,284 28,153
Wales – January 2011 72 13,399 12,935 702 27,108 1,309 28,417
Wales – January 2010 78 13,582 13,102 673 27,435 1,297 28,732
Wales – January 2009 82 13,726 13,219 675 27,702 1,267 28,969
Wales – January 2008 79 13,916 13,212 675 27,882 1,302 29,184
Table 8: Full-time equivalent qualified teachers, by local authority, January 2012
FTE
Nursery Primary Secondary Special Total Independent All schools
Isle of Anglesey 0.0 251.9 243.8 13.0 508.7 8.7 517.4
Gwynedd 0.0 465.8 471.2 28.0 965.0 46.4 1,011.3
Conwy 0.0 414.1 436.3 22.3 872.8 136.6 1,009.3
Denbighshire (a) 0.0 388.1 427.4 36.6 852.1 62.8 914.9
Flintshire 1.0 605.0 608.6 34.4 1,249.0 9.7 1,258.7
Wrexham 3.4 559.0 419.1 27.5 1,009.1 11.7 1,020.8
Powys 0.0 531.0 534.4 42.6 1,108.0 73.6 1,181.5
Ceredigion 0.0 287.5 310.0 0.0 597.5 4.0 601.5
Pembrokeshire 0.0 488.6 454.7 18.8 962.0 23.9 985.9
Carmarthenshire 4.0 784.0 728.8 22.0 1,538.8 89.8 1,628.6
Swansea 0.0 889.9 787.5 29.7 1,707.1 49.2 1,756.3
Neath Port Talbot 0.0 536.9 513.8 31.4 1,082.1 0.0 1,082.1
Bridgend 4.0 543.2 581.6 51.8 1,180.6 53.5 1,234.1
The Vale of Glamorgan 8.3 556.8 573.2 48.3 1,186.6 43.3 1,230.0
Rhondda Cynon Taf 8.1 944.5 1,009.6 55.8 2,018.0 0.0 2,018.0
Merthyr Tydfil 10.0 244.2 208.2 16.0 478.4 0.0 478.4
Caerphilly 0.0 699.7 693.2 18.8 1,411.7 10.0 1,421.7
Blaenau Gwent 0.0 284.3 252.2 15.0 551.5 0.0 551.5
Torfaen 5.0 323.4 430.7 11.2 770.3 0.0 770.3
Monmouthshire 0.0 302.7 305.5 10.8 619.0 194.3 813.3
Newport 5.2 590.2 631.4 18.8 1,245.6 58.8 1,304.4
Cardiff 14.6 1,335.6 1,247.2 89.8 2,687.2 219.9 2,907.1
Wales 63.6 12,026.2 11,868.3 642.6 24,600.7 1,096.2 25,696.9
Wales – January 2011 62.7 11,998.7 12,144.7 648.2 24,854.4 1,117.3 25,971.7
Wales – January 2010 68.6 12,206.6 12,379.0 632.3 25,286.6 1,109.5 26,396.0
Wales – January 2009 73.9 12,342.5 12,515.0 630.6 25,562.0 1,097.2 26,659.2
Wales – January 2008 73.0 12,528.8 12,523.8 637.1 25,762.7 1,117.8 26,880.5
(a) St Brigids School has teachers of both primary and secondary level who are included in the appropriate columns. Maintained schools
Table 9: Pupil teacher ratios within schools, by local authority, January 2012
Nursery Primary Secondary Special Total Independent All schools
Isle of Anglesey . 20.3 16.8 4.8 18.2 6.9 18.0
Gwynedd . 19.6 15.8 4.9 17.3 8.0 16.9
Conwy . 19.6 16.7 7.4 17.8 6.2 16.2
Denbighshire (a) . 19.8 17.0 6.8 17.8 6.6 17.1
Flintshire 21.3 20.6 16.8 6.7 18.4 2.5 18.2
Wrexham 6.8 20.2 15.9 9.3 18.1 1.8 17.9
Powys . 18.9 15.9 6.9 17.0 6.3 16.3
Ceredigion . 17.1 14.9 . 16.0 2.0 15.9
Pembrokeshire . 20.1 17.3 6.7 18.5 8.2 18.3
Carmarthenshire 18.3 18.9 16.4 5.4 17.5 8.2 17.0
Swansea . 21.5 17.8 5.4 19.5 8.4 19.2
Neath Port Talbot . 20.8 16.3 6.0 18.2 . 18.2
Bridgend 15.1 22.5 16.5 7.6 18.8 8.0 18.4
The Vale of Glamorgan 14.5 19.7 16.9 5.4 17.7 4.8 17.3
Rhondda Cynon Taf 13.2 22.7 16.9 8.4 19.4 . 19.4
Merthyr Tydfil 16.4 20.8 18.2 8.7 19.2 . 19.2
Caerphilly . 22.2 17.4 6.5 19.6 13.1 19.6
Blaenau Gwent . 19.8 15.8 6.5 17.6 . 17.6
Torfaen 15.5 23.5 17.5 7.9 19.8 . 19.8
Monmouthshire . 21.1 16.7 4.4 18.6 7.7 16.0
Newport 26.4 21.1 16.7 6.2 18.7 10.6 18.3
Cardiff 12.4 20.7 16.4 5.6 18.1 10.9 17.6
Wales 15.2 20.7 16.7 6.6 18.4 8.1 17.9
Wales – January 2011 15.7 20.5 16.6 6.4 18.2 8.0 17.8
Wales – January 2010 15.1 20.1 16.5 6.5 18.0 8.2 17.6
Wales – January 2009 15.4 20.0 16.4 6.5 17.9 8.4 17.5
Wales – January 2008 15.4 19.9 16.5 6.3 17.9 8.4 17.5
(a) St Brigids School has pupils and teachers of both primary and secondary level who are included in the appropriate columns. Maintained schools
Table 10: Full-time equivalent support staff, by local authority, January 2012
FTE
Nursery Primary Secondary Special Total
Isle of Anglesey 0.0 283.3 199.2 19.8 502.4
Gwynedd 0.0 439.3 219.5 49.8 708.6
Conwy 0.0 344.9 209.4 69.8 624.0
Denbighshire (a) 0.0 462.6 261.1 83.9 807.5
Flintshire 2.3 708.8 287.9 84.7 1,083.7
Wrexham 6.3 713.5 249.3 105.2 1,074.3
Powys 0.0 527.6 273.1 116.8 917.6
Ceredigion 0.0 335.6 266.6 0.0 602.2
Pembrokeshire 0.0 727.4 345.4 78.2 1,151.0
Carmarthenshire 7.1 894.8 563.2 57.0 1,522.1
Swansea 0.0 1,082.7 546.5 89.2 1,718.4
Neath Port Talbot 0.0 580.8 219.6 77.1 877.4
Bridgend 6.8 686.9 240.0 167.5 1,101.2
The Vale of Glamorgan 15.1 529.5 288.6 150.2 983.4
Rhondda Cynon Taf 13.4 1,080.2 500.4 133.6 1,727.5
Merthyr Tydfil 13.9 272.5 81.0 48.6 416.1
Caerphilly 0.0 776.2 342.6 83.3 1,202.1
Blaenau Gwent 0.0 314.5 123.1 52.5 490.1
Torfaen 8.9 412.2 224.6 39.5 685.1
Monmouthshire 0.0 405.4 179.7 26.8 611.9
Newport 23.5 676.0 391.5 58.6 1,149.6
Cardiff 26.2 1,449.2 701.7 161.2 2,338.2
Wales 123.4 13,703.7 6,714.0 1,753.4 22,294.5
Wales – January 2011 125.1 12,850.2 6,653.2 1,692.0 21,320.5
Wales – January 2010 119.6 12,263.7 6,525.8 1,500.6 20,409.7
Wales – January 2009 120.6 11,198.5 6,234.4 1,540.2 19,093.8
Wales – January 2008 103.4 9,466.1 5,893.5 1,482.6 16,945.6
Free school meals (FSM)
Here are the key points about free school meals:
• The number of pupils eligible for free meals has decreased from 84,806 pupils in January 2011 to 82,543 pupils in January 2012.
• Since 2008, the percentage of compulsory aged school pupils known to be eligible for free meals has increased year on year. This increase may be related to that seen in the number of claimants of
Jobseeker’s Allowance in Wales, which is one of the criteria for eligibility for free meals (more information can be seen in the Key Quality Information at the back of this release).
[image:11.595.33.554.342.559.2]• The percentage of pupils known to be eligible for free meals was highest in special schools at 41.0 per cent. (Table 11)
Table 11: School meal arrangements in nursery and primary schools, secondary and special schools (a)
Number Percentage Number Percentage Number Percentage Number Percentage of pupils of pupils of pupils of pupils of pupils of pupils of pupils of pupils known to be known to be known to be known to be known to be known to be known to be known to be
eligible for eligible for eligible for eligible for eligible for eligible for eligible for eligible for free meals free meals free meals free meals free meals free meals free meals free meals
All pupils:
2008 155 8.7 42,281 16.2 29,408 14.2 1,588 39.3
2009 170 9.5 44,083 17.1 30,426 14.8 1,543 37.5
2010 159 9.5 47,212 18.3 31,737 15.6 1,641 39.9
2011 143 9.1 50,560 19.5 32,314 16.1 1,789 42.8
2012 133 8.7 49,391 18.8 31,276 15.8 1,743 41.0
Pupils aged 5-15:
2008 . . 35,481 17.9 27,820 15.6 1,303 41.1
2009 . . 36,525 18.8 28,713 16.3 1,257 39.5
2010 . . 38,665 20.1 29,805 17.1 1,321 42.0
2011 . . 40,422 21.1 30,247 17.7 1,404 44.9
2012 . . 39,656 20.6 29,252 17.4 1,357 42.8
(a) At January each year.
Nursery schools Primary Schools Secondary Schools Special Schools
Ethnicity
Here are the key points about ethnicity:
• Of the total number of pupils aged 5 or over at primary, secondary and special schools in Wales, over 9 in 10 pupils were classed as White British.
• The percentage of pupils whose ethnic background was classified as minority ethnic origin was slightly higher in primary schools than in secondary or special schools.
• Of the pupils whose ethnic background was classified as Black, 80.1 per cent of them were classified as Black African.
• Of the pupils whose ethnic background was classified as Asian, 20.5 per cent of them were classified as Indian, 33.0 per cent as Pakistani, and 35.3 per cent as Bangladeshi. (Table 12)
Table 12: Number of pupils aged 5 or over, by ethnic background, January 2012
Ethnic background Number Per cent (a) Number Per cent (a) Number Per cent (a) Number Per cent (a)
White 177,967 92.5 185,473 93.7 3,736 92.5 367,176 93.1
White British 173,787 90.3 182,154 92.0 3,688 91.3 359,629 91.2
Traveller of Irish Heritage 230 0.1 86 0.0 7 0.2 323 0.1
Gypsy/ Roma 331 0.2 160 0.1 5 0.1 496 0.1
Any other White Background 3,619 1.9 3,073 1.6 36 0.9 6,728 1.7
Mixed 4,541 2.4 3,793 1.9 86 2.1 8,420 2.1
White and Black Caribbean 1,040 0.5 988 0.5 18 0.4 2,046 0.5
White and Black African 562 0.3 410 0.2 7 0.2 979 0.2
White and Asian 1,080 0.6 862 0.4 16 0.4 1,958 0.5
Any other mixed background 1,859 1.0 1,533 0.8 45 1.1 3,437 0.9
Asian 4,420 2.3 3,472 1.8 79 2.0 7,971 2.0
Indian 988 0.5 638 0.3 8 0.2 1,634 0.4
Pakistani 1,436 0.7 1,158 0.6 36 0.9 2,630 0.7
Bangladeshi 1,524 0.8 1,263 0.6 29 0.7 2,816 0.7
Any other Asian background 472 0.2 413 0.2 6 0.1 891 0.2
Black 1,465 0.8 1,272 0.6 41 1.0 2,778 0.7
Black Caribbean 97 0.1 111 0.1 0 0.0 208 0.1
Black African 1,188 0.6 1,000 0.5 37 0.9 2,225 0.6
Any other Black background 180 0.1 161 0.1 4 0.1 345 0.1
Chinese 296 0.2 357 0.2 6 0.1 659 0.2
Any other ethnic group 2,133 1.1 1,703 0.9 27 0.7 3,863 1.0
Total with valid category 190,822 99.2 196,070 99.0 3,975 98.4 390,867 99.1
Unknown or not stated 1,556 0.8 1,945 1.0 66 1.6 3,567 0.9
All pupils 192,378 100.0 198,015 100.0 4,041 100.0 394,434 100.0
(a) Of all pupils aged 5 or over.
• 21.1 per cent of pupils at secondary schools have some form of special educational need; 12.2 per cent of these pupils with SEN have statements of SEN. Of the pupils with special educational needs, the most common major need was moderate learning difficulties, representing just over a third of all pupils with some form of SEN. (Table 14)
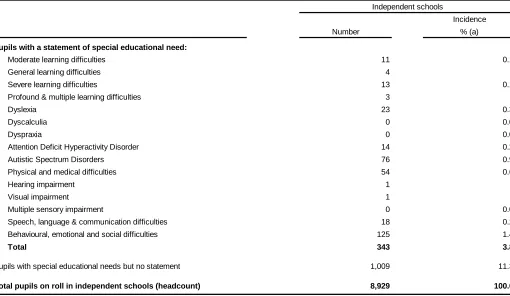
Table 13: Pupils with special educational needs in independent schools, by major need, January 2012
• 21.7 per cent of pupils at primary schools have some form of special educational need; 7.0 per cent of these pupils with SEN have statements of SEN. Of the pupilswith special educational needs, the most common major need was moderate learning difficulties, representing 34.0 per cent of pupils with some form of SEN. (Table 14)
• 22.1 per cent of all pupils at primary, secondary and special schools in Wales have some form of special educational need; 12.7 per cent of the pupils with special educational needs have statements of SEN. (Table 14)
13
Special educational needs (SEN)
Here are the key points about special educational needs:
• 15.1 per cent of pupils at independent schools have some form of special educational need; a third of these pupils with SEN have statements of SEN. Of the pupils with statements of special educational needs, 36.4 per cent had behavioural, emotional and social difficulties as their major need, 22.2 per cent of pupils had autistic spectrum disorders and 15.7 per cent of pupils had physical and medical
difficulties as their major need. (Table 13)
• All pupils at special schools have some form of special educational need; 94.6 per cent of these pupils with SEN have statements of SEN. Of the pupilswith special educational needs, the most common major need was severe learning difficulties, representing almost a third of all pupils with some form of SEN. (Table 14)
Incidence % (a) 0.1 4 -0.1 -0.3 0 0.0 0 0.0 0.2 0.9 0.6 1 -1 -0 0.0 0.2 1.4 3.8 11.3 100.0 nt schools. ndent schools Number
Pupils with a statement of special educational need:
Moderate learning difficulties 11
General learning difficulties
Severe learning difficulties 13
Profound & multiple learning difficulties 3
Dyslexia 23
Dyscalculia Dyspraxia
Attention Deficit Hyperactivity Disorder 14
Autistic Spectrum Disorders 76
Physical and medical difficulties 54
Hearing impairment Visual impairment
Multiple sensory impairment
Speech, language & communication difficulties 18
Behavioural, emotional and social difficulties 125
Total 343
Pupils with special educational needs but no statement 1,009
Total pupils on roll in independent schools (headcount) 8,929
Table 14: Pupils with a statement of special educational needs in maintained schools, by type of school and major need, January 2012
Incidence Placement Incidence Placement Incidence Placement Incidence Placement
Major need Number % (a) % (b) Number % (a) % (b) Number % (a) % (b) Number % (a) % (b)
Moderate learning difficulties 572 0.2 4.4 1,031 0.5 7.9 495 11.6 3.8 2,098 0.5 16.0
General learning difficulties 62 - 0.5 99 - 0.8 1 - - 162 - 1.2
Severe learning difficulties 279 0.1 2.1 268 0.1 2.0 1,284 30.2 9.8 1,831 0.4 14.0
Profound & multiple learning difficulties 124 - 0.9 55 - 0.4 441 10.4 3.4 620 0.1 4.7
Dyslexia 54 - 0.4 437 0.2 3.3 3 0.1 - 494 0.1 3.8
Dyscalculia 0 0.0 0.0 6 - - 0 0.0 0.0 6 -
-Dyspraxia 5 - - 30 - 0.2 3 0.1 - 38 - 0.3
Attention Deficit Hyperactivity Disorder 50 - 0.4 51 - 0.4 12 0.3 0.1 113 - 0.9
Autistic Spectrum Disorders 748 0.3 5.7 870 0.4 6.6 907 21.3 6.9 2,525 0.5 19.3
Physical and medical difficulties 542 0.2 4.1 443 0.2 3.4 190 4.5 1.5 1,175 0.3 9.0
Hearing impairment 173 0.1 1.3 156 0.1 1.2 14 0.3 0.1 343 0.1 2.6
Visual impairment 90 - 0.7 101 0.1 0.8 11 0.3 0.1 202 - 1.5
Multiple sensory impairment 10 - 0.1 8 - 0.1 11 0.3 0.1 29 - 0.2
Speech, language & communication difficulties 912 0.3 7.0 843 0.4 6.4 178 4.2 1.4 1,933 0.4 14.8
Behavioural, emotional and social difficulties 355 0.1 2.7 686 0.3 5.2 473 11.1 3.6 1,514 0.3 11.6
Total 3,976 1.5 30.4 5,084 2.6 38.9 4,023 94.6 30.7 13,083 2.8 100.0
(a) Incidence of pupils - the number of pupils expressed as a proportion of the total number of pupils on roll within EACH school type.
(b) Placement of pupils - the number of pupils expressed as a proportion of the total number of pupils within each SEN grouping in Primary, Secondary and Special schools combined. e.g. Number of pupils with a statement of SEN of moderate learning difficulties divided by the total number of pupils with a statement of SEN in Primary+Secondary+Special schools.
Table 15: Pupils with a special educational need but no statement, in maintained schools, by type of school and major need, January 2012
Incidence Placement Incidence Placement Incidence Placement Incidence Placement
Major need Number % (a) % (b) Number % (a) % (b) Number % (a) % (b) Number % (a) % (b)
Moderate learning difficulties 18,780 7.2 20.9 13,184 6.7 14.7 32 0.8 - 31,996 6.9 35.6
General learning difficulties 11,013 4.2 12.3 5,687 2.9 6.3 3 0.1 - 16,703 3.6 18.6
Severe learning difficulties 429 0.2 0.5 136 0.1 0.2 59 1.4 0.1 624 0.1 0.7
Profound & multiple learning difficulties 77 - 0.1 10 - - 22 0.5 - 109 - 0.1
Dyslexia 2,851 1.1 3.2 5,959 3.0 6.6 0 0.0 0.0 8,810 1.9 9.8
Dyscalculia 135 0.1 0.2 279 0.1 0.3 0 0.0 0.0 414 0.1 0.5
Dyspraxia 182 0.1 0.2 277 0.1 0.3 0 0.0 0.0 459 0.1 0.5
Attention Deficit Hyperactivity Disorder 359 0.1 0.4 329 0.2 0.4 0 0.0 0.0 688 0.1 0.8
Autistic Spectrum Disorders 720 0.3 0.8 664 0.3 0.7 48 1.1 0.1 1,432 0.3 1.6
Physical and medical difficulties 1,711 0.7 1.9 1,346 0.7 1.5 5 0.1 - 3,062 0.7 3.4
Hearing impairment 918 0.4 1.0 665 0.3 0.7 0 0.0 0.0 1,583 0.3 1.8
Visual impairment 349 0.1 0.4 267 0.1 0.3 0 0.0 0.0 616 0.1 0.7
Multiple sensory impairment 9 - - 24 - - 2 - - 35 -
-Speech, language & communication difficulties 9,514 3.6 10.6 1,679 0.8 1.9 8 0.2 - 11,201 2.4 12.5
Behavioural, emotional and social difficulties 5,735 2.2 6.4 6,240 3.2 7.0 52 1.2 0.1 12,027 2.6 13.4
Total 52,782 20.1 58.8 36,746 18.6 40.9 231 5.4 0.3 89,759 19.3 100.0
(a) Incidence of pupils - the number of pupils expressed as a proportion of the total number of pupils on roll within EACH school type.
(b) Placement of pupils - the number of pupils expressed as a proportion of the total number of pupils within each SEN grouping in Primary, Secondary and Special schools combined. e.g. Number of pupils with a statement of SEN of moderate learning difficulties divided by the total number of pupils with a statement of SEN in Primary+Secondary+Special schools.
Primary Secondary Special Total
Incidence Placement Incidence Placement Incidence Placement Incidence Placement
Major need Number % (a) % (b) Number % (a) % (b) Number % (a) % (b) Number % (a) % (b)
Moderate learning difficulties 19,352 7.4 18.8 14,215 7.2 13.8 527 12.4 0.5 34,094 7.3 33.2
General learning difficulties 11,075 4.2 10.8 5,786 2.9 5.6 4 0.1 - 16,865 3.6 16.4
Severe learning difficulties 708 0.3 0.7 404 0.2 0.4 1,343 31.6 1.3 2,455 0.5 2.4
Profound & multiple learning difficulties 201 0.1 0.2 65 - 0.1 463 10.9 0.5 729 0.2 0.7
Dyslexia 2,905 1.1 2.8 6,396 3.2 6.2 3 0.1 - 9,304 2.0 9.0
Dyscalculia 135 0.1 0.1 285 0.1 0.3 0 0.0 0.0 420 0.1 0.4
Dyspraxia 187 0.1 0.2 307 0.2 0.3 3 0.1 - 497 0.1 0.5
Attention Deficit Hyperactivity Disorder 409 0.2 0.4 380 0.2 0.4 12 0.3 - 801 0.2 0.8
Autistic Spectrum Disorders 1,468 0.6 1.4 1,534 0.8 1.5 955 22.4 0.9 3,957 0.8 3.8
Physical and medical difficulties 2,253 0.9 2.2 1,789 0.9 1.7 195 4.6 0.2 4,237 0.9 4.1
Hearing impairment 1,091 0.4 1.1 821 0.4 0.8 14 0.3 - 1,926 0.4 1.9
Visual impairment 439 0.2 0.4 368 0.2 0.4 11 0.3 - 818 0.2 0.8
Multiple sensory impairment 19 - - 32 - - 13 0.3 - 64 - 0.1
Speech, language & communication difficulties 10,426 4.0 10.1 2,522 1.3 2.5 186 4.4 0.2 13,134 2.8 12.8
Behavioural, emotional and social difficulties 6,090 2.3 5.9 6,926 3.5 6.7 525 12.3 0.5 13,541 2.9 13.2
Total 56,758 21.7 55.2 41,830 21.1 40.7 4,254 100.0 4.1 102,842 22.1 100.0
Total number of pupils on roll 262,144 198,015 4,254 465,943
(a) Incidence of pupils - the number of pupils expressed as a proportion of the total number of pupils on roll within EACH school type.
(b) Placement of pupils - the number of pupils expressed as a proportion of the total number of pupils within each SEN grouping in Primary, Secondary and Special schools combined. e.g. Number of pupils with a statement of SEN of moderate learning difficulties divided by the total number of pupils with a statement of SEN in Primary+Secondary+Special schools.
[image:16.595.39.798.53.290.2]Primary Secondary Special Total
17
Key Quality Information
Coverage
The data in this release relates to all maintained and independent schools in Wales. Figures for local authorities do not include independent schools.
Status
Schools’ data are derived from the Pupil Level Annual School Census (PLASC) returns and STATS 1 returns supplied by schools open on Census day in January each year. The returns are authorised by headteachers and validated by Local Authorities.
Timeliness
The data in this release relate to the position on Tuesday 17 January 2012.
Source of data
Pupil Level Annual School Census (PLASC) / School Census (STATS1 Return)
PLASC is an electronic collection of pupil and school level data provided by all maintained sector primary, secondary, nursery and special schools in January each year. Schools record data on pupils and the school throughout the year in their Management Information System (MIS) software. This data is collated into an electronic PLASC return and submitted to the Welsh Government through DEWi, a secure online data transfer system developed by the Welsh Government. Various stages of automated validation and sense-checking are built into the process to ensure a high quality of data to inform policy making and funding. From January 1994 independent schools in Wales complete a STATS1 return which replaced Form 101A (school census return for independent schools prior to January 1994).
Definitions
Full-time equivalent (FTE):
• FTE pupil numbers count part-time pupils as 0.5.
• FTE of part-time teachers expresses the teachers’ service in hours as a proportion of a school week: 32.5 hours for maintained schools and 26 hours for independent schools.
Pupil Teacher Ratio (PTR): calculated by dividing the FTE number of pupils by the FTE number of qualified teachers (headteachers, deputy heads and other qualified teachers).
Free School Meals:Pupils are eligible for free school meals if their families receive Income Support or Income Based Jobseeker’s Allowance or Support under Part VI of the Immigration and Asylum Act 1999 or the guarantee element of State Pension Credit. They are also eligible if their parents are in receipt of Income Related Employment and Support Allowance (IR). Employment and Support Allowance is an integrated contributory and income related allowance and replaced, for new claimants, Incapacity and Income
Support, where it is paid on the grounds of incapacity and sickness. Children who receive Income Support or Income Based Jobseeker’s Allowance in their own right are also eligible to receive free school meals. Children whose families are in receipt of Child Tax Credit, providing they are not entitled to Working Tax Credit, and have an annual income, as assessed by HM Revenue & Customs that does not exceed £16,190 are also eligible for free school meals.
Special educational needs: for further information please see these guidance notes.
Ethnic background: please see these guidance notes for further information on categories and data collection methods.
Symbols: The following symbols have been used throughout the publication: .. not available
. not applicable
- the data item is not exactly zero but less than 0.05
Comparability: Other countries’ releases
Attached is the latest available release for England, published on 22 June 2012: Schools, Pupils and their Characteristics, January 2012
Scotland publishes some data on pupils as part of a larger publication on schools. Their latest release was published on 1 December 2010 (revised on 13 June 2012):
Summary Statistics for Schools in Scotland, No.1 2010 Edition
Scotland also publishes some data on school meals as part of a different publication. Their latest release was published on 27 June 2012:
Summary statistics for attainment, leaver destinations and school meals, No. 1: 2012 Edition
The latest available release for Northern Ireland, published on 23 February 2012, can be found here: Enrolments at schools and in funded pre-school education in Northern Ireland 2011/12
Related data for Wales
This release shows final data at Wales level for 2008 - 2012.
The previous final data released were for 2011, in the form of a Statistical First Release: Schools Census, 2011: Final Results, published on 6 September 2011.
The Welsh Government also releases teacher data from a different source (the STATS 3 return) in the form of a Statistical First Release:
Teachers in service, vacancies and sickness absence: January 2012, published on 16 June 2012.
Since the above release is from a different source, figures may not match, and therefore caution should be taken when making comparisons.
Who are the key users of this data?
These statistics are used both within and outside the Welsh Government. Some of the key users are:
• Ministers and the Members Research Service in the National Assembly for Wales;
• The Department for Education and Skills in the Welsh Government;
• Other areas of the Welsh Government;
• The research community;
• Students, academics and universities;
• Individual citizens and private companies.
What are the data used for?
These statistics are used in a variety of ways. Some examples of these are:
• resource allocation in the Welsh Local Government Finance Settlement and the Better Schools Fund;
• advice to Ministers;
• the all-Wales education core data packs (the replacement for the National Pupil Database);
• local authority and school comparisons and benchmarks;
• to inform the education policy decision-making process in Wales including school reorganisation;
• to inform ESTYN during school inspections;
• the education domain of the Welsh Index of Multiple Deprivation;
• as a basis for School Banding;
• to assist in research in educational attainment.