DNA-based Methods for Studying the Diet of
Marine Predators
Bruce E. Deagle
BSc, University of Western Ontario MSc, University of Victoria
Submitted in fulfilment of the requirements for the degree of Doctor of Philosophy.
Declaration of originality
I hereby declare that this thesis contains no material which has been accepted for the award of any other degree or diploma in any tertiary institute, and that, to the best of my knowledge and belief, the thesis contains no material previously published or written by another person, except where due reference is made in the text of the thesis.
Bruce E. Deagle March 30th, 2006
Statement of authority of access
This thesis may be made available for loan and limited copying in accordance with the Copyright Act 1968.
Thesis Abstract
Diets of large marine predators have been extensively studied to assess interactions with fisheries, monitor links between diet and reproductive success, and understand trophic interactions in marine ecosystems. Since marine species can rarely be observed foraging directly, most studies rely on the identification of prey remains in stomach contents or faeces to determine the prey items being consumed. While this approach has provided a wealth of information, it has several limitations resulting primarily from difficulties identifying digested prey and from biased recovery of remains due to differential digestion. My thesis explores the use of molecular genetic methods in dietary studies of large marine predators. DNA-based identification techniques have been used in several diet studies, but the methods and applications are still in the early stages of development. Through a number of studies, I
investigated the ability to recover genetic data from various dietary samples using a range of genetic techniques.
A) Genetic screening for prey in the gut contents from a giant squid – I assessed the use of polymerase chain reaction (PCR)-based methods for isolation of prey DNA from an Architeuthis gut content sample. A taxonomically informative molecular marker was selected and a screening method developed using denaturing gradient gel electrophoresis. The methodology was used to identify prey from otherwise
unidentifiable hard-part remains and the amorphous slurry component of the squid gut sample. The techniques developed here provided a framework for later chapters. B) Analysis of prey DNA in faeces of captive sea lions
Part I: DNA detection, distribution and signal persistence – A feeding trial with captive Steller sea lions (Eumetopias jubatus) was carried out to investigate the use of genetic faecal analysis as a tool to study diet. I used group-specific PCR detection to determine: (i) the reliability of prey DNA recovery, (ii) the distribution of prey DNA within faeces and (iii) the persistence of the genetic signal after a prey item was removed from the diet. The proportions of prey DNA in several samples were also determined using a clone library approach to determine if DNA quantification could provide semi-quantitative diet composition data. Results show that the prey DNA could be reliably detected in sea lion faeces and the genetic signal could persist in samples up to 48 hours after ingestion. Proportions of prey DNA isolated from faeces were roughly proportional to the mass of the prey items consumed.
Part II: DNA quantification – Quantitative real-time PCR was used to further investigate if quantitative diet composition data could be obtained through
C) Quantification of damage in DNA recovered from faecal samples – I developed a general method to quantify the frequency of DNA damage present in specific gene regions. The technique was applied to assess the amount of DNA damage in predator and prey DNA recovered from sea lion faeces. The estimated frequency of DNA damage was always higher for the prey DNA than for the predator DNA within a faecal sample. The findings have implications for marker development and comparison of results obtained in future DNA-based diet studies.
D) Studying seabird diet through genetic analysis of faeces – I investigated the diet of macaroni penguins (Eudyptes chrysolophus) through conventional analysis of
stomach contents and through the analysis of prey DNA extracted from faeces. Genetic data was obtained from faecal samples using PCR tests to determine the presence or absence of DNA from potential diet items and also using a clone library approach. Approximately half of the faecal samples tested positive for one or more of the prey groups targeted with PCR tests. Euphausiid DNA was most commonly detected in early stages of chick rearing and DNA from a myctophid fish was prevalent in faeces collected later; this trend mirrored the data obtained from the stomach contents. Analysis of prey sequences in “universal” clone libraries revealed a highly biased recovery of sequences from fish prey; this bias is most likely caused by the use of degenerate primers with a higher binding affinity for fish DNA template compared to DNA from other prey groups. Results obtained from the genetic and traditional approaches are compared, and potential future applications of the genetic techniques to studying seabird diet are discussed.
This series of studies has contributed significantly to our understanding of the strengths and the limitations of DNA-based diet analysis. The work identifies
Acknowledgements
The work in this thesis stemmed from research initiated by two of my supervisors, Nick Gales and Simon Jarman from the Australian Antarctic Division (AAD). Their
enthusiasm, valuable advice and unfettered support made my project possible. Mark Hindell, my university supervisor, welcomed me into his group and provided a home for me at the Antarctic Wildlife Research Unit (AWRU). An excellent cohort of Research Fellows, PhD students and Honours students were at the AWRU during my tenure, making this a good place to be – thanks to you all.
The Steller sea lion feeding trial carried out at the Vancouver Aquarium could not have been done without the support from Andrew Trites and Dominic Tollit. Andrew agreed to the make room for my project in the busy research schedule at the aquarium. Dom generously lent his time, experience and enthusiasm in order to make sure the feeding trial happened, and that I got all the samples that I required. My time at the aquarium was also made enjoyable and productive due to help from members of the UBC Marine Mammal Research Unit (particularly Susan Heaslip, Rebecca Barrick, Chad Nordstrom and David Rosen) and the marine mammal trainers (Troy Neale, Nigel Waller and Billy Lasby). A special thanks to the sea lions (Hazy and Nuka) for their vital contributions.
The macaroni penguin diet study was part of a large research expedition to Heard Island undertaken by the AAD in the summer of 2003–04. Karen Evans and Rowan Trebilco carried out the field work with me at Capsize Beach. Karen’s meticulous planning and stomach flushing expertise were very much appreciated, as were Rowan’s bad jokes and enthusiasm. Thanks to all the expeditioners for their time and friendship during the trip, and of course thanks to the penguins for putting up with us. Back in Hobart, Sarah Robinson helped with the tedious sorting of the macaroni penguin stomach samples and identified the otoliths that we recovered. John Kitchener helped me with identification of amphipods and euphausiids.
Most of the laboratory work was carried out in the Molecular Genetics Laboratory at the University of Tasmania – Adam Smolenski deserves credit for keeping everything running smoothly in this busy facility. The laboratory costs of the project were covered by the AAD, without this funding the project simply would not have happened. Abe Passmore was a good mate to share so many hours in the lab with. Conversations with Abe over coffee provided many welcome breaks and valuable insight into the project.
The writing of this thesis has benefited from input from a large number of people. Regular discussions with Simon Jarman and his “goblin army” provided me with a constant source of ideas (special thanks to Abe, Ruth, Glenn, Kevin and Megan). All of my supervisors and various co-authors helped by editing and commenting on each of the chapters. Abe Passmore and Glenn Dunshea also provided useful comments on some of the chapters. Anonymous reviewers made useful contributions to the published work (Chapters 2, 3 and 4) and comments from my thesis reviewers (Bill Symondson and Scott Baker) were also very constructive.
Table of Contents
THESIS ABSTRACT ...V
ACKNOWLEDGEMENTS...VII
LIST OF FIGURES...XI
LIST OF TABLES ... XIII
CHAPTER 1...1
1.1 INTRODUCTION... 3
1.2 CONVENTIONAL DIETARY ANALYSIS METHODS... 4
1.2.1 Stomach content analysis ... 4
1.2.2 Faecal analysis ... 5
1.2.3 Tissue biomarker methods... 7
1.3 APPLICATION OF DNA-BASED TECHNIQUES TO DIET ANALYSIS... 8
1.3.1 DNA-based stomach content analysis ... 10
1.3.2 DNA-based faecal analysis ... 14
1.4 RELEVANT RESEARCH IN ALLIED FIELDS... 16
1.5 THESIS OUTLINE... 18
1.6 DETAILS OF PUBLICATIONS RESULTING FROM THESIS... 20
CHAPTER 2...23
2.1 INTRODUCTION... 25
2.2 METHODS... 27
2.2.1 Architeuthis Sample ... 27
2.2.2 DNA extraction ... 27
2.2.3 Primer design... 28
2.2.4 PCR amplification and cloning... 31
2.2.5 Sequence analysis ... 31
2.2.6 DGGE analysis ... 31
2.3 RESULTS... 33
2.3.1 Conserved 16S primers ... 33
2.3.2 Chordate primers ... 35
2.3.3 DGGE analysis ... 35
2.4 DISCUSSION... 38
CHAPTER 3...41
3.1 INTRODUCTION... 43
3.2 MATERIALS AND METHODS... 45
3.2.1 Feeding trial and sample collection... 45
3.2.2 DNA extraction, PCR and sequencing ... 49
3.2.3 DGGE analysis ... 52
3.2.4 Quantitative Estimates ... 52
3.2.5 Data analysis... 53
3.3 RESULTS... 54
3.3.1 DGGE separation of PCR products ... 54
3.3.2 Detection of prey DNA in feeding trial scat samples ... 55
3.3.3 Control samples ... 56
3.3.4 Time course samples ... 58
3.3.5 Unknown samples ... 58
3.3.6 Quantitative estimates... 59
CHAPTER 4...69
4.1 INTRODUCTION... 71
4.2 MATERIALS AND METHODS... 72
4.2.1 Faecal and tissue samples... 72
4.2.2 Quantitative PCR ... 73
4.3 RESULTS AND DISCUSSION... 77
CHAPTER 5...85
5.1 INTRODUCTION... 87
5.2 MATERIALS AND METHODS... 89
5.2.1 DNA Samples ... 90
5.2.2 Primer design... 90
5.2.3 Quantification of mtDNA ... 91
5.2.4 Analysis of length-inhibition ... 92
5.2.5 Model for quantitative estimates of DNA damage ... 93
5.3 RESULTS... 95
5.3.1 Primer testing and DNA quantification ... 95
5.3.2 Length-specific inhibition... 97
5.3.3 Model results... 98
5.4 DISCUSSION... 100
CHAPTER 6...107
6.1 INTRODUCTION... 109
6.2 MATERIAL AND METHODS... 111
6.2.1 Study site, sample collection and DNA extraction ... 111
6.2.2 Stomach content analysis ... 112
6.2.3 Genetic presence/absence detection in faecal samples... 113
6.2.4 Genetic clone library analysis of faecal samples... 115
6.2.5 Data analysis... 116
6.3 RESULTS... 117
6.3.1 Stomach content analysis ... 117
6.3.2 Genetic presence/absence detection in faecal samples... 119
6.3.3 Genetic clone library analysis of faecal samples... 122
6.4 DISCUSSION... 124
CHAPTER 7...131
7.1 OVERVIEW OF CHAPTER... 133
7.2 RECENT DNA-BASED DIET STUDIES... 133
7.3 GENERAL DISCUSSION AND FUTURE DIRECTIONS... 137
7.3.1 Questions for future studies ... 139
7.3.2 Technical considerations ... 140
7.3.3 Future of DNA-based quantitative diet estimates ... 144
7.3.4 Concluding remarks ... 145
REFERENCES ...147
APPENDIX I:...163
APPENDIX II: ...169
List of Figures
Figure 2.1 Size of the PCR product which would be amplified from a taxonomically
diverse group of fish (Osteichthyes and Chondrichthyes) and cephalopods using 16S mtDNA primers (16S1F and 16S2R)... 29
Figure 2.2 Theoretical melt maps for 16S mtDNA fragments amplified from blue
grenadier (291 bp) and Architeuthis (229 bp) template using 16S mtDNA primers
(16S1F and 16S2R with a 3' GC clamp). ... 32
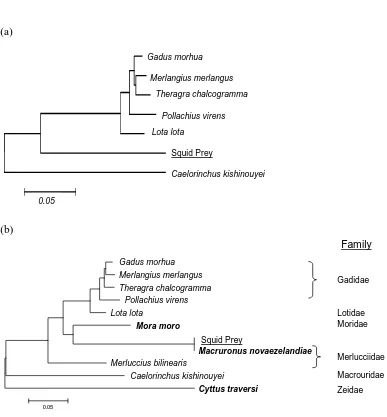
Figure 2.3 Neighbor-joining tree based on the 252 bp mtDNA sequence obtained
from the Architeuthis gut sample aligned with gadiformes species and additional
sequences obtained from fish species during the present study... 34
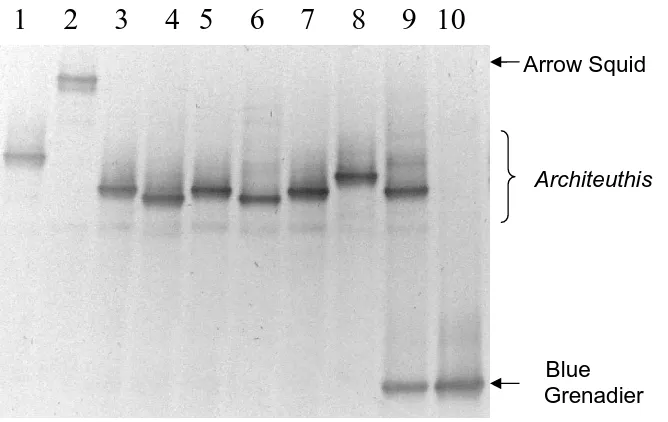
Figure 2.4. Denaturing gradient gel electrophoresis separation of mtDNA 16S PCR
products amplified from genomic DNA of arrow squid (nototodarus sp.) and blue grenadier (macruronus novaezelandiae) and DNA extracted from the the architeuthis gut contents. ... 36
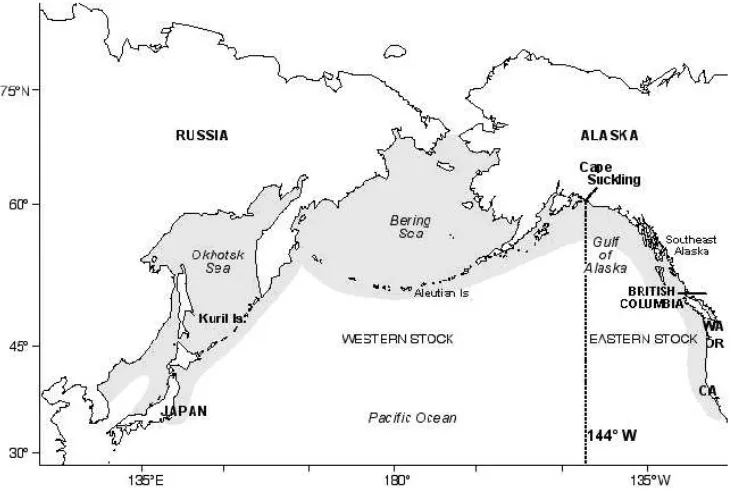
Figure 3.1 Distribution of Steller sea lions and the delineation of the two distinct
stocks... 45
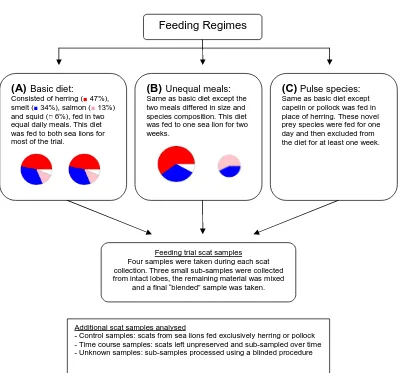
Figure 3.2 Overview of feeding regimes and scat samples collected during the feeding
trial... 47
Figure 3.3 Schematic of feeding trial experiment showing timing of scat collection
and pulse feeding events ... 48
Figure 3.4 Overview of genetic analysis performed on the samples collected during
the feeding trial ... 51
Figure 3.5 Denaturing gradient gel electrophoresis of 16S mtDNA fragments
amplified from fish prey species fed during the feeding trial. ... 54
Figure 3.6 Dot plot showing estimates of the proportions of fish species in diet
obtained through analysis of DNA in clone libraries. These samples were collected when the two daily meals were identical in composition... 60
Figure 3.7 Dot plot showing estimates of the proportions of fish species in diet
obtained through analysis of DNA in clone libraries. These samples were collected when the two daily meals differed in composition. ... 61
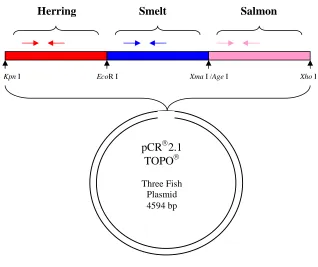
Figure 4.1 Schematic of the plasmid used as a standard in qPCR. The plasmid insert
contains mtDNA 16S gene fragments from three fish species ligated into the
Figure 4.2 Fluorescence measurements obtained during SYBR Green real-time PCR amplification of DNA from three fish species in eight representative faecal samples. .... 76
Figure 4.3 Example of a quantitative real-time PCR standard curve generated
through amplification of the three fish plasmid... 77
Figure 4.4 Box plots showing a summary of the percentage DNA composition data
based on quantitative real-time PCR estimates. Plots include results from tissue
mixture and from faecal samples. ... 78
Figure 4.5 Plot of actual diet versus estimated diet using various biomass
reconstruction methods... 83
Figure 5.1 Overview of the approach for quantification of DNA damage... 89
Figure 5.2 The proportion of amplifiable fragments versus amplicon size after a
random degradation process shown for various probabilities of a nucleotide being damaged (
λ
). ... 94
Figure 5.3 Quantitative estimates of the amount of amplifiable herring DNA in three
spiked faecal DNA extractions measured with assays targeting PCR products of five different sizes (69 bp, 123 bp, 184 bp, 226 bp and 304 bp)... 97
Figure 5.4 Quantitative PCR results obtained for herring DNA and sea lion DNA
extracted from ten sea lion faecal samples. The number of amplifiable copies is
plotted against amplicon size for each target species in each sample. ... 99
Figure 5.5 Plots of the estimated proportion of amplifiable fragments versus
amplicon size for various faecal DNA extracts... 102
Figure 6.1 Location of Capsize Beach penguin colony on Heard Island. ... 112
Figure 6.2 Summary of the prey detection data from macaroni penguin faecal
samples. Results are shown for five prey groups targeted with specific PCR tests... 121
Figure 6.3 Bar plot showing proportional composition of two euphausiid genera in
macaroni penguin diet samples. Data from: (a) sequences obtained from cloned PCR products; (b) numbers present in stomach samples... 124
Figure 7.1 The number of dietary studies using DNA-based identification methods
List of Tables
Table 1.1 Dietary studies of invertebrate predators investigating the use of
DNA-based methods for prey detection in gut contents... 12
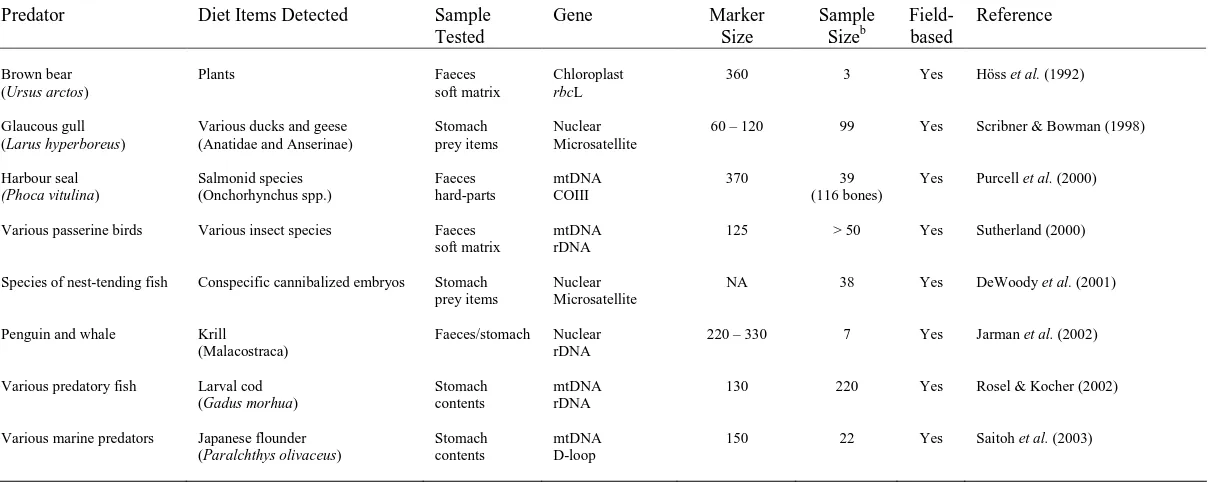
Table 1.2 Dietary studies of vertebrate predators investigating the use of DNA-based
methods for prey detection in stomach contents or faeces. ... 13
Table 2.1 Primers used in the current chapter (16S1F and 16S2R) aligned with
homologous sequences from representative target taxa... 30
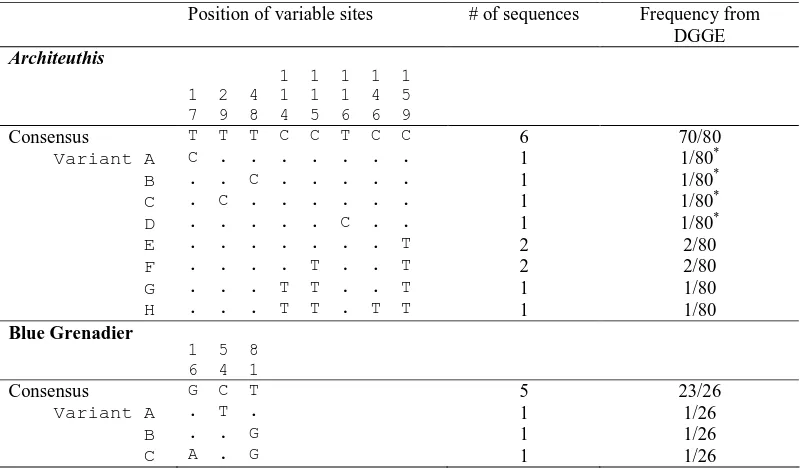
Table 2.2 Variable sites identified in nucleotide sequences obtained from amorphous
slurry component of the Architeuthis gut contents ... 37
Table 3.1 PCR primers used in the sea lion feeding trial (Chapter 3). ... 50
Table 3.2 Frequency of detection of prey DNA in scat samples collected during the
basic diet feeding regime of the captive feeding trial. ... 56
Table 3.3 Frequency of detection of prey DNA in scats collected from a sea lion while
being fed the same basic diet in either: (1) two daily meals of equal size and species composition, (2) two daily meals of unequal size and species composition. ... 57
Table 3.4 Summary of the PCR detection results in days following inclusion of pulse
species (pollock or capelin) in the diet for a single day.. ... 57
Table 3.5 Results of blind PCR tests for prey DNA preformed on ten sea lion scat
sub-samples... 59
Table 3.6 Percentage detection of predator mtDNA from studies carrying out PCR
analysis of DNA from mammalian scat. ... 64
Table 4.1 Estimated copy numbers of fish prey DNA template in sea lion faeces.. ... 79
Table 4.2 Percent composition of fish DNA in sea lion faecal samples... 80
Table 4.3 Summary of percent composition data with faecal composition estimates
corrected to account for differences in DNA density... 81
Table 5.1 Sequences of primers used to quantify DNA degradation. ... 91
Table 5.2 Estimated copy numbers of template in PCR amplifications used to
quantify DNA degradation and results from the model fits. ... 96
Table 6.1 PCR primers used to detect DNA from five groups of potential prey in
macaroni penguin faecal samples... 114
Table 6.2 Composition of macaroni penguins stomach samples (based on wet mass of
Table 6.3 Comparison of percent frequency of occurrence data of macaroni penguin
prey identified through conventional stomach content analysis and genetic analysis of
faeces... 119
Table 6.4 Comparison of the diversity of prey identified by conventional stomach content and faecal DNA analysis... 120
Table 6.5 Summary of the taxonomic classification of sequence data obtained through the analysis of clone libraries produced from macaroni penguin faecal DNA. ... 123
Table 7.1 Recent dietary studies of invertebrate predators investigating the use of DNA-based methods for prey detection in gut contents... 135
Table 7.2 Recent dietary studies of vertebrate predators investigating the use of DNA-based methods for prey detection in stomach contents or faeces... 136
Table A1.1 Sequences of primers used for nested PCR amplification... 164
Table A1.2 Performance of nested and standard PCR under various conditions... 166
Table A2.1 Details of all PCR primer pairs used in the thesis... 169
Table A2.2 Details of the degenerate primers used to create clone libraries from penguin faecal samples. ... 170
Table A3.1 Estimated copy numbers of sea lion and herring DNA in sea lion faeces for various sizes of PCR target. ... 171
General Introduction
“I suppose I ought to eat or drink something or other; but the great question is, what?”
1.1 Introduction
The determination of trophic relationships within biological communities has been the central goal of innumerable ecological studies (Pimm 2002). In the marine environment, concerns over the effects of increased global fishing pressures, climate change and other human induced ecosystem modifications have resulted in
increasingly detailed studies of oceanic food webs (Trites 2003). Data from these studies are critical for implementation of current conservation strategies, such as ecosystem-based approaches to fisheries management (Garcia & Cochrane 2005) and the development of marine protected areas (Sale et al. 2005). Research on the diet of upper trophic level animals is especially extensive due to their long history of
exploitation (Myers & Worm 2005), fluctuations in their population sizes (Springer et al. 2003) and their sensitivity to changes in ecosystem structure (Reid et al. 2005). Methods of determining diets of these species are varied. Numerous studies have employed gut content analysis (e.g. Ealey 1954; Croxall et al. 1985), identification of hard remains in faecal samples (e.g. Tollit & Thompson 1996; Orr et al. 2004), analysis of fatty acid signatures (e.g. Phillips et al. 2001; Iverson et al. 2004), analysis of tissue stable isotope ratios (e.g. Hobson et al. 1997; Cherel et al. 2000) or
observations of feeding behaviour (e.g. Bowen et al. 2002). The diversity of methods used to study diet reflects the fact that none are universally adequate, and the amount of interest in diet studies indicates further refinements would be valuable.
1.2 Conventional dietary analysis methods
1.2.1 Stomach content analysis
Traditionally, the diet of marine mammals and seabirds was determined through analysis of stomachs contents (Pitcher 1980; Croxall et al. 1985). For a diet study carried out in the Gulf of Alaska, Pitcher (1980) collected 548 harbour seals “by rifle”; almost all early diet studies used lethal sampling directly or obtained stomach samples from commercial hunts. In most situations, destructive sampling is now ethically unacceptable and commercial hunts of marine mammals and seabirds are very limited. Procedures have been developed to allow collection of stomach contents without using lethal sampling (Hyslop 1980; Wilson 1984; Harvey & Antonelis 1994). While these methods are a huge improvement ethically, they still can be quite invasive. For example, the stress of handling and loss of fluid during the stomach flushing procedure has been reported to cause hyperthermia in penguins, which can be lethal to the sampled bird in rare cases (e.g. Chiaradia et al. 2003). In addition, the collection of stomach contents from seabirds typically occurs as the adults return to feed chicks; interception of this food has the potential to impact on chick development (Chiaradia et al. 2003). In pinnipeds, sample collection usually involves the use of anaesthetic agents for animal immobilization (van den Hoff et al. 2003), a procedure that is not without risk. Due to these potential impacts, the number of stomach samples that can be collected in diet studies is often restricted.
Ethical concerns aside, there are several other problems with the approach. One drawback is that prey remains present in stomachs represent only very recently consumed prey. This means that a large number of samples need to be analysed to obtain a representative picture of the diet of a population. In addition, often a
introduces significant bias into the analysis because some prey species will rapidly become unrecognizable, while others are resistant to digestion or possess easily identifiable hard parts (Hartley 1948; Hyslop 1980; Gales 1988). This bias is made worse by differential passage rates of remains from various prey species – such as the accumulation of large cephalopod beaks in seal stomachs (Harvey & Antonelis, 1994). Another problem is that different enumeration methods (frequency of
occurrence, percentage by number, percentage by mass, or reconstitution of biomass) can lead to considerably different pictures of diet composition (Hyslop 1980; Lescroel et al. 2004). A final difficulty with the approach is that the collection of stomach samples requires animal capture. Depending on the predator species being studied, this can be quite time consuming and operationally difficult (van den Hoff et al. 2003).
Even with the weaknesses outlined above, stomach content analysis can clearly provide valuable dietary information. Provided a large number of samples are collected and analysed, and various enumeration methods are sensibly employed, a reasonable assessment of diet composition can be expected. The approach can also provide data that is difficult to obtain using alternate methods, such as direct information on the size of prey being consumed and data on meal size (Barlow & Croxall 2002). For seabirds, analysis of stomach contents obtained by stomach flushing remains the standard method of diet analysis (Green et al. 1998; Hull 1999).
1.2.2 Faecal analysis
species-specific differences in hard part survival during digestion (Jobling 1987; Harvey 1989).
The biases caused by differential digestion have been well documented (Jobling 1987). Some prey species have no hard parts that survive digestion and are missed entirely in faecal-based estimates of diet composition (Da Silva & Neilson 1985). For those prey species that are represented by hard parts in faeces, only a fraction of the hard parts ingested remains intact (Harvey 1989; Tollit et al. 1997; Bowen 2000). This results in the dietary importance of prey species with small, fragile bones being underestimated and prey species with big, robust bones being overestimated (Bowen 2000; Tollit et al. 2003). In addition to determining prey numbers, many studies calculate the original prey biomass (Laake et al. 2002). This is accomplished by using the lengths of otoliths and beaks to estimate the length and masses of the ingested fish and cephalopods. This procedure can introduce further bias in diet estimates because hard parts erode at different rates (depending on species and size of prey). Captive feeding trials have been employed to assess the changes in number and size of hard parts that occur as they pass through the digestive tract of various pinnipeds (Harvey 1989; Tollit et al. 2003) and results from these studies can be used to develop correction factors in order to compensate for digestion biases. While correction factors are certainly useful, it has been demonstrated that digestion rates are affected by many different factors (e.g. species of predator, activity level of predator and size of prey) making their development and application challenging (Bowen 2000; Tollit et al. 2003).
An additional limitation of dietary studies based on faecal analysis is that there is usually no link between a sample and a particular animal. This means that dietary differences between categories of the predator (such as sex or age class) cannot be explored (for exception see Reed et al. 1997).
for dietary analysis in most seabirds and some pinnipeds due to the very low recovery of prey hard parts in their faeces (Hartley 1948; Gales & Cheal 1992).
1.2.3 Tissue biomarker methods
In order to overcome problems associated with stomach content and faecal analysis, indirect biochemical approaches have been developed to study diet. Two methods are commonly applied to marine predators and will be briefly considered here: fatty acid signature analysis and stable isotope techniques.
Fatty acid analysis of predator tissue can provide information on diet since many prey species differ in their fatty acid composition (due to differences in lipid synthesis pathways) and, upon consumption, these fatty acid signatures are
incorporated into predators’ fat stores (Iverson et al. 2004). Due to the large variety of fatty acids present in phytoplankton, fatty acids are particularly good biomarkers in marine ecosystems (Raclot et al. 1998; Iverson et al. 2004). The potential of this approach has been recognised for well over 20 years (Bishop et al. 1983), but only recently has the method been widely applied and assessed in detailed diet studies (Bradshaw et al. 2003; Grahl-Nielsen et al. 2003; Iverson et al. 2004). While numerous studies have inferred differences in diet based on fatty acid signatures, many factors complicate interpretation of results. These factors include: geographic and temporal variation in prey fatty acid profiles (Iverson et al. 1997); metabolic changes to fatty acids within the predator (Iverson et al. 2004); selective
use/deposition of fatty acids (Hooker et al. 2001); and questions over the appropriate statistical treatment of data (Grahl-Nielsen 1999). The taxonomic resolution of the technique (i.e. ability to classify prey groups present in the diet) varies considerably. Some studies obtain species level discrimination (Iverson et al. 2004), whereas others only differentiate between broad prey groups (e.g. fish- or squid-dominated diets; Bradshaw et al. 2003)
an animal’s tissues can be used to determine its trophic position (Hobson et al. 1997). Carbon only experiences minor enrichment, but the carbon isotope ratio provides information on contributions from different sources of primary production (e.g. freshwater versus marine, inshore versus offshore) (Cherel et al. 2000). The taxonomic resolution of the technique has been improved with the development of mixing models (Phillips & Gregg 2001; Phillips et al. 2005), but stable isotope techniques are generally most appropriate for assessment of broad dietary shifts and changes in foraging location (Bocher et al. 2000).
A major advantage of using one of the tissue biomarker methods to study diet is that they provide data over longer time scales. This means that fewer samples need to be analysed to obtain a community level view of diet. It also means information about prey consumed during the non-breeding period can be obtained. Most of the traditional diet data available for sea birds and pinnipeds has been collected during the breeding season, when animals are easily accessible and stomach/faecal samples can be obtained, even though this may only be a small proportion of the annual cycle.
1.3 Application of DNA-based techniques to diet analysis 1
Early diet studies using molecular identification of prey relied on the use of monoclonal antibody techniques to detect prey-specific proteins in dietary samples. This immunological approach has been used extensively to detect species of prey being consumed by insect predators (see recent review by Symondson 2002), and has also been applied to detect prey in the stomach samples of seabirds (Walter et al. 1986) and squid (Kear 1992). Large numbers of gut samples can potentially be screened rapidly using monoclonal antibodies, but development of each specific assay is time-consuming. In addition, it is unlikely predator faecal samples could be tested using the approach because only minute quantities of undigested prey protein survive digestion. The development of polymerase chain reaction (PCR) (Mullis et al. 1986) has allowed prey DNA to be detected in both stomach samples and faeces, and this approach has almost completely supplanted the use of immunological techniques. In a recent review of molecular identification of prey in predator diets, Symondson (2002) concluded that: “PCR-based techniques have proven to be highly effective and versatile in recent laboratory trials and are likely to rapidly displace all other approaches”.
The PCR technique allows exponential amplification of a specific DNA region; the amplified region is defined by short, user-specified DNA primers (Mullis & Faloona 1987). Features of PCR that make it particularly well suited for use in DNA-based diet studies are: (1) it is extremely sensitive, requiring only very small amounts of substrate DNA; and (2) it is very specific, so only DNA fragments that match the PCR primers will be amplified. Virtually all DNA-based diet studies have used PCR to amplify DNA present in dietary samples in order to obtain enough material for subsequent analyses. Two general approaches can be taken to identify prey DNA from dietary sources using PCR. In the first approach, PCR primers are designed to amplify DNA only from a specific target prey species (or group of species). Successful PCR amplification of DNA extracted from diet samples using these primers indicates the presence of DNA from the particular target (e.g. Agustí et al. 2003). The second approach utilizes primers which bind to DNA regions
The use of DNA-based methods in diet studies can focus on either material recovered from stomach contents or faeces. In the following review of the work that has been done to date, I will address each separately.
1.3.1 DNA-based stomach content analysis
In invertebrate diet studies, few non-molecular approaches exist to study diet (Symondson 2002); this may explain why research on these animals has featured so prominently in the development of DNA-based diet analysis (Table 1.1). The initial investigation of PCR-based methods to identify prey present in stomach contents was in a study on the predation by sand shrimp (Crangon affinis) on larval stone flounder (Kareius bicoloratus) (Asahida et al. 1997). This laboratory based study determined the ability of PCR to detect fish mitochondrial DNA (mtDNA) in the stomach contents of sand shrimp at various time points after predation (0-5 hours). The researchers used both fish-specific primers and K. bicoloratus-specific primers that targeted relatively large fragments of the mtDNA control region (~ 2600 bp and 1400 bp respectively). The results showed that the larger fish DNA fragments could only be detected in 50% of the stomach samples after three hours, and this DNA fragment was undetectable five hours after predation. Detection was better for the 1400 bp
fragment; it could be detected in 50% of the samples collected after five hours. Besides highlighting the potential of this approach, this study also discussed the relative merits of using species-specific versus more general PCR primers.
Shortly after this study, a number of PCR-based diet experiments were published focusing on the application of the approach in studies of predator-prey relationships among terrestrial arthropods (reviewed by Symondson 2002). In one of the early arthropod studies, Zaidi et al. (1999) carried out an experimental feeding trial with carabid beetles as predators and mosquitoes as prey. Prey DNA was detected by PCR using primers targeting a mosquito-specific region of a multiple-copy nuclear esterase gene. Two fragment sizes were amplified (146 and 263 bp). The shortest fragment of mosquito DNA could be detected for up to 28 hours (the
Chen et al. 2000; Hoogendoorn & Heimpel 2001), opened the way for field-based applications. The first field-based study with terrestrial arthropods examined predation by spiders on three species of Collembola in an agricultural ecosystem (Agustí et al. 2003). These researchers targeted the mtDNA cytochrome oxidase I gene (211-276 bp), and in preliminary laboratory trials found prey DNA was
detectable in 100% of spiders for 24 hours after being fed a single collembolan. In the field, they found collembolan DNA in almost half of the collected spiders. The Collembola species detected most frequently in the spider guts (Isotoma anglicana) was the least numerous in the field (based on visual surveys), indicating this prey was preferred by the spiders.
Predator Diet Items Detected Sample Tested
Gene Marker
Size Sample Sizeb Field-based Reference Sand shrimp (Crangon affinis) Stone flounder (Kareius bicoloratus) Stomach contents mtDNA D-loop
1400 – 2600 24 No Asahida et al. (1997)
Predatory bug (Dicyphus tamanini)
Moth eggs
(Helicoverpa armigera)
Whole predator Nuclear Various
250 – 1100 20 No Agustí et al. (1999)
Carabid beetle (Pterostichus cupreus)
Mosquito
(Culex quinquefasciatus)
Whole predator Nuclear Esterase
150 – 260 70 No Zaidi et al. (1999)
Predatory bug (Dicyphus tamaninii)
Whitefly
(Trialeurodes vaporariorum)
Whole predator Nuclear Various
310 – 2100 20 No Agustí et al. (2000)
Lady beetle and lacewing Cereal aphids (Rhopalosiphum spp.)
Whole predator mtDNA COII
80 – 390 ~ 100 No Chen et al. (2000)
Carabid beetle (Coleomegilla maculate)
Corn borer moth eggs (Ostrinia nubilalis)
Whole predator Nuclear rDNA
150 – 490 94 No Hoogendoorn & Heimpel (2001)
Linyphiid spiders Various Collembola species Whole predator mtDNA COI
210 – 280 82 Yes Agustí et al. (2003a)
Predatory bug (Anthocoris tomentosus)
Pear psylla (Cacopsylla pyricola)
Whole predator mtDNA COI
190 – 270 NA No Agustí et al. (2003b)
a
Includes primary literature published before 2004 and listed in the Web of Science© database. Diet studies on parasites are excluded (e.g. studies analysing the source of insects’ bloodmeals).
b
[image:26.612.65.680.165.406.2]Predator Diet Items Detected Sample Tested
Gene Marker
Size Sample Sizeb Field-based Reference Brown bear (Ursus arctos)
Plants Faeces
soft matrix
Chloroplast
rbcL
360 3 Yes Höss et al. (1992)
Glaucous gull (Larus hyperboreus)
Various ducks and geese (Anatidae and Anserinae)
Stomach prey items
Nuclear Microsatellite
60 – 120 99 Yes Scribner & Bowman (1998)
Harbour seal (Phoca vitulina) Salmonid species (Onchorhynchus spp.) Faeces hard-parts mtDNA COIII
370 39
(116 bones)
Yes Purcell et al. (2000)
Various passerine birds Various insect species Faeces soft matrix
mtDNA rDNA
125 > 50 Yes Sutherland (2000)
Species of nest-tending fish Conspecific cannibalized embryos Stomach prey items
Nuclear Microsatellite
NA 38 Yes DeWoody et al. (2001)
Penguin and whale Krill (Malacostraca)
Faeces/stomach Nuclear rDNA
220 – 330 7 Yes Jarman et al. (2002)
Various predatory fish Larval cod (Gadus morhua)
Stomach contents
mtDNA rDNA
130 220 Yes Rosel & Kocher (2002)
Various marine predators Japanese flounder (Paralchthys olivaceus)
Stomach contents
mtDNA D-loop
150 22 Yes Saitoh et al. (2003)
a
Includes primary literature published before 2004 and listed in the Web of Science© database, with the exception of Purcell et al. (2000) and Sutherland (2000) which were included due to their relevance to the thesis topic. Studies based on the analysis of ancient remains were not included.
b
[image:27.612.68.672.135.376.2]1.3.2 DNA-based faecal analysis
The first study to demonstrate that dietary information could be obtained from DNA present in faeces was published by Höss et al. (1992). These researchers
amplified a 356 bp fragment of DNA from European brown bear faeces with plant-specific PCR primers targeting the chloroplast ribulose-bisphosphate carboxylase (rbcL) gene. A positive PCR result indicated the presence of plant DNA, and direct sequencing followed by comparison with known sequences revealed the recovered plant DNA was from Photinia villosa. Berries from this plant form a dominant component of these bears’ diet during late summer, so the dietary data itself was not surprising. However, the fact that plant DNA could pass through the bear’s digestive system indicated that a wealth of previously unattainable dietary data existed in faeces. Little progress followed this initial success, probably because the lack of sequence data for most species meant a monumental sequencing effort would have been required to identify any unknown DNA sequences recovered from faeces. The use of species-specific primers was also limited by the lack of sequence data available at this time – since the development of these primers relies on comparative sequence data. Dietary analysis based on DNA in faeces was eventually continued by ancient DNA researchers who documented the diet of an extinct ground sloth through analysis of ancient faecal material (coprolites) (Poinar et al. 1998). They amplified a 183 base pair fragment of the chloroplast rbcL gene, cloned the PCR products and sequenced 72 clones. The recovered plant sequences were compared to sequences in GenBank and seven groups of plants were identified to family or order (Poinar et al. 1998). Further studies on plants in ground sloth diet and the dietary diversity of archaic humans (animal and plant components) have since been carried out by analysis of DNA obtained from coprolites (Hofreiter et al. 2000; Poinar et al. 2001).
some species from endangered populations), Purcell et al. (2000) extracted DNA from 146 bones obtained from seal faeces. They were able to amplify PCR products from 102 of the samples and the DNA was identified to species level by sequencing or restriction enzyme analysis. In their study, identification of prey still relied on some hard parts surviving digestion, and the bones had to be individually isolated and identified to family level before genetic analysis. Nevertheless, the DNA-based approach provided important data that could not have been obtained by other means.
A detailed assessment of the use of DNA-based faecal analysis in diet studies of insectivorous birds was carried out by Sutherland (2000). In this unpublished thesis, PCR was used to amplify insect DNA from faeces of captive starlings (Sturnus vulgaris) and from faeces of wild nestlings of blue tits (Parus caeruleus), great tits (P. major) and swallows (Hirundo rustica). Sutherland (2000) used PCR primers
targeting relatively conserved regions of the 12S mtDNA gene in all of his studies and identified recovered prey DNA by restriction enzyme analysis or sequencing. The captive feeding trial with starlings demonstrated that insect DNA could be reliably recovered from passerine bird faeces. It also indicated that it might be possible to quantify the relative amounts of different prey species being consumed by determining the proportions of DNA present in faecal samples. The quantitative conclusions were based on results from DNA clone libraries created using mixtures of faeces obtained from starlings fed either locusts (Locusta migratoria) or grasshoppers (Schistocerca gregaria). The faeces from starlings on the two different diets were mixed in ratios of 9:1, 3:1, 1:1, 1:3 or 1:9; these ratios corresponded well to the proportion of clones from the prey species present in the respective clone libraries. In the analysis of wild nestling diets, results from the two species of tits showed the faeces from both species contained a similar range of mainly lepidopteran prey. The diet diversity of swallow nestlings was compared between sites on organic farms and conventional farms. Due to a relatively small sample size and some difficulty
identifying recovered insect DNA, no firm conclusions could be made concerning differences between the sample sites, but once again DNA from a variety of insect prey species was recoverable.
2002). The faeces of these groups contain very few morphologically identifiable prey remains, and their diet is generally studied through stomach content analysis. The lethal sampling of whales for scientific research (including diet studies) has been particularly controversial (Ichii & Kato 1991; Aron et al. 2000). Jarman et al. (2002) collected faeces from pygmy blue whales (Balaenoptera musculus) and Adelie penguins (Pygoscelis adeliae). The species of krill being consumed by these predators was determined using krill-specific primers to amplify DNA extracted from their faeces. The main conclusion of this study was that recoverable prey DNA was present in amorphous faecal material obtained from these marine predators, and this material could be used in diet studies. This finding provided the impetus for the initiation of my PhD project.
1.4 Relevant research in allied fields
In the review of DNA-based diet analysis presented so far, I have only
discussed genetic studies that have focused directly on obtaining dietary information. There is also a large amount of highly relevant work that has been done in related fields. This includes research on non-invasive genetic sampling, ancient DNA, microbial biodiversity and DNA barcoding. I will briefly outline some of the important contributions from these fields.
Non-invasive genetic sampling generally refers to research that obtains DNA samples from free-ranging animals without having to capture or even observe the animals of interest (Taberlet & Waits 1998). The DNA can be obtained from shed hair or feathers, eggshells, urine or faeces. DNA from these sources is usually present in low quantities and the DNA is often degraded. Prey DNA extracted from faeces or gut contents share these properties, therefore many of the methods that have been
developed in this field are relevant for DNA-based diet studies (Taberlet et al. 1999; Morin et al. 2001; Broquet & Petit 2004). Particularly relevant are methods designed specifically for use with faecal DNA, such as preservation of DNA in faeces,
Scientists from the field of ancient DNA research were the first to characterize dietary DNA in faeces (Höss et al. 1992); this is not surprising since these researchers pioneered the recovery of degraded DNA using PCR (Pääbo 1989; Pääbo 1990; Höss et al. 1996). Much of the ancient DNA literature (recently reviewed by Pääbo et al. 2004) is relevant to DNA-based diet studies, especially the detailed studies that have been carried out on DNA damage (Hofreiter et al. 2001; Gilbert et al. 2003; Mitchell et al. 2005). The persistent problem of PCR contamination in ancient DNA studies is also highly pertinent to DNA-based diet studies. The extreme sensitivity of PCR amplification means that great care has to be taken to prevent false positive results being obtained. Numerous precautionary measures have been outlined by ancient DNA researchers to prevent the occurrence of this problem when working with small amounts of DNA template (Cooper & Poinar 2000; Gilbert et al. 2005).
Researchers interested in microbial biodiversity have adopted a genetic approach to characterize species diversity in environmental samples due to the difficulty in culturing and/or microscopically identifying the majority of microbes present in the environment (Delong et al. 1994). The methodology often used in these studies is to isolate total DNA obtained from a microbial community, amplify a region of DNA from the sample using PCR and then identify and quantify members of the microbial community using sequence polymorphisms (e.g. Delong et al. 1994; Orphan et al. 2000; Braker et al. 2001). This is the same approach that has been adopted by many DNA-based diet studies, a reflection that the objective of dietary work is essentially the same as that of microbial biodiversity studies (i.e. to identify and quantify the “community” of prey DNA in a sample). Several of the methods microbiologists have developed could be applied in DNA-based diet studies. For example, microbiologists commonly use genetic fingerprinting techniques (e.g. denaturing gradient gel electrophoresis) to allow physical separation of the DNA sequence polymorphisms in their samples (Muyzer 1999); this approach could be used to determine DNA diversity in dietary samples. The techniques used for
methods to obtain an accurate representation of the endogenous DNA present in a sample (reviewed by Forney et al. 2004).
DNA barcoding refers to the development of large-scale standardized
sequence databases in order to allow taxonomic classification of unknown biological samples. This type of database has been in use by microbiologists for many years (Wuyts et al. 2001), and a comprehensive database of animal DNA sequences from the mitochondrial cytochrome oxidase I gene (COI) is in the process of being developed (Hebert et al. 2003). Information from the COI database could be directly applied to identify prey DNA isolated in diet studies if the PCR assays used target the COI gene. Even without making direct use of this DNA barcoding database, much of the literature in this field is useful since it provides a conceptual framework for the application of DNA-based taxonomy (Hebert et al. 2004; Blaxter et al. 2005).
1.5 Thesis outline
The data chapters of this thesis (Chapter 2 – Chapter 6) were written as separate scientific papers that have either been published, submitted, or are in the process of being published. These papers include research on a diverse group of marine predators and each focuses on distinct questions; the thesis is tied together by the common theme of developing a DNA-based approach for studying diet.
Chapter 3 outlines a feeding trial carried out with captive Steller sea lions (Eumetopias jubatus) to investigate the feasibility of using DNA-based analysis of the soft matrix of faeces to study pinniped diet. Based on previous diet work (both
molecular and conventional) it was apparent that controlled feeding experiments with captive animals would be required to validate the DNA-based approach. No previous controlled feeding trials investigating DNA-based diet methods had been carried out with mammals. In field-collected pinniped faeces, prey DNA had been isolated from hard parts, but not from the soft-matrix of faeces (Purcell et al. 2000). Since it is known that digestion bias effects recovery of hard-parts, I wanted to focus on prey DNA extracted from soft matrix of faeces. The feeding trial was designed to addresses a number of fundamental questions:
• Can prey DNA be reliably detected in the soft matrix of sea lion faecal samples? • Can DNA from prey items fed as a small proportion of the diet be detected? • How is prey DNA distributed in faeces?
• How long after ingestion does a signal from prey DNA persist in samples? • How long does prey DNA survive in unpreserved samples?
• Are the relative amounts of DNA recovered from prey species proportional to their mass in the diet?2
• What is the quality of the prey DNA recovered?3
Chapter 4 contains a detailed analysis of the amount of prey DNA present in the sea lion faecal samples. Using quantitative real-time PCR (qPCR), I further investigated results from the previous chapter that showed (based on analysis of PCR clone libraries) that the proportions of fish DNA in faeces from captive sea lions were roughly proportional to the mass of the prey items consumed. The use of qPCR allowed more samples to be analysed and provided an independent method of measuring the amount of prey DNA present in the samples.
Chapter 5 focuses on measuring the quality of DNA recovered in faecal samples. The concept of DNA quality is often discussed, and usually refers to the level of DNA degradation in a sample – but there is no way of measuring this in many situations. I present a general method to quantify DNA damage present in specific DNA sequences. The approach is applied to determine the quality of DNA originating
2
This question is further evaluated in the next data chapter.
3
from predator (sea lion) and prey (herring) in the faecal samples collected during the captive feeding trial.
Chapter 6 presents results from a field-based study on the diet of macaroni penguins (Eudyptes chrysolophus). Dietary information was collected using DNA-based analysis of faecal material as well as through conventional stomach content analysis. Comparisons are made between the traditional and genetic data, and future prospects for using a DNA-based approach to study seabird diet are discussed.
The thesis concludes with a review of some concurrently published DNA-based diet studies on pinnipeds, a general discussion and suggestions for future directions of research in this field. The appendices include: (I) an evaluation of the strengths and weaknesses of nested-PCR; (II) details of PCR primers used in the thesis; (III) summary of qPCR data collected in Chapter 4; (IV) detailed results from the macaroni penguin faecal DNA clone library analysis (Chapter 6).
For chapters that have been published (or submitted) citation and
co-authorship details are included at the end of this section. In all cases, I was the senior author, and conducted the laboratory work, analysis of data and writing of the papers. My co-authors contributed significantly to the initiation of the projects, sample collection, advice on analysis, and/or by critically reviewing the papers in preparation for publication. The published papers have been modified to integrate the chapters into this thesis; however, each chapter is essentially self-contained and there may be some repetition in content throughout the thesis.
1.6 Details of publications resulting from thesis
Chapter 2:
Deagle BE, Jarman SN, Pemberton D and Gales NJ (2005) Genetic screening for prey in the gut contents from a giant squid (Architeuthis sp.). Journal of Heredity, 96, 417-423.
Chapter 3:
Chapter 4:
Deagle BE and Tollit DJ (2006) Quantitative analysis of prey DNA in pinniped faeces: potential to estimate diet composition? Conservation Genetics, In press
Chapter 5:
Deagle BE, Eveson JP and Jarman SN (submitted) Quantification of damage in DNA recovered from highly degraded samples – a case study on DNA in faeces.
Chapter 6:
This chapter has not yet been submitted as a paper.
Additional publications containing results from thesis:
Jarman SN, Deagle BE and Gales NJ (2004) Group-specific polymerase chain reaction for DNA-based analysis of species diversity and identity in dietary samples. Molecular Ecology, 13, 1313-1322. (Chapter 2)
Chapter 2
Genetic screening for prey in the gut contents from a Giant
Squid
An ocean without its unnamed monsters would be like a completely dreamless sleep.
Abstract
Information on the diet of giant squids (Architeuthis spp.) is scarce because these animals are rarely taken from their deep-sea habitat and very few specimens have morphologically recognisable remains in their digestive tracts. In this chapter, I explored the use of PCR-based methods for detection of DNA in the prey remains and amorphous slurry from an Architeuthis gut sample. Primers with conserved binding sites were designed to amplify a region of the 16S mtDNA from potential prey species. The amplified sequence varied in size allowing separation of fragments from fish (~ 255 bp in size) and squid (~ 180 bp in size). Prey DNA could be amplified from prey remains as well as from the amorphous stomach content slurry. Sequence comparisons identified fish prey as blue grenadier (Macruronus novaezelandiae). Isolation of Architeuthis DNA from an ingested tentacle and the presence of chitin fragments indicate cannibalism may occur in giant squid. Denaturing gradient gel electrophoresis was used to screen for less common DNA types, revealing a relatively high frequency of PCR generated false alleles but no additional prey species. A limitation of using universal primers to screen the gut sample was the prevalence of DNA from the predator (78 out of 80 clones initially screened came from
2.1 Introduction
The giant squids (Architeuthis spp.) have long captured the public’s imagination because of the rarity of specimens, their enormous size and their existence in an alien habitat. Architeuthis squid have been found over a huge
geographic range in the Pacific, Atlantic, Indian and Southern Oceans (Clarke 1966; Ellis 1995) and are common enough to form a significant part of sperm whales caloric intake in many areas (Clarke & MacLeod 1982; Clarke & Young 1998). Despite their apparent ubiquity very little scientific data has been collected on the species and only recently the first live giant squid was observed in the wild (Kubodera & Mori 2005). The taxonomy of the group is in a state of confusion due to the sporadic nature (both temporally and spatially) of collection and the poor quality of most specimens (Förch 1998). Ecological data are non-existent with the exception of some inferences which have been drawn from physiological and morphological observations (Brix 1983; Norman & Lu 1997; Lordan et al. 1998).
One of the most fundamental pieces of information needed to understand a species’ biology and role in an ecosystem is knowledge of its diet. Because so little is known about giant squid, diet data is particularly valuable, and can shed light on topics as diverse as this species habitat preference and swimming ability (Lordan et al. 1998). Of the common methods for determination of diet (direct observation, gut content analysis and fecal analysis), only identification of prey remains in the digestive tract is feasible for these squid. Some data has been collected by
morphological gut content analysis of specimens collected through occasional landing or chance stranding. However, these squid are usually in poor condition and the gut is often “empty” with no morphologically recognisable content (Förch 1998). Even if material is present, classification of the remains based on morphological features is notoriously difficult due to the squid tendency to tear apart and finely macerate prey items (Kear 1992). This has resulted in many scales, bones and lumps of flesh found in giant squid digestive tracts being reported as unidentifiable (Förch 1998; Lordan et al. 1998; Bolstad & O’Shea 2004). The limited information published on Architeuthis
The difficulties associated with diet determination through visual
identification of squid gut contents has led to the use of other methods such as fatty acid analysis (e.g. Phillips et al. 2001) and the identification of prey remains using immunological approaches (e.g. Kear 1992). The use of DNA identification
techniques seems like a logical approach to help identify decomposed species in squid gut contents. PCR-based methods have been used to detect specific species of larval fish from predatory fish stomachs (Rosel & Kocher 2002), and to identify species of krill flushed from stomachs of Adelie penguins (Jarman et al. 2002). Both the slurry of digested material in the stomach and isolated prey remains may contain DNA which could be extracted and amplified using PCR. Three general approaches could be taken to amplify DNA from these sources: (i) PCR primers could be used to detect specific species (e.g. Rosel & Kocher 2002) (ii) PCR primers could amplify a specific group of prey items (e.g. Jarman et al. 2002) or (iii) “universal” primers could be used to amplify DNA from a broad range of unspecified prey items (e.g. Rollo et al. 2002). In the latter two approaches the amplified DNA would need to be identified through a phylogenetic-based approach. Since the data available on the diet of giant squid is so incomplete, targeting specific species is not appropriate. A group-based approach could be useful, especially as a method of excluding the predator’s DNA from downstream analysis. A limitation in this particular case is that giant squid are known to feed on other squid, so the predator falls within a group of potential prey species. Amplification of DNA from a broad range of species could potentially identify all prey DNA present (including unexpected prey items). However, DNA from the predator, parasites and other non-prey species may be present in the gut, therefore relatively large numbers of DNA molecules may need to be characterised to isolate prey sequences.
future studies, considerably increasing the potential for diet data collection from scarce specimens of giant squid and other rare marine animals such as beaked whales.
2.2 Methods
2.2.1 Architeuthis Sample
The Architeuthis specimen was caught on June 14 1999 by a trawler fishing for blue grenadier at a depth of 500-700 meters off the west coast of Tasmania. The squid was a male weighing 190 kg, it was frozen on board the boat and kept frozen in storage until dissection in September 2002. It was opened along the ventral surface by cutting the mantle cavity via a longitudinal incision from the funnel to the rear. The posterior viscera were exposed and the oesophagus traced through to the caecum, stomach, intestine and rectum region. The gut contents were removed from the base of the oesophagus, stomach and caecum then stored in 95% ethanol. Only the knowledge that the sample was from the gut of a local Architeuthis specimen was provided to me before the end of the genetic analysis (no information on
location/method of capture or potential prey species).
2.2.2 DNA extraction
DNA was extracted from amorphous particles and recognizable prey remains which were isolated under a dissection microscope. The settled volume of the
amorphous particles was approximately 1 L. The isolated prey remains included: (a) > 50 scales, all of similar size and shape (b) three small (5-10 mm) tentacle fragments4 (c) one bone fragment (d) 12 chitinous squid beak fragments (< 5 mm). For DNA extraction, the amorphous particles were resuspended and samples of 2 mL were centrifuged for five min – yielding approximately 200 mg of pelleted material. I extracted DNA from two pellets in independent procedures. In a third set of
extractions DNA was extracted from individual scales (n = 10), tentacle fragments (n = 2) and the bone fragment. All extractions were done using the
4
hexadecyltrimethylammonium bromide (CTAB) method (Doyle & Doyle 1987). In this procedure all steps were carried out in 1.5 mL tubes and centrifugations were at 14000 rpm in a microcentrifuge. The samples were homogenised in 175 L CTAB buffer (2% CTAB; 100 mM Tris HCl, pH 8.0; 1.4 M NaCl; 20 mM EDTA; 0.2% 2-mercaptoethanol), 2 L Proteinase K (20 mg/mL) was added and samples were incubated at 65ºC for one h. Sequential extractions were done with 150 L of chloroform:isoamyl alcohol (24:1), 150 L of phenol:chloroform:isoamyl alcohol (25:24:1) and 150 L of chloroform:isoamyl alcohol (24:1), with five min
centrifugations between steps. The DNA was precipitated by addition of 150 L isopropanol (-20ºC) and pelleted by a 20 min centrifugation. The DNA was washed with 400 L of 70% ethanol, centrifuged for 5 min, air dried and resuspended in 30
L of distilled water. The concentration of purified DNA was determined using a PicoFluor fluorometer (Turner Designs). Near the end of the study, DNA was also extracted from fish tissue obtained from a local fish market using the method outlined above.
2.2.3 Primer design
primers which would have incorporated the small amounts of variation that was observed. However, potential incorporation of mismatches in PCR products may have confused interpretation of the DGGE analysis and the mismatches seemed unlikely to significantly affect primer binding, so I chose non-degenerate primers based on the squid sequence. The amplified region is short and variable, maximizing the likelihood of amplification and of obtaining informative sequence data. An additional useful feature of the amplified region is that it varies in length within and between the major taxa targeted. Based on the complete set of species used in primer design, the size of the this fragment is 258 bp ± 8.4 SD in fish and 180 bp ± 25.9 SD in cephalopods, with no overlap identified between these groups (Figure 2.1). The size in crustaceans overlaps that of the squid (Table 2.1).
0 2 4 6 8 10 12 14 16 1 3 1 -1 3 5 1 3 6 -1 4 0 1 4 1 -1 4 5 1 4 6 -1 5 0 1 5 1 -1 5 5 1 5 6 -1 6 0 1 6 1 -1 6 5 1 6 6 -1 7 0 1 7 1 -1 7 5 1 7 6 -1 8 0 1 8 1 -1 8 5 1 8 6 -1 9 0 1 9 1 -1 9 5 1 9 6 -2 0 0 2 0 1 -2 0 5 2 0 6 -2 1 0 2 1 1 -2 1 5 2 1 6 -2 2 0 2 2 1 -2 2 5 2 2 6 -2 3 0 2 3 1 -2 3 5 2 3 6 -2 4 0 2 4 1 -2 4 5 2 4 6 -2 5 0 2 5 1 -2 5 5 2 5 6 -2 6 0 2 6 1 -2 6 5 2 6 6 -2 7 0 2 7 1 -2 7 5 2 7 6 -2 8 0 . . . .
DNA fragment Size (bp)
N u m b e r o f o b s e rv a ti o n s
Figure 2.1 Distribution of fragment sizes of the PCR products which would be
amplified from a taxonomically diverse group of 30 fish (Osteichthyes and Chondrichthyes) (black bars) and 30 cephalopods (grey bars) using 16S mtDNA primers (16S1F and 16S2R). Sizes are based on sequence data taken from GenBank.
Table 2.1 Primers used in the current chapter aligned with homologous sequences from representative target taxa.
Phylum Class Family Genus + species Accession # 16S1F (5' →
3') 16S2R (5' →
3') Product Size
GGACGAGAAGACCCT CGCTGTTATCCCTATGGTAACT (bp)
Chordata Mammalia Physeteridae (sperm whales) Physeter macrocephalus AJ277029 A--- ---G--- 228
Elasmobranchii Squalidae (dogfish sharks) Squalus acanthia Y18134 A--- ---G--- 261
Rajidae (skates) Raja radiata AF106038 A--- ---G--- 261
Actinopterygii Amiidae (bowfins) Amia calva AY442347 A--- ---G--- 280
Congridae (conger eels) Conger myriaster AB038381 A--- ---G--- 271
Clupeidae (herrings, sardines) Sardinops melanostictus AB032554 A--- ---G--- 249
Cyprinidae (minnows, carps) Cyprinus carpio X61010 A--- ---G--- 255
Salmonidae (salmonids) Oncorhynchus mykiss L29771 A--- ---G--- 259
Neoscopelidae (lanternfishes) Neoscopelus microchir AP002921 A--- ---G--- 254
Gadidae (cods, haddocks) Gadus morhua X99772 A--- ---G--- 254
Berycidae (alfonsinos) Beryx splendens AP002939 A--- ---G--- 255
Zeidae (dories) Zenopsis nebulosus AP002942 A--- ---G--- 251
Gasterosteidae (sticklebacks) Gasterosteus aculeatus AP002944 A--- ---G--- 251
Sparidae (porgies) Pagrus major AP002949 A--- ---G--- 254
Mollusca Cephalopoda Architeuthidae (giant squids) Architeuthis dux AY377629 --- --- 190
Onychoteuthidae (hook squids) Moroteuthis ingens X79580 --- --- 190
Loliginidae (squids) Loligo bleekeri AB009838 --- --- 183
Loliginidae (squids) Sepioteuthis lessoniana AY131035 --- --- 186
Ommastrephidae (squids) Nototodarus gouldi AY380810 --- --- 191
Ommastrephidae (squids) Todarodes pacificus AB158364 --- --- 191
Octopodidae (octopus) Octopus vulgaris AJ390312 ---A--- --- 203
Octopodidae (octopus) Hapalochlaena maculosa AY545107 --- --- 189
Sepiidae (cuttlefishes) Sepia pharaonis AF369117 --- --- 184
Sepiidae (cuttlefishes) Sepiella maindroni AF369959 --- --- 191
Arthropoda Malacostraca Euphausiidae (krills) Euphausia superba AB084378 T---T--- ---AA--- 200
Euphausiidae (krills) Nyctiphanes australis AF177181 T---T--- ---AA--- 202
Penaeidae (penaeid shrimps) Penaeus monodon AF217843 ---T--- ---AA--- 207
Penaeidae (penaeid shrimps) Xiphopenaeus kroyeri AF192093 ---T--- ---AA--- 207
2.2.4 PCR amplification and cloning
Standard PCR reactions were performed on 2 L of template in a 25 L volume containing 0.4 µM of each primer, 0.125 mM dNTPs, 2.0 mM MgCl2, 1x
AmpliTaq Gold® buffer and 0.625 units AmpliTaq Gold® thermostable DNA polymerase (Applied Biosystems). Thermal cycling conditions for both primer sets were as follows: 94°C for 10 min then 35 cycles (94°C, 30s / 55°C, 30s / 72°C, 45s) followed by 72°C for 2 min. Samples were separated on a 2.0% agarose gel. PCR products were cloned into the pCR®2.1-TOPO vector (Invitrogen). Positive transformants were identified using blue/white colour selection, insert size was checked by digestion with EcoRI and separation of bands on a 2.0% agarose gel.
2.2.5 Sequence analysis
Sequencing reactions were carried out with the Big Dye prism dideoxy sequencing dye terminator kit (Applied Biosystems). Electrophoresis was performed on an Applied Biosystems 377 automated DNA sequencer. DNA sequences where compared with publicly available sequences in GeneBank using BLAST search (Altschul et al. 1990). Sequence data were aligned using CLUSTAL_X (Thompson et al. 1997). To determine sequence relatedness I used the neighbor-joining algorithm
(Saitou & Nei 1987) in MEGA version 2.01 (Kumar et al. 2001) based on distances calculated using Kimura’s two-parameter model (Kimura 1980). All nucleotides transitions and transversions were included in the analysis; nucleotide positions containing insertions/deletions in the alignment were excluded.
2.2.6 DGGE analysis