HYPERPROGRAMS
A thesis presented in partial fulfillment of
the requirements for the degree of Master
of Science in Computer Science at
Massey University
by
This development described herein - the first implementation of a hyperprogramming language - is related to, but far more wide-reaching than my original masterate project, which was to develop an editor for structure diagrams. Early in the course of the research, one of my supervisors, Paul Lyons, invented the hyperprogramming concept and designed a preliminary version of HyperPascal. In view of the fact that this original "flash of inspiration"was not mine, and the subsequent close cooperation during language development between me and my supervisors, it has proved difficult to determine the true originator of various ideas. Furthermore, as there are no earlier detailed descriptions of the principles of hyperprogramming, they must be included in this document. Therefore, in order to avoid claiming undue credit for the linguistic developments, I have described language design decisions using first person plural ('we").
However, converting these design decisions into an implementation of HyperPascal was solely my work.
program representation.
Programming involves two phases: first, forming a mental model of the problem solution; secondly, mapping the mental model onto a physical representation. The mental model is complex, syntax-free and multi-dimensional; in textual programming languages, the physical representation is complex, syntax-rich and single-dimensional. Performing the mapping is painstaking work which has more to do with easing compilation than with representing data manipulations.
It is believed that a physical representation which better matches the programmer's mental model will significantly reduce the difficulty of generating programs.
Modern computer systems combine powerful processors, and large memories with high-resolution graphics and powerful graphic input mechanisms. This ideally fits them for supporting the building and interpretation of complex multi-dimensional structures with minimal syntax.
The Hyperprogramming paradigm exploits this capability. A hyperprogramming language uses different visual representations for different program dimensions - for example different visual vocabularies are appropriate for algorithms and subroutine nesting. Each view is carefully chosen to overlap the others minimally, and where
overlap is essential, hyperlinks between views are provided to allow easy navigation between them, and to allow automatic updating of shared information.
HyperPascal was developed using this philosophy, as a testbed for it. In creating a program, a HyperPascal programmer edits information in three separate views:
the action window view, in which subroutines are each represented using a
visual language based on structure diagrams
the scope window view, in which declarations are stored in a nested structure
corresponding to conventional subroutine nesting
the forms window, in which the appearance of I/O can be designed using a
WYSIWYG editor, free of the distractions of data processing specifications.
A protoype of HyperPascal has been implemented, and a number of programs developed using it.
Paul Lyons for the extensive proof-reading undertaken, and guidance given in the production of this thesis.
Thanks also go to my friends; those at Massey, and those outside, for supporting me in my time at Massey and providing a welcome distraction from research when needed. Particular thanks must go to Tracey Murrell for understanding the occasional intrusion of work in my private life, and seeing me through the high and low points of my post-graduate study.
John Grundy, John Hosking, and the Department of Computer Science at Auckland University are thanked for allowing the use of the MViews framework.
The financial assistance of Massey University is also gratefully acknowledged.
My biggest thank you goes to my family; my sister Debbie, and especially my parents Bonnie, and Robert for the support and love they have always provided.
This thesis is dedicated to my family.
1.2. Statement of Thesis ... 3
1.3. Project History ... 3
2. Related Research ... 5
2.1. Visual Programming ... 5
Visual Environments ... 5
Visual Languages ... 8
2.2. Visual Programming Languages ... 9
Arguments For and Against Visual Programming ... 11
Comparison between Visual Programming Languages ... 13
Appropriateness of Visual Language Notations ... 14
2.3. Domain-specific Visual Programming Languages ... 15
G/LabView ... 16
HI-VISUAL ... 18
Comparison of G/Lab View and HI-VISUAL ... 20
2.4. General-purpose Visual Programming Languages ... 21
Pict/D ... 21
Prograph ... 23
Comparison of Pict/D and Pro graph ... 26
2.5. Learning to Program ... 27
Differences Between Novices and Experts ... 27
Helping Novices Become Experts ... 28
Supporting Expert Programmers ... 29
2.6. Summary ... 29
3. HyperProgramming ... ... 31
3.1. The Nature of Software ... 31
The Multi-dimensional Abstract Representation ... 31
Concrete Representations of Software ... 32
A Non-Linear Concrete Representation of Programs ... 33
3.2. HyperPrograms ... 34
3.3. Discussion of HyperPrograrnrning ... 36
4. HyperPascal. ... 39
4.1. The Visual HyperPrograrnrning Language ... 39
4.2. The Scope Tree ... 41
Program Units ... 42
Declarations ... 43
The Unit Calling Area ... 47
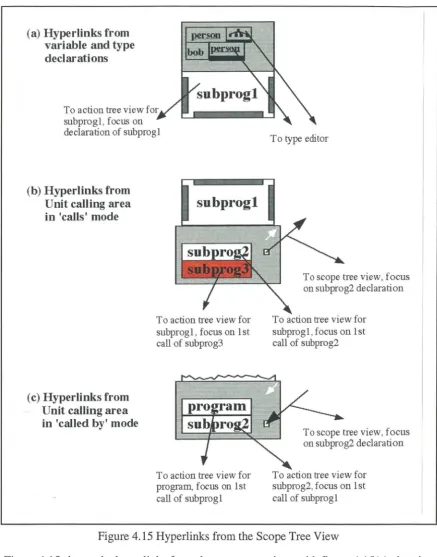
Hyperlinks from the Scope Tree View ... 48
4.3. The Action Tree ... 50
Structure Charts ... 50
The HyperPascal Structure Diagran1 Notation ... 51
Comments ... 52
Expressions ... 56
Invoking Subprograms ... 59
Withs ... 60
Choices ... 61
Loops ... 63
Hyperlinks from the Action Tree ... 66
4.4. Forms Windows ... 68
Hyperlinks from the Forms Windows ... 71
4.5. Editing HyperPascal Programs ... 72
Creating and Arranging Program Components ... 72
Editing Subprogram Declarations ... 74
Editing Comments ... 77
Editing Action Sequences ... 78
Editing Expressions ... 79
Editing Forms Windows ... 81
Editing Withs ... 82
Editing Choices ... 82
Editing Loops ... 84
5. The Implementation ... 87
5.1. MViews ... 87
Overview ... 88
Inside MViews ... 88
5.2. The Prototype Version of HyperPascal ... 90
5.3. Inside the HyperPascal Prototype ... 92
The Base View and Program Parsing ... 93
The Display Views ... 99
5.4. Experimentation with HyperPascal ... 105
6. Conclusions ... 111
6.1. The Conclusions ... 111
Classification of HyperPascal.. ... 113
6.3. Suggested Future Work ... 114
The Complete Implementation of HyperPascal ... 114
Development of HyperPascal for Teaching ... 114
A Run-time Environment ... 114
A General Alternative to the Forms Window View ... 115
A Further Investigation of the State Tree View ... 115
The Structure Traversal Icon ... 115
Alternative Views of a HyperProgram ... 115
i References ... 1 Jl 7 Appendix A ... 123
media by punched cards. Early direct control computers have been successively replaced by batch-mode mainframes, interactive single-user and multi-user mainframes, stand-alone micro's and networked systems. Output devices have changed from memory-mapped rows of lights through line printers to high resolution colour screens and laser printers. One development in particular has influenced the style of modern interfaces more than all the others. This is the direct manipulation graphical user interface, which combines mouse input, high resolution graphics monitor and multiple-window data presentation.
Most applications produced today make use extensive use of graphical user interfaces and direct manipulation. Many applications also allow users to input information visually, or produce graphical output. This trend towards graphical user interfaces and direct manipulation has, however, progressed more slowly in some areas than in others. An area exhibiting this slow progression is that of computer programming.
In the early stages of computer development, programmers were the only direct users of computers. As computers became more widespread and easier to use, another class of user, the end user, started to appear. These relatively naive users became the driving force behind human-computer interaction, and new interaction styles were developed to make applications more "user-friendly". Interaction styles in the programming process were largely ignored at this stage because programmers were considered experts at using computers, and therefore did not need them to be "user-friendly". Development in the programming process instead concentrated on increasing the power of high level languages, in order to increase productivity and satisfy the user demand.
Of course, this concentration was not total. Early work on syntax-directed editors, for example GED (Moretti and Lyons, 1986), has been incorporated into present program development systems. Most such systems perform enough parsing-on-the-fly to provide comparatively simple aids such as pretty-printing, detection of malformed expressions, and so on. However, the underlying nature of the languages they deal with is unchanged. The languages still use a single-dimensional stream of text to represent complex algorithms and data-structures. Perhaps this should not surprise us. Linearity pervades the computing milieu: we store data in sequentially addressed memory; we squeeze data through the ALU to process it. Little wonder, then, that our compilers are sequence-oriented, and that the languages they deal with are too.
conventional textual language has mitigated against their use. Now however, high-resolution graphics, processor power and memory are now available cheaply enough to render two-dimensional visual programming languages viable.
What is so attractive about a visual language that we are willing to expend this extra effort? There are several benefits:
• Relationships are two-dimensional
Relationships between components of a complex systems are rarely simple enough to be expressed in a simple linear fashion; more often we find that responsibilities, communication, and division of tasks require a network if they are to be properly described.
• Diagrams can use mnemonic shapes
At least in systems with simple vocabularies, the shapes of diagrammatic components can be imbued with mnemonic significance - arrows to represent direction of flow are a ubiquitous example of this - and the significance is assimilated subconsciously.
• Partitioning is natural in diagrams
A two dimensional surface gives a designer more freedom to partition a complex system, and to use physical proximity or separation to indicate similarity or difference between its components.
• Vocabularies can be easily distinguished
Most complex systems have to be specified in more than one domain -programs, for example, involve algorithms and data structures. It is possible to design a visual language to emphasise the similarities and differences between the different domains. Thus, by associating a distinctive window-type with the current domain, for example, the user can be subliminally cued to employ the correct vocabulary for the current part of the design.
These benefits have been incorporated into a number of Visual Programming Languages (Shu, 1986), some of which will be examined in more detail later. For now, let it suffice that most of these languages are ways of visualising programs. This is an inherently flawed approach to visual programming, as it works backwards from a naturally sequential representation to a two- ( or more) dimensional representation. The present work has proceeded from the basis that the object of the visualisation should be, not the program, but the programmer's mental model of the solution to a problem.
1.1. Project Aim
This work aims to test the validity of this idea of using a multi-dimensional physical representation to represent the programmer's mental model. It combines techniques from the Visual Programming Languages programming paradigm and the hypermedia navigation support systems. The result has been the design of a hyperprogramming
language HyperPascal, and the implementation of a prototype integrated program development environment for HyperPascal.
Note that there has been no attempt to introduce new programming functionality with HyperPascal, and that even the diagrams are not particularly revolutionary. The originality of the work is associated with the multi-dimensionality of the representation, and the use of hyper-techniques for navigating through the multi-dimensional space.
1.2. Statement of Thesis
We can summarise the above arguments thus:
In writing a computer program, a programmer devotes much effort to developing a mapping from a complex multi-dimensional mental model of the problem solution onto a physical representation which is sufficiently simple and syntactically rigorous for a
computer to interpret. It is possible to use modern interface technology and processor speeds to support a closer match between these two representations than is available in conventional programming languages, both textual and visual. An appropriate representation would allow:
• •
•
•
••
•a multi-dimensional representation of programs .
multiple views with minimal interaction (storage of identical information in more than one view).
where interaction is unavoidable, editing of the shared information via a
single mechanism, identical in the different views.
easy transitions between views .
automatic updating of information shared between different views .
subliminal clues to the nature of the current view .
maximum support for navigation within the representation .
1.3. Project History
In this description, the progress of the research has been split into separate phases. In the research proper, these phases were not strictly separate, but are described this way to better show an overview of the research.
reviewed from the areas of visual programming, human-computer interaction, software engineering, and software comprehension. A number of visual programming languages were also compared. This review identified several areas where visual programming languages were deficient in the representation of a programmer's mental model.
The field of hypermedia was identified as representing documents in a multi-dimensional manner, and techniques from the field were adapted for use in representing computer programs (a program represented multi-dimensionally is termed a hyperprogram).
A general purpose visual programming language, HyperPascal (Hyper- hyperprogram, Pascal - based on Pascal semantics), that used a multi-dimensional representation, was designed as a "testbed" language to test the validity of hyperprogramming ideas. A number of different views onto the program structure were identified, and first-draft notations developed for each view. During this phase the notation was most fluid: various alternative formulations were experimented with, and a consistent notation finally emerged.
To support both novice and expert programmer interaction, a number of different interaction techniques were incorporated into the design of HyperPascal, and the programming components modified to better utilise these techniques, while also ensuring that they remained consistent.
A subsidiary goal was to make HyperPascal simple for novices to learn. To facilitate this, the syntactic load was reduced by reducing the number of different programming components. This reduction in the number of component types was performed by generalising similar components into a single, specialisable, consistent component. The generalisation of the programming components also allowed a compaction of the notation, and provided generalised components that are powerful enough for use by expert programmers.
Visual Programming is a very general term which is used to describe different ways to use graphics in programming. Shu (1986) divides the area into two general sub-areas,
Visual Environments and Visual Languages.
Visual Environments
Shu defines Visual Environments as " ... the incorporation of graphical techniques in a software environment that supports the program or system development.", and splits this broad area into three categories, Visualisation of Data or Information, Visualisation of
Program and Execution, and Visualisation of System Design.
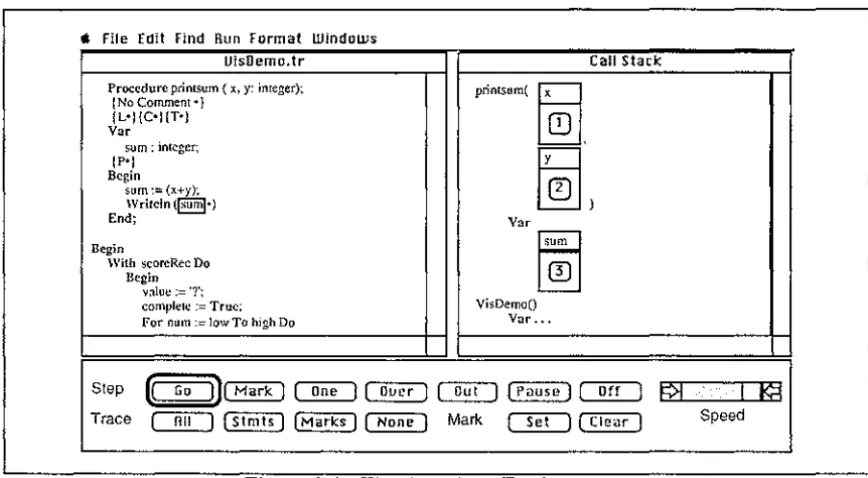
A Visual Environment can be placed in the Visualisation of Data or Information category if it presents data or information in a graphical form. These environmets are most often used to support program debugging. Amethyst (Myers, Chandhok, and Sereen, 1988) is an integrated environment which allows the editing of Pascal programs, dynamic visualisation of selected data structures in the program, and allows the user to trace through the execution of the program to observe changes in the data. This allows users to "see" what is happening to the data in the program, and helps them locate errors. Figure 2.1 (after Myers et al., 1988) shows the appearance of the Amethyst screen while viewing the values of x, y, and sum.
ti File Edit Find Hun Format Windows
UisDemo.tr Call Stack
Procedure printsum ( x, y: integer); printsum(
~.
( No Comment •)(L•}(C•}(T•) Var
sum : integer;
~ ) (P•}
Begin sum:= (x+y); Writcln(§§j•)
End; Var
Begin
15~1
With scoreRec DoBegin value:='?';
complete := True; VisDemo() For num := low To high Do Var ..•
Step (QD][Mark) ~~ ~ [ P a u s e ) ~ ~€/t+','i:,,:,',,tj ~ Trace
OTI::J
( Stmts ) ( M a r k s ) ~ Mark ~ [ C l e a r ) Speed [image:12.600.85.519.525.764.2]A Visual Environment can be placed in the Visualisation of Program and Execution category if it allows static and/or dynamic (run-time) visualisation of a program. This visualisation of a program can help the user to better comprehend the structure of a program. An example of an environment which allows both static and dynamic visualisation of a program is PECAN (Reiss,1985). PECAN allows a program to be visualised statically as a structured flow graph, and edited using a syntax-directed editor. Dynamic program visualisation is provided by highlighting the statement currently executing in both the structured flow graph, and the syntax directed editor. PECAN can also be placed in the Visualisation of Data or Information category because the data structures present in a program can be presented in a graphical form. Figure 2.2 shows the flowchart representation of a program in Pecan, with the currently executing node hilighted.
Figure 2.2. The Flowchart Representation of a Program in Pecan
configuration is not as expressive as the (textual) specification language, and doesn't show the physical location of modules, or the module parameters. Figure 2.3. shows a Conic system configuration for a hospital ward monitoring system.
alarm alarm I bed3
bedl
bed bedlnurse
bed4bed5
alarm alarm2 alarm3
bed2
bed bed2 alarm4alarm5
Figure 2.3. A System Configuration in Conic
Figure 2.4 categorises the three visual environments already mentioned, as well as Zeus (Brown,1991), Balsa-II (Brown,1988), Incense (Myers,1983), PV (Brown, Carling, Herot, Kramlich, and Souza, 1985), TPM (Eisenstadt and Brayshaw,1990), and C2 (Kopache and Glinert,1988). These environments are now described very briefly.
Zeus Amethyst Balsa-II
Incense Visualisation of Data or Information PECAN - - - . . .
TPM
c2
Visualisation ofProgram and Execution
Figure 2.4 Categorisation of some Visual Environments
Incense is designed to visualise data structures in a Pascal-like language called Mesa, and
allows the data structures to be viewed while debugging the program.
Zeus and Balsa-II are similar systems for visualising algorithms through graphical animation. Through their use of multiple views, they can visualise (by animation) many algorithms simultaneously, thus facilitating comparisons between the methods and the speeds of the competing algorithms.
PV is a system that allows the visualisation of both the high level modular structure of a system, and (by simple animation) the data structures and algorithms.
stepped through, and also allows fast-forwarding to a particular clause. The notation used is an augmented And/Or tree.
c2 is a system which allows the graphical visualisation and (limited) manipulation of programs written in a subset of the C language. C2 represents programs with a
BLOX-type notation (Glinert, 1990), in which program components fit together like pieces of a jigsaw puzzle, but C2 does not store the graphical representation between runs.
We now turn from the more general category of visual programming environments, in which the emphasis is on the use of direct manipulation and visualisation to support program development, to the category of visual languages, in which the emphasis is on manipulating visual information, or programming using visual expression.
Visual Languages
Shu ( 1986)defines three categories of visual language, those for supporting visual interaction, those for programming with visual expressions, and those for processing visual information. Chang (1987) generalises this classification scheme by positioning languages in a two-dimensional space, which allows him to divide the third of these classifications, languages for processing visual information, into visual information processing languages, and iconic visual information processing languages.
The first dimension of the classification space, which Chang calls visibility, is the type of syntax used for specifying the transformations of data objects dealt with by the language. A syntax may be linear ( data transformations are strung together in one dimension) or visual (data transformations may be interconnected in some more complex arrangement). The second dimension of the space defines the type of object, which Chang describes as a generalised icon, manipulated by the language. Generalised icons have two component parts, a meaning and a visual representation, and languages are classified either as (meaning, image') - these manipulate objects that have a logical meaning and an imposed visual representation, or as (meaning', image) - these impose a meaning on naturally visual information 1.
An example of a (meaning, image') generalised icon is the folder icon in the Macintosh user interface. The folder icon corresponds to a logical item in the directory structure of
generalised icon could be a physical image such as (possibly in an
image database) having the logical meaningface imposed on it.
The classification of visual languages in Chang's two dimensional space is shown in figure 2.5.
Related Research Linearly represented constructs VJSually represented constructs
Visual objects with imposed logical
representation (meaning', image)
Languages that support visual
interaction
Visual Programming
Languages
Logical objects with imposed visual representation (meaning, image') Visual Information Processing Languages Iconic Visual Information Processing Languages
Figure 2.5. Classification of Visual Languages
9
Languages that support visual interaction (linear construct, (meaning, image')) are linear (usually textual) languages that support visual interaction with logical objects. An example of a language that supports visual interaction is DAL (Anderson get reference), which supports the textual specification of dialogs and interaction in the user interface.
Visual programming languages (visual construct, (meaning, image')) are considered in detail in Section 2.2.
Visual information processing languages (linear construct, (meaning', image)) are languages that manipulate naturally visual information using linear (usually textual) constructs. Examples of visual information processing languages include augmented (for querying pictorial databases) conventional query languages such as ISQL (Assman, Venema, Hahne, 1986) and PSQL (Roussopoulos, Leifker, 1984), and image processing languages such as VIPS (Bailey and Hodgson, 1988).
Iconic visual information processing languages (visual construct, (meaning', image)) are languages that manipulate naturally visual information using visual constructs. Examples of this type of language include HI-VISUAL'86 (Hirikawa, Monden, Yoshimoto, Tanaka, and Ichikawa, 1986), OpShop (Ngan, 1991), Cantata (Williams and Rashure, 1990), and VPL (Lau-Kee, Billyard, Faichney, Kozato, Otto, Smith, Wilkinson, 1991).
We now discuss visual programming languages (visual construct, (meaning, image')) in detail.
2.2. Visual Programming Languages
merely decorative. Myers(l 986) is of the emphatic opinion that the representation of programs in a visual programming language must not be restricted to a single dimension.
Research into visual programming and visual programming languages has focused on more powerful ways of programming, learning to program, and facilitating end-user programming.
The area of visual programming languages has been subdivided differently by different authors.
Shu(l988) recognises three classes of visual programming language(s); Diagrammatic
systems combine existing diagram notations and executable code to make programs easier to comprehend, document and maintain. Iconic systems, where icons or graphical symbols play a central role in programming2. Table- and form-based systems use a fill-in form, or table, to specify programs.
Shu's classification of visual programming languages into three areas based on the extent of ( or approach to using) graphics in a language, is complicated by the fact that some languages such as FPL (Cunniff, Taylor, and Black, 1986) and Prograph (Cox, Giles, and Pietrzykowski, 1989) are on the boundary between diagrammatic systems and iconic systems. An arbitrary decision therefore has to be made as to their classification (Shu classifies FPL (based on flowcharts) as diagrammatic, and Prograph (based on dataflow diagrams) as iconic).
Ambler and Burnett (1989) subdivide the area of visual programming languages into two categories; Visually Transformed Languages emphasise the specification and comprehension of programs using existing language paradigms. Naturally Visual
Languages are an attempt to develop new programming paradi.gms3 whose natural
expression is visual, and which may not have a strictly textual equivalent. An example of a programming paradigm whose expression is naturally visual is
programming-by-demonstration, where the user's actions when demonstrating a process are recorded and mapped directly to a program. ThinkPad (Rubin, Golin, Reiss, 1985) is an example of a language that uses programming-by-demonstration to produce data structure manipulation
programs in Prolog. ·
We assert that it is more appropriate to divide the area of visual programming languages on the basis of the area of application of the language. This would enable languages designed for a similar purpose to be placed in the same class. V./ e identify two broad areas for the classification of visual programming languages; Domain-specific visual programming languages are languages designed specifically for use in one area of application. General-purpose visual programming languages are languages designed to
for use in a wide application area. ·
A breakdown of the areas of visual programming, visual languages, and visual programming languages is shown in figure 2.6.
2Korfhage and Korfhage(l 986) use a more formal definition of Iconic Languages based on a four layered language model. The first layer of this model is the iconography (the set of possible icons), and the second is the syntax for combining these icons into statements and commands. The last two layers are functional mappings, with the third layer being the semantics of the statements and commands, and the fourth being a pragmatic layer that determines whether a particular command or statement makes sense in a given environment.
Visual Programming
Visual Environments
~
\ls. of Data \ls. of \ls. of or Program and System Jnformatio n Execution Design
VJSual Languages
Languages that Visual \lsual Iconic Visual support visual Progranmng Infomntion Infonnation interaction Languages Processing Processing
Dmmin Specific Visual Programning
Languages
Languages Languages
General Purpose Visual Programring
Languages
Figure 2.6. A Breakdown of Visual Programming
Arguments For and Against Visual Programming.
Shu(l988) lists four premises as stimulating the use of graphical representations and pictures in the programming process. These premises are: pictures aid understanding and remembering; pictures provide an incentive for learning to program; well designed pictures are understood by people regardless of what language they speak; and pictures are more powerful than words as a means of communication.
Shu's first premise, that pictures aid understanding and remembering, is justified by research into cognitive psychology (Rohr(l986) and Scanlan(l989)), which has shown the use of appropriate pictures and diagrams can aid both the understanding, and recall, of information.
The second premise, that pictures provide an incentive for learning to program has been demonstrated in an empirical study performed by Glinert and Tanimoto (1984), using the Pict visual programming system. Glinert introduced 65 computer science students to the system, had them attempt to write a number of simple programs, then fill out a questionnaire. A summary of the results showed that a large majority of the participants found the system "fun to use" as compared to normal (textual) programming, and that a majority of students would react favourably if asked to participate in another Pict session.
The premise that pictures can be understood regardless of language is supported by the wide, and successful, use of pictures for providing information in situations where language-independent communication is needed (Wood, Wood, 1990). Examples of pictures used in these situations (such as in airports, and on road signs) are shown in Figure 2.7.
When explaining complex ideas, people frequently use diagrams or pictures to aid communication. This use of pictures for representing complex information would imply that pictures are a powerful means of communication, and the old saying "a picture is worth a thousand words" would bear this out. Raeder (1985) identifies 8 ways in which pictures are superior to text as a means of communication:
1/ Random vs. sequential access.
The eyes provide instant access to any part of a picture.
2/ Dimensions of expression.
Pictures provide many more dimensions in which to encode information.
3/ Transfer rate.
Pictures generally transfer information faster than text.
4/ Concrete vs. abstract.
Pictures of real-world objects can be used to illustrate abstract ideas.
5/ Pictures without names.
Pictures can be referenced by pointing (Direct manipulation).
6/ Real-world pictures.
Pictures reflect the real world, whereas text only points to the real world.
7 / Animated Pictures.
Pictures are dynamic and can be animated, whereas text is static.
8/ Metaphorically rich pictures.
Information which is undesirable can be encoded to appear unpleasant.
We assert that a ninth point may be added to this list:
9/ Visual Discrimination.
Pictures aid discrimination between objects and relationships.
Other authors have argued against the use of visual programming.
Brooks (1987) tells us that "Nothing even convincing, much less exciting has yet emerged from such efforts [research into visual programming] ... I am persuaded that nothing will". Although Brooks centres his arguments mainly around the use of flowcharts as a visual programming notation, he (and others) have raised a number of general arguments against visual programming.
Software is invisible and, because of its structural complexity, it is also inherently unvisualisable (Brooks, 1987). Brooks also states that this invisibility is undesirable because it hinders understanding and communication of information about software. In this argument, Brooks is talking about the visualisation of existing software systems (using paper-based techiques), not the use of visual programming to implement future systems. Visual programming languages can be used to enforce structure on a software system, and because their representation is visual, the resulting software structures will be inherently visualisable.
Tanimoto, 1984), and facilitating end-user computing (Hirikawa et al, 1986). The challenge is to make them useful to people such as computer professionals, who are comfortable with traditional methods of programming.
The "computer professionals" argument has two parts. First, it suggests that today's computer professionals won't accept visual languages, because, being easier to use, they remove much of the mystery of the programers craft. For many people, this argument may be correct, though it says more about human nature than it does about visual programming languages.
Secondly, it suggests that visual languages will never be as good as textual languages for the sorts of programs computer professionals write. Certainly, there are areas in which textual representations are superior to visual ones (arithmetic expressions, for example). Even today, however, there are areas in which visual representations are superior to textual ones, such as the design of programs for massively parallel, or distributed architectures. Computer professionals may feel most comfortable with languages that combine visual and textual representations.
Visual programming languages use screen space inefficiently (Edel,1988). This is often
the case, but visual programming is not always less efficient in the use of screen space (Ichikawa and Hirikawa (1990), and Lyons, Simmons, and Apperley (1993)). Screen use by a visual programming language is often a trade-off between the space used, and program comprehensibility. Visual languages do have an advantage when using multiple views, because they allow different parts of a program (that could be widely separated in a textual representation) to be viewed at the same time. Visual languages also allow the placement of conceptually related constructs close to each other.
Comparison between Visual Programming Languages
Traditional (textual) programming languages can be compared using a measure of the level of the language, and the scope of applicability of the language.
The level of a language is a measure of the amount of detail the programmer must provide in order for a task to be completed. For instance, if, to achieve a particular goal, more detailed information must be provided using language A than necessary using language B, then language A is of a lower level than language B.
The scope of applicability of a language refers to how wide a range of applications the language can produce. A language such as C is very general in the types of application it can produce, whereas a language such as Cobol is more specific in its application area (Cobol can not, for example, easily perform complex mathematical manipulations). The C programming language therefore has a wider scope of applicability than Cobol.
Shu ( 1986) compares visual programming languages by adding the dimension of extent
of visual expression to these two dimensions of language comparison. Visual expression
is defined by Shu as "the meaningful visual representations (for example, icons, graphs, diagrams, pictures) used as language components to achieve the purpose of programming".
Visual Extent Visual Extent
high
Profile of Hypothetical Language
low
J---1► Scope specific general
Level Level
(a) (b)
Figure 2.8 The Profile of a Visual Programming Language
While a wide scope and a high level are generally considered desirable for programming languages, Shu ( 1986) states that a high visual extent is not necessarily desirable for a visual programming language, and that effectiveness of visual expression could be a better dimension. The reason for this is that extensive use of, or inappropriate, diagrams may confuse the user. However, the effectiveness of visual expression is an even more subjective measure than visual extent.
Glinert (1989) proposes a metric for assessing visual programming languages that considers a number of dimensions which have been identified as "good" attributes of visual languages and visual displays, such as the use of animation (Graf, 1990), colour (Reynolds(1987) and Travis(1991)), and sound (Gaver, 1989).
Glinert's metric assesses a visual programming environment on how accessible it is to the novice, and how appealing it is to the expert user. A visual programming environment is assessed in terms of 5 aspects; the overall system characteristics, the programming environment, the flow of data from machine to user, and the speed of performance. Each of these aspects is given a coefficient of satisfaction which is used to calculate the
coefficient of environmental attraction H(E), and the Coefficient of environmental repulsion l(E) for that environment. For the environment to be accessible to the novice, the coefficient of environmental attraction must be maximised, and to be appealing to the expert, the coefficient of environmental repulsion must be minimised.
The three-dimensional coordinate system proposed by Shu ( 1986) can be obtained from the metric proposed by Glinert (1989) as a special case where only three major aspects are considered, each consisting of a single relevant dimension. Neither of the profiling and/or assessment approaches discussed takes into account the effectiveness of visual expression of the language (as suggested by Shu (1986)).
Appropriateness of Visual Language Notations
visual presentation", and "Shift to another presentation mode (usually text) as soon as appropriate". In addition to this question of when to shift to the use of text, there is also the question of which visual notation is most effective and appropriate.
Fitter and Green (1979) suggest five principles that are requirements for a good computer language notation. These principles are: give the user relevant information; restrict the user to the use of "good" structures; redundantly re-code important
information; clearly represent the underlying processes; and make the notation easily
modifiable ( revisability ). These principles are now discussed in more detail.
The information encoded perceptually (visually) instead of textually should be relevant to the user. The relevance of the information encoded depends on the task being performed by the user. If a task requires an understanding of structure, then structural information should be encoded visually. Likewise, for a task requiring an understanding of sequence, sequence information would be the most relevant to encode visually.
It is suggested that the user should be restricted to the use of "good" programming constructs only. A "good" programming construct is one which allows hierarchical decomposition of a program (such as single entry - single exit components in a language designed for procedural programming). This allows the "divide and conquer" approach to be used, but usually results in an increase in the number of program components ( and therefore screen space).
Redundant re-coding usually occurs where information (such as a program) is presented both in pictorial form, and textual form. The information presented in pictorial form (e.g. program structure) can be found from the symbolic form (the program text), and so is redundant. Redundant re-coding is related to the issue of relevance, where the redundantly re-coded information should be relevant to the user's task.
The underlying processes must be clearly represented by the notation in order to give the user some idea of what the program is doing (providing a conceptual window). This
allows the user to build a conceptual model of the underlying processes, which is very beneficial when teaching novices to program (Mayer, 1988).
The final principle suggested is that a program represented in the notation should be able to be changed easily. This ease of revisability allows a user to correct errors or extend the program easily.
These principles are summed up by Fitter and Green(l979) in stating that "different programs should be perceptually as different as possible". If placed in an imaginary perceptual space, the distance between programs (their perceptual difference) should be proportional to the conceptual difference between them.
Many visual programming languages have been implemented using differing notations and paradigms. These languages can be placed into two categories depending on their range of application. Those designed for a specific area of application are termed
Domain-specific, and those designed for a general range of applicability are termed General-purpose.
2.3. Domain-specific Visual Programming
Languages
G/LabView
LabView (Kodosky, MacCrisken, Rymar, 1991) is a visual programming language used for automating the collection of data from laboratory instruments, and for analysis of this data.
The Lab View system uses the idea of virtual instruments. A virtual instrument is a hierarchy of modules which have interactive front panel interfaces, and block diagram programs. The definition of a simple Scale Number virtual instrument is shown in Figure 2.9(adapted from Hils (1992)).
10
1.0
.5
0
-.5
-1.0
Input Value
1110 11 Scaling Factor
11s Output
(a) Front Panel
11
Input Value (-1,1)
j
1.000
2.000 t -1234
Scaling Factor s
(b) Block Diagram
Figure 2.9 The Definition of a simple Virtual Instrument in G/LabView (Hils,1992) Front panels (Figure 2.9(a)) can contain input and output data, sliders, knobs, meters, strip-charts, and x-y graphs. These items are used to graphically show the inputs and outputs to and from the corresponding block diagram program, and are constructed using a front panel editor. The use of front panels by Lab View is a simple and effective way of specifying a user interface.
Block diagram programs (Figure 2.9(b)) are developed in LabView using a visual programming language called G. The rectangular icons in figure 2.9(b) correspond either to constants (such as
I
1.000I ),
or to inputs and outputs (simple fill-in inputs such asI
[
1234II,
or to sliders such asI
~
I).
The triangular icons ([?>,
B>•
and[3:>)
are primitive mathematical transformations, and the bracketed numbers associated with the connecting arcs show the range of values possible on that arc.The control structures in G have an outline shape which is used to contain the sub-diagram being controlled. Data is passed to and from the sub-sub-diagrams via tunnels, which are arcs that pass through the enclosing shape of the control construct, connecting the sub-diagram enclosed to external nodes. Figure 2.10 ( adapted from Kodosky et al, 1991) shows the block diagram for a frequency response virtual instrument, that uses the for-loop control construct.
om
High (Hz)
om
Low (Hz)
[ill±]
Increment (Hz)Ramp
t - r t - - - ; H z
"llV1l"UV'll'I IVV\IVVV\ 'VVV'
. - - - - ! A m p
}
Amplitude (\blts)
. _ _ _ ... FGen
~ V 1--Hi'H--!Y(X)
Bil ~ x
DVM XYGraph
Transfer Function
I
l""'\r-/Figure 2.10 Frequency Response Virtual Instrument Diagram (Kodosky et al, 1991)
The for-loop shown in figure 2.10 executes the contained diagram a specific number of times. The number of times the sub-diagram is to execute is set to the number of items present in the indexed type (in this case, an array) used as input (it is also possible to set
the number of iterations by placing the number on an arc connected to the
IE)
terminal).The
IT)
terminal is the source of a token whose value is a count of how many iterations have taken place. The complete set of G control structures are shown in Figure 2.11 (adapted from Kodosky et al, 1991).N
[TI
[Q]
(a) For Loop (b) While Loop (c) Case ( d) Sequence
Figure 2.11 Control Structures in Structured Dataflow Diagrams (Kodosky et al, 1991)
The while-loop (Figure 2.ll(b)) executes the sub-diagram contained using the inputs currently on the input tunnels, and the sub-diagram produces a boolean token on the arc
connected to the
10
I
terminal. If the sub-diagram completes with the boolean token set to false, the loop terminates, and the values present on its output tunnels are propagated along their arcs. If the sub-diagram completes with a true value, the sub-diagram is executed again using the same values on the input tunnels, and overwriting the tokens onThe case (Figure 2.1 l(c)) contains a number of sub-diagrams overlayed on each other. Each of these sub-diagrams has a numeric label, and is visible when the viewing selector
([[[]fl) shows the appropriate number. A particular sub-diagram is executed when all of the input tunnels have values on them, and the tl] terminal has the value of the sub-diagram's label.
The sequence (Figure 2.1 l(d)) also contains overlayed sub-diagrams which are viewed
the same way as those contained by the case. When the input tunnels have values on them, the sub-diagrams execute sequentially, in the order specified by their labels (low to high).
G allows hierarchical decomposition of modules by the association of a virtual instrument with an icon. An icon can then be used in place of the virtual instrument definition, in the same way subroutines are used in traditional textual languages. The LabView system also includes a large library of pre-defined modules for use as terminal nodes in
diagrams. The purpose of these terminal nodes range from simple mathematical
operations (such as the addition, multiplication and division nodes in Figure 2.9), to modules that interface to physical instruments (such as the digital voltmeter, and frequency generator in Figure 2.10).
The G/LabView notation is concise and visually expressive when specifying the high
level control of scientific instruments, and the analysis of the resulting data. The use of structured dataflow diagram control constructs also allows the graphical specification of algorithms that would be cumbersome (or impossible) to specify with pure dataflow. However, a problem does arise with space usage and visual complexity when the notation is used to describe even simple mathematical equations, such as the one
presented in Figure 2.9(b) ( input+ 1 x s
➔
output ). This suggests that structured2
dataflow is good for representing high level abstractions of a program, but isn't
appropriate for low level use such as specifying equations.
HI-VISUAL
HI-VISUAL is a high level iconic visual programming language that was originally developed for use in image processing (Hirikawa, Monden, Yoshimoto, Tanaka, Ichikawa, 1986). HI-VISUAL has since been applied to the domain of office work (Hirikawa, Tanaka, Ichikawa, 1990), and the system interface changed (Hirikawa, Yoshimi, Tanaka, Ichikawa, 1989) so that actions are performed (and recorded as a program) by overlapping icons (Hirikawa, Nishimura, Kado, Ichikawa, 1991). This system, HI-VISUAL'89, will be referred to as HI-VISUAL in the following discussion.
HI-VISUAL uses icons to represent real-world objects (such as sales books, and a calculator), and established concepts in the application domain (such as departments, and companies). It does not, however, use icons to represent functions. Functions are represented by using the hand pointer to overlap two or more icons in the HI-VISUAL interface which is shown in Figure 2.12 (Hirikawa et al, 1989).
The function represented by the overlapping of icons depends not only on the icons, but
also on the spatial arrangement of the overlapping. An particular icon can either be active
calculated, and an icon representing a list of totals will be produced as a result ( as shown in Figure 2.13(a)).
Figure 2.12 The User Interface of HI-VISUAL (Hirikawa et al, 1989)
•••• • • • • • Sales • • • • • • • • • Book • • • • • • • • • c:::::J • • •
•
•- □□CD
□□CD
BBEB
(a) (b)
Figure 2.13 Icon Overlapping in HI-VISUAL (after Hirikawa et al, 1989)
It is possible for an overlapping of icons to be ambiguous. Overlapping the drawing kit icon and the totalled sales icon as shown in Figure 2. l 3(b) could be interpreted either as
Draw a pie chart that breaks down last months sales by product, or Draw a bar graph comparing total monthly sales over the last year. In an ambiguous situation like this, the
user must choose one of the possible interpretations.
When more than two icons are overlapped, two types of icon behaviour are possible. The case where more than one passive icon is present in an overlapping is termed a plural data type, and the case where more than one active icon is present is termed a restriction
Sale1s 11 Sales B001c::::1Book
□ mo om □
BEBB
(a) Plural Data type (b) Restriction type
Figure 2.14 Multiple Icon Overlapping in HI-VISUAL ( after Hirikawa et al, 1991)
In a plural data overlapping, the active icon acts on all of the passive icons overlapped. In the example shown in Figure 2.14(a), where a calculator is overlapped on two sales books, both sales books would be totalled.
A restriction overlapping is used to restrict the active icon to a limited type of behaviour. The example shown in Figure 2.14(b) shows a pencil and a ruler both overlapped on a piece of paper. Overlapping a pencil on a piece of paper selects a draw action, but is
ambiguous because there may be many draw actions possible. Overlapping the ruler on the paper as well, places a restriction on the draw actions possible, and in this case removes the ambiguity and selects the draw-table action (Hirikawa et al, 1991).
A program can be registered with the secretary (pictured at top-left in Figure 2.12) by specifying a start scene, an end scene, icon(s) used as input, and the icon(s) to be output. This program is then invoked by overlapping the input icon(s) on the secretary icon. The output icons will be produced as a result.
HI-VISUAL is a very high level language that uses icon overlapping to perform actions in programming. These overlappings cause executable modules (which are written in a conventional programming language) to be invoked by the system. The problem with this is that, to implement behaviour even slightly different from that put in place by the system designers, a knowledge of traditional programming methods is needed.
Comparison of G/labView and HI-VISUAL
When comparing visual languages using Shu's (1986) profiling framework, three dimensions need to be considered: the language's level; the language's scope; and the language's visual extent. G/LabView and HI-VISUAL are compared below using these three dimensions.
The level of a language is an inverse measure of how much detail must be specified by the user in order to perform an action. HI-VISUAL is of a very high level because an action is typically performed by simply overlapping two or more icons. G/LabView, in comparison, is of a lower level because more information (a structured dataflow diagram) is needed to perform an action.
The scope of a language is a measure of how wide the area of application for the language is. HI-VISUAL has a narrow scope, due mainly to its high level and the inflexibility of the underlying executable modules (they cannot be changed easily). G/LabView, in comparison, has a wider scope of applicability because its actions can be defined more flexibly (due to the lower level of the language).
G/Lab View has a lower level of visual extent than HI-VISUAL because text is needed for the identification of the input and output variables.
The three dimensional profile of G/Lab View and HI-VISUAL is shown in Figure 2.15. Note that while the three dimensional profiles can be used to compare the individual aspects of the languages, the overall size or shape of the profile cannot be used to judge which is the 'better' language overall.
Visual Extent
Le\el
?---J► S rope
JI>
G/LabViewI>
HI-VISUALFigure 2.15 Three Dimensional Profile of G/Lab View and HI-VISUAL
2.4. General-purpose Visual Programming
Languages
A general-purpose visual programming language is one that is designed for use in a range of application areas. Two general-purpose visual languages are described, then compared in this section, using Shu's profiling approach (Shu, 1986).
Pict/D
Pict/D (Glinert and Tanimoto, 1984) is a flowchart-based visual programming language, designed for general-purpose programming but, because of its limitations, used mainly as an aid for teaching programming concepts to novices.
(Red, Green, Blue, and Orange) per (sub)program. These variables are represented in the flowcharts by coloured blocks. The Pict/D flowchart and equivalent Pascal code for a
simple iterative addition function are shown in Figure 2.16 (after Glinert and Tanimoto, 1984).
+
■
. ,
-1-■
(a) Pict program
lype SixDigits=O .. 999999;
function Red(Green, Blue: SixDigits): SixDigits;
var Orange: SixDigits;
begin
if Blue > Green then begin
Orange : = Blue; Blue :
=
Green;Green := Orange;
end;
Red:=0;
while Blue>() do begin
Red:= Red+ Green;
Blue:= Blue -1;
end; end;
(b) Pascal Program
Figure 2.16 A Pict/D Function for Iterative Addition (after Glinert and Tanimoto, 1984)
In a Pict/D program the flow of control starts at the
~
icon, and follows the arrowed paths around the rest of the flowchart. When a conditional branching is reached, thecondition is evaluated and, if evaluating to true, the branch coloured green is taken, otherwise the red branch is taken. Loops can be created by branching the flow of control back to a conditional icon, resulting in a circular flow. This circular flow continues until
the branch without the circular flow is taken, or the fir~ish of the flowchart (the
1
8
1
icon)is reached. ·
Subprograms are created in Pict/D by associating an icon with a flowchart. The icon
specifies the variables the subprogram uses for input, for returning a result, and for local
variables. Subprograms in Pict/D can call themselves, so recursive programs can be
created.
Pict/D programs are limited mainly to simple matherr~atical manipulations, with the most
limiting factor of Pict/D being its complete reliance on graphical representations.
Representing variables with coloured blocks is not a:? descriptive to the user as a textual
name, and restricts the number of possible variables excessively. Allowing only one manipulation (such as assigning one variable to another) per icon means that, unless parts
of the overall manipulation are grouped into subprog:rams, valuable screen space can be taken up with simple variable manipulations, or• functions. The association of a subprogram with an icon also raises problems when trying to design meaningful icons
for subprograms, as some actions have a meaning not easily represented by an icon. This is demonstrated by Glinert and Tanimoto (1984) when designing the icon to represent a subprogram that calculates a Fibonacci sequence. The "icon" designed simply contains the abbreviation "Fib".
Prograph
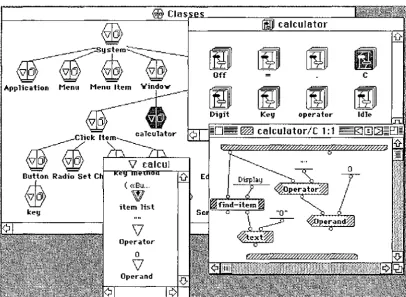
Prograph (Cox, Giles, and Pietrzykowski, 1989) is an object-oriented dataflow-based visual programming language, designed for general-purpose use.
The object-oriented programming paradigm (see Budd(l991)) makes use of objects, which are encapsulations of data, and the actions performed on that data. An object is an instance of a class, where a class is a description of the data types and actions shared by a group of similar objects. The data values of an object are called its attributes, and the actions defined for an object are called its methods. Classes can be formed into
inheritance hierarchies, where classes inherit attributes and methods from those higher in
the hierarchy.
Prograph programs are constructed by first defining their classes in the class hierarchy.
The two components of
@,
the class icon, represent the classes attributes and methods. Opening the left half of a class icon takes the user to the definition of the attributes, which allows the user to view and modify attribute names and default values, or to add new attributes. Opening the right half shows the user the methods defined in the class (but not those inherited). Opening a method will then allow the user to view and modify the method definition in the Prograph dataflow notation. The Prograph user interface is shown in Figure 2.17.@Clas
©
[fili] calculator@©i~
Off CApplication Menu Menu Item
Yindo,..-[fJJ
Digit Key operator Idle,:} E ( «Bu ...
w
l::ey item list
V
Operator 0
V
[image:30.599.100.506.430.727.2]Operand
The Prograph dataflow notation consists of icons with different shapes and names, joined together with arcs. Arcs terminate at inputs and outputs, which are shown by small circles called roots. A number of different shaped icons, and their meanings are shown
in Figure 2.18.
Operation
Input
Output
Simple
Constant
Match
Get Attribute
Set Attribute
Sample Call
~
~~$~~
256
0NtJ'LLEJ
a
e
Action
Copy value from terminal of calling operation
Copy value to root of calling operation
Call the Quicksort rrethod
Output constant 256 on root
Next case if value on root is not NULL
Output value of attribute "key" of input instance on right root, aid the instance itself on the left root
For instance on left root, set the vane of attribute "number" to the value on the right root, and output
Figure 2.18 Prograph Icons ( excerpt from Cox et al, 1989)
Conditionals and iteration are difficult to represent with pure dataflow notations. In Pro graph, a method consists of one or more cases. When a method is executed, its first
WJ
sort 1 :2J
[image:32.599.174.426.379.611.2]"Bubb l'=" Sor...
0
Figure 2.19 A Conditional in Prograph
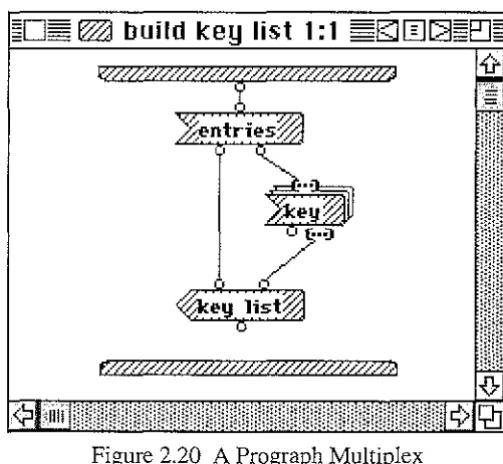
Iteration is provided in Prograph with the use of multiplexes. A multiplex iterates
through a list, performing an action on all or some of the items in the list. An example of a multiplex is shown in Figure 2.20. In this example, firstly the value of the "entries" attribute of an object is found. This list is then iterated through, finding the value of the "key" attribute of each of the objects in the "entries" list. These values are then assembled into a list, and stored in the "key list" attribute of the original object.
~□§
WJ
build key list 1: 1 ~gJ[IJ[]~eJ~~
·:.·::::;.;::.·::.·::.·::::·:.·:::::.·::.·::·.·;·;·.·:::.·: *
Q]
Figure 2.20 A Prograph MultiplexPrograph is a powerful general-purpose visual programming language and is possibly the most widely used. Prograph's object-oriented nature allows the use of many pre-defined classes and methods in the user interface, while its dataflow notation copes well with both conditionals and iteration.
. h . . 1 h . fi 2 9(b) input + l
representmg t e equat10n prev10us y s own m 1gure . , - - - - x s ➔ output. 2
This again illustrates the inefficient use of space resulting from graphical dataflow notations being used at low levels.
~ scale 1 :1
:,,:.::-_-::,'..::_,_<·.,.·.·>F·:.Y>Y.:.+.}:J.,:·:·>
~C2J
A Simple Mathematical Equation in Prograph
Comparison of Pict/D and Prograph
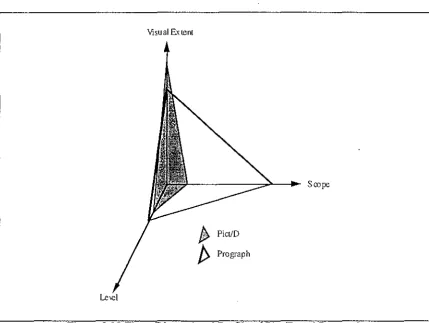
When comparing visual languages using Shu's (1986) profiling framework, three
dimensions need to be considered: the language level; the language scope; and the visual
extent of the language. Pict/D and Prograph are compared below using these three
dimensions.
Pict/D and Prograph are both algorithmic, but Prograph is of a higher level because it
allows iteration to be handled at a higher level of abstraction, and conditionals with more than two alternatives.
Pict/D has a narrow scope (limited mainly to simple mathematical manipulations), due mainly to its complete reliance on graphical representations, and the limitation to one data type. These restrictions mean that programs and subprograms are limited to using a maximum of four variables (including input and output parameters), each of which is a six digit non-negative integer. Prograph, in comparison, has a much wider scope of applicability because it allows the user to declare many variables (objects) of user-defined types (classes). This, combined with the inheritance hierarchy of system classes, allows
a wide range of applications to be produced.
The visual extent of a visual language is a measure of how great a part graphical
representations play in the programming process. Pict/D has a very high visual extent because it is completely reliant on graphical representations. This reliance extends to both
The three dimensional profile of Pict/D and Prograph is shown in Figure 2.22.
Visual Extent
[image:34.599.88.518.92.415.2]Le\e]
Figure 2.22 Three Dimensional Profile of Pict/D and Prograph
In general, Prograph is a more powerful language than Pict/D but, because of its complexity, it would be more difficult to teach to novice programmers. Pict/D however, while being easy to teach to novices (Glinert and Tanimoto, 1984), uses a flowchart notation that may emphasise 'bad' programming practices (such as the use of the goto statement). Issues dealing with how novices learn to program are dealt with in Section 2.5.
2.5. Learning to Program
One of the issues stimulating the development of visual programming languages is the desire to help novices learn to program. In this section, we examine the differences between novice and expert programmers, and how novice programmers can be helped to become experts.
Differences Between Novices and Experts
Mayer (1988) identifies four areas of difference between novice and expe1i programmers. These are the areas of syntactic knowledge, semantic knowledge, schematic knowledge, and strategic knowledge.
Semantic knowledge is the knowledge of the underlying concepts involved in programming. The semantic knowledge of a system is often referred to as a mental
model. Findings by Goodwin and Santani ( 1986) suggest that expert programmers, when compared to novices, have a more accurate and complete mental model of programming concepts.
Schematic knowledge is the ability to recognise the function of common software structures. Wiedenbeck (1985) suggests that experts recognise common "chunks" of code as having a particular function, and therefore can be treated as a single unit. This allows expert programmers to program at a higher ("chunk") level, rather than the statement level common amongst novices.
Strategic knowledge is the ability to organise program units in order to solve problems. Mayer ( 1988) suggests that expert programmers are more likely than novices to decompose problems into smaller parts, and better comprehend the abstract goals of a program.
Fix, Wiedenbeck, and Scholtz (1993) have compared the mental representation of programs between novice programmers and experts, and found five characteristics that were present in the experts' representation, but not in novices'. These characteristics are:
It is hierarchical and multi-layered;
It contains explicit mappings between high and low levels; It is founded on the recognition of basic patterns;
It is well connected internally;
It is well grounded in the program text.
Learning to program is a transition from novice to expert, so a good programming language for novices should support novices in the areas where they are deficient, as well as helping them to attain the attributes typical of experts.
Helping Novices Become Experts
Visual programming languages can be suitable for supporting novices because they can sidestep many of the problems associated with traditional programming languages. Many visual programming languages avoid the complex syntax typical of textual languages (by using simple graphical representations), thus decreasing the amount of syntactic knowledge required by the programmer. The use of direct manipulation, rather than typing, can also minimise the confusing effect of spelling mistakes.
Human beings are good at recognising visual patterns and thus recurring "chunks" of code should be inherently easier to recognise in a visual programming language than they are in a textual one. This can compensate for the novices' lack of schematic knowledge.
Visual programming languages can be used to explicitly show information about programs that novices find hard to conceptualise with their incomplete mental model. Fix
et al. (1993) identified a number of tasks that novices find significantly more difficult than experts. These tasks include: matching procedures with the procedures they call; matching variable names to the procedures in which they occur; listing the names used for the same data object in different program units; and filling in the names of program units with a skeleton outline of the program. A visual programming language could provide this information graphically, thereby increasing program comprehensibility for novice programmers.