Open Access
Research
A microarray-based system for the simultaneous analysis of single
nucleotide polymorphisms in human genes involved in the
metabolism of anti-malarial drugs
Eva Maria Hodel
†1, Serej D Ley
†1,4, Weihong Qi
1,5, Frédéric Ariey
2,
Blaise Genton
1,3and Hans-Peter Beck*
1Address: 1Swiss Tropical Institute, Socinstrasse 57, PO Box, 4002 Basel, Switzerland, 2Institut Pasteur in Cambodia, Phnom Penh, Cambodia, 3Department of Ambulatory Care and Community Medicine, University of Lausanne, Lausanne, Switzerland, 4Papua New Guinea Institute of
Medical Research, Goroka, Papua New Guinea and 5Functional Genomics Center Zurich, Zurich, Switzerland
Email: Eva Maria Hodel - [email protected]; Serej D Ley - [email protected]; Weihong Qi - [email protected]; Frédéric Ariey - [email protected]; Blaise Genton - [email protected]; Hans-Peter Beck* - [email protected] * Corresponding author †Equal contributors
Abstract
Background: In order to provide a cost-effective tool to analyse pharmacogenetic markers in malaria treatment, DNA microarray technology was compared with sequencing of polymerase chain reaction (PCR) fragments to detect single nucleotide polymorphisms (SNPs) in a larger number of samples.
Methods: The microarray was developed to affordably generate SNP data of genes encoding the human cytochrome P450 enzyme family (CYP) and N-acetyltransferase-2 (NAT2) involved in anti-malarial drug metabolisms and with known polymorphisms, i.e. CYP2A6, CYP2B6, CYP2C8, CYP2C9,
CYP2C19, CYP2D6, CYP3A4, CYP3A5, and NAT2.
Results: For some SNPs, i.e. CYP2A6*2, CYP2B6*5, CYP2C8*3, CYP2C9*3/*5, CYP2C19*3,
CYP2D6*4 and NAT2*6/*7/*14, agreement between both techniques ranged from substantial to almost perfect (kappa index between 0.61 and 1.00), whilst for other SNPs a large variability from slight to substantial agreement (kappa index between 0.39 and 1.00) was found, e.g. CYP2D6*17
(2850C>T), CYP3A4*1B and CYP3A5*3.
Conclusion: The major limit of the microarray technology for this purpose was lack of robustness and with a large number of missing data or with incorrect specificity.
Background
Drug action depends on how drugs are metabolized and differences in activity of metabolizing enzymes can signif-icantly contribute to the efficacy of drugs [1,2]. This might also be true for drugs given to treat malaria. The objective was to analyse single nucleotide polymorphisms (SNPs) in genes encoding enzymes implicated in metabolizing
anti-malarial drugs in order to determine the contribution of these enzymes to the pharmacokinetics of the specific drugs. There are many methods available for the detection of SNPs (for review see [3,4]). These methods are either based on allele-specific hybridization or on primer exten-sion reaction. Many of these techniques are time consum-ing, expensive and/or not suitable for use in resource-poor
Published: 9 December 2009
Malaria Journal 2009, 8:285 doi:10.1186/1475-2875-8-285
Received: 21 August 2009 Accepted: 9 December 2009
This article is available from: http://www.malariajournal.com/content/8/1/285 © 2009 Hodel et al; licensee BioMed Central Ltd.
Page 2 of 9 countries. Previously, a cost-effective DNA
microarray-based [5] technique to detect SNPs associated with drug resistance in malaria parasites in a larger sample size has been developed and successfully used. To test whether this system also could be used for SNP determination in metabolizing enzyme genes, microarray determined SNPs were compared with sequencing. For this, a microarray was developed to affordably generate SNP data on genes encoding the human cytochrome P450 enzyme family (CYP) and N-acetyltransferase-2 (NAT2) involved in anti-malarial drug metabolisms. The performance of this microarray had to be determined subsequently. The microarray was designed to analyse enzyme genes with known polymorphisms such as CYP2A6 and CYP2B6 for the artemisinins, CYP2C8 for amodiaquine, chloroquine and dapsone, CYP2C9 and NAT2 for dapsone and sul-phamethoxazole, CYP2C19 for dapsone and proguanil, CYP2D6 for chloroquine and halofantrine, CYP3A4 for the artemisinins, chloroquine, dapsone, halofantrine, lumefantrine, mefloquine, primaquine and quinine, and CYP3A5 for artemether, β-arteether, chloroquine, meflo-quine, quinine and sulphadoxine [6-29]. For certain anti-malarial drugs (piperaquine, pyrimethamine and pyron-aridine) the metabolic pathway is yet not well known, while others (atovaquone and doxycycline) are barely metabolized at all [30-35].
Methods
Study population
During an in vivo drug efficacy study in patients with uncomplicated malaria of all age, venous blood samples (anticoagulated using EDTA) were obtained after informed consent from 125 patients in Northern and Western Cambodia (64 in 2007 at Phnom Dék Health Centre, Rovieng district, Preah Vihear province, and 61 in 2008 at Pramoy Health Centre, Veal Veng district, Pursat province) and 149 patients in Central Tanzania (in 2008 at Kibaoni Health Centre, Kilombero district, Morogoro region).
Sequencing
Genomic DNA was extracted from 200 μl whole blood using the QIAamp 96 DNA Blood Kit (QIAGEN GmbH, Germany) according to the manufacturer's instructions.
Target sequences in cyp and nat2 genes of these samples were amplified using PCR. The PCR primers used are listed in Table 1. The amplified regions contained SNPs which are known to alter the function of enzymes involved in the metabolism of anti-malarial drugs (for tar-get loci and effect of the SNP see Table 1). The PCR master mix contained 1 × reaction buffer B (Solis BioDyne, Esto-nia), 1 × solution S (Solis BioDyne, EstoEsto-nia), 10 μM of each primer in 1 × Tris-EDTA (see Table 1, Operon Bio-technologies GmbH, Germany), MgCl2 (according to
Table 1, Solis BioDyne, Estonia), 2 mM of each dNTP in Tris-HCl 10 mM, pH 7.4 (GE Healthcare, Switzerland) and 2 U FIREPol DNA polymerase (Solis BioDyne, Esto-nia). 1 μl of extracted DNA was mixed with 24 μl of PCR master mix. The PCR protocol was 3 min at 96°C fol-lowed by 40 cycles (30 sec at 96°C, 1 min 30 sec at 56-64°C according to Table 1 and 1 min 30 sec at 72°C) with a final elongation for 10 min at 72°C. PCR products were purified and sequenced by Macrogen (Macrogen Ltd., Korea). ABI Prism AutoAssembler version 1.4.0 (Applied Biosystems) was used for assembly and analysis of sequences. The genotype of each patient was then assessed visually. Aliquots of the same PCR products were used for primer extension and microarray analysis.
Patient selection for DNA microarray validation
Of 274 patients from Cambodia and Tanzania, 96 were selected (i.e. to fit 96-well plate) for validation of the microarray. Samples were selected by the number of suc-cessfully sequenced SNPs and then their ID number. For all 96 selected samples at least 16 out of 18 SNPs have been successfully sequenced.
Extension control and elimination of non-incorporated nucleotides
As extension control for the microarray, amplified nested PCR product from the Plasmodium falciparum chloroquine resistance transporter gene (pfcrt) from strains 3D7 (wildtype at loci pfcrt76 and pfcrt97) and K1 (mutation at locus pfcrt76 and wild-type at pfcrt97) were mixed at a ratio of 55%:45%. Primers and PCR conditions have been described elsewhere [5].
To eliminate non-incorporated nucleotides prior to primer extension, all nested PCR products of one blood sample were pooled and 10 μl of the pooled PCR products and 0.5 μl of the extension control mix were digested with 8 U shrimp alkaline phosphatase (SAP) and 4 μl 10 × SAP buffer (both Amersham Biosciences, Freiburg, Germany) in a reaction volume of 48 μl for 1 h at 37°C. SAP was inactivated by incubating samples for 15 min at 90°C.
Primer extension and denaturation
μl of 10 × Reaction Buffer C (Solis BioDyne, Estonia), 2.5 mM MgCl2, and 0.625 μM of the corresponding Cy3- and Cy5-labeled ddNTPs (Perkin Elmer, Schwerzenbach, Swit-zerland); ddNTP mixes are listed in Table 3. Then, 12 μl SAP digested PCR product of each patient were mixed with 8 μl of the extension mix I, II or III, respectively. The following primer extension protocol was used: 1 min at 94°C followed by 40 cycles of 10 sec at 94°C followed by
[image:3.612.53.555.117.597.2]40 sec at 50°C. The three mixes of each patient were then pooled again in a 96 well plate and mixed with 10 μl of the hybridization buffer. The hybridization buffer con-tained 37.5 μM EDTA pH 8.0, 7 pM of two differently labelled positive hybridization controls 5'-GCCTCCACG-CACGTTGTGATATGTA- [Cy3]-3' and 5'- CTGTGACAGAG CCAACACGCAGTCT- [Cy5]-5' (Operon Biotechnologies GmbH, Germany), and 3% sodium dodecyl sulphate
Table 1: Primers used to amplify target sequences in cytochromes P450 isoenzymes and N-acetyltransferase 2 genes, MgCl2 [μl] for the master mix and annealing temperature [°C] used to amplify target sequence in cytochromes P450 isoenzyme genes and N -acetyltransferase 2 genes.
SNP primer Sequence MgCl2 [μl] T [°C]
CYP2A6*2 (479T>A, L160H) forward reverse
5'-TCTCTCTCTCTACCTCGACAT-3'
5'-GTTCCTCGTCCTGGGTGTT-3'
3 64
CYP2B6*5 (1459C>T, R487C) forward reverse
5'-CCAGAAGACATCGATCTGAC-3'
5'-TCTCTCAGAGGCAGGAAGTT-3'
2 64
CYP2B6*6 (516G>T, Q172H) forward reverse
5'-TGAGTGATGGCAGACAATCACA-3'
5'-CAAGTTGAGCATCTTCAGGAACT-3'
2 64
CYP2C8*3 (416G>A, R139K) forward reverse
5'-CTAAAGGACTTGGTAGGTGCA-3'
5'-CAGGATGCGCAATGAAGACC-3'
2 64
CYP2C9*3/*5 (1075A>C, I359L/1080C>G, D360E) forward reverse
5'-CTGGTTTATGGCAGTTACACATT-3'
5'-GAGAAAGTCCAGTTAAACTGCC-3'
2 64
CYP2C19*3 (636G>A, W212X) forward reverse
5'-GGGAATTCATAGGTAAGATATTA-3'
5'-GGAGTGATATAAGCACGCTTTG-3'
2 64
CYP2D6*4 (1846G>A, splicing defect) forward reverse
5'-CCGCCTTCGCCAACCACT-3'
5'-CCCTGCAGAGACTCCTCGGT-3'
2 64
CYP2D6*10 (100C>T, P34S) forward reverse
5'-CCCATTTGGTAGTGAGGCAGGT-3'
5'-CCCCTTCTCAGCCTGGCTTCTTG-3'
2 64
CYP2D6*10 (4180G>C, S486T) forward reverse
5'-AGCCACCATGGTGTCTTTGCT-3'
5'-TTGCCCTGAGGAGGATGATC-3'
2 64
CYP2D6*17 (1023C>T, T107I) forward reverse
5'-CGCGAGGCGCTGGTGACCAA-3'
5'-CCAGCTCGGACTACGGTCATCAC-3'
2 64
CYP2D6*17 (2850C>T, R296C) forward reverse
5'-GACTCTGTACCTCCTATCCACGTCA-3'
5'-TCCCTCGGCCCCTGCACTGTTT-3'
2 64
CYP3A4*1B (-392A>G) forward reverse
5'-CTCACCTCTGTTCAGGGAAAC-3'
5'-ATGGCCAAGTCTGGGATGAG-3'
2 64
CYP3A5*3 (6986A>G, splicing defect) forward reverse
5'-TGGAGAGTGGCATAGGAGATAC-3'
5'-CCATACCCCTAGTTGTACGACACA-3'
2.5 64
NAT2*5/*6/*7/*14
(341T>C, I114T/590G>A, R197Q/857G>A, G286E/ 191G>A, R64Q)
forward reverse
5'-GGGATCATGGACATTGAAGCATATT-3'
5'-ACGTGAGGGTAGAGAGGATATCTG-3'
2 64
Page 4 of 9 (SDS). The plate was incubated for 1 min at 94°C and
immediately chilled on ice for 2 min.
Microarray production and microarray hybridization
Aldehyde-activated ArrayIt® SuperAldehyde 2 glass slides with SuperMask™ 16 (EBN European Biotech Network, Dolembreux, Belgium) were used. Oligonucleotides (Operon Biotechnologies GmbH, Germany) correspond-ing to the antisense DNA of the extension primers, exten-sion controls (Table 2) and positive hybridization controls were spotted onto the microarrays in triplicate. The spotting was done by the DNA Array Facility of the Center for Integrative Genomics, University of Lausanne,
Switzerland, using solutions of 50 μM oligonucleotide in 180 mM phosphate buffer (pH 8.0). All oligonucleotides had a C7-aminolinker attached to the 3' end. Anchor gonucleotides prelabeled with Cy3 and Cy5 and four oli-gonucleotides with a random sequence were added as positive and negative controls, respectively. Of the pooled and denatured primer extension reaction mixture 35 μl were transferred to one well of the microarray, and 6 μl 20 × Standard Saline Citrate (SSC) were added. In each well, representing a single microarray, DNA from one patient was hybridized. Hybridization was carried out in a humid chamber at 50°C for 90 min. After hybridization, the slide was washed at room temperature in 2 × SSC with 0.2% SDS for 10 min, followed by a wash with 2 × SSC for 10 min, and a final wash with 2 × SSC plus 2% ethanol for 2 min. These three steps represent the first wash step. Slides were dried with compressed air.
Data acquisition
[image:4.612.57.559.99.336.2]Microarrays were scanned at 635 nm and 532 nm using an Axon 4100A fluorescence scanner (Bucher Biotec AG, Basel, Switzerland). After the first scan slides were washed and scanned again and after each wash, Cy3 and Cy5 images were acquired and analysed using the Axon Gene-Pix Pro software (version 6.0). An in house developed perl script based on Kestler's statistics module [36] was used to call SNPs based on probe signal intensities. The script cal-culates receiver operating characteristic (ROC) curves using signal intensity values from the set of positive and negative controls for each hybridization. Hybridization specific thresholds that maximize both sensitivity and specificity were then used to make SNP calls.
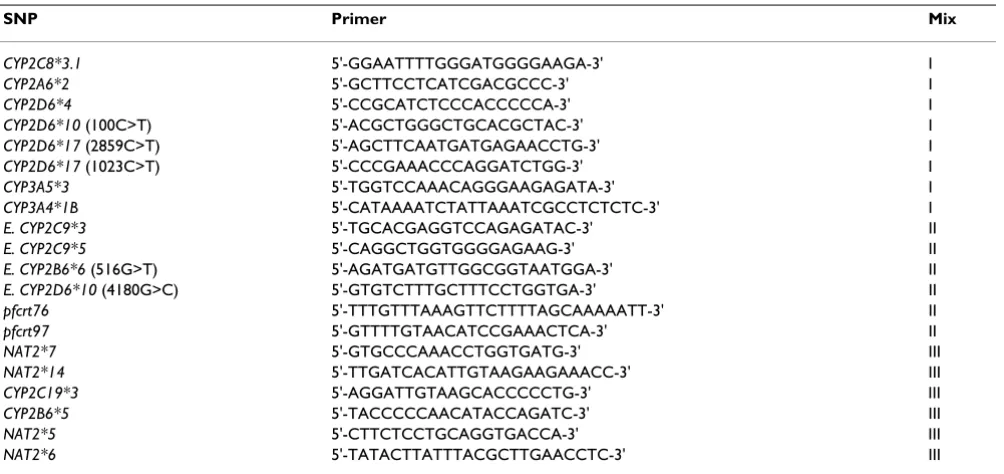
Table 2: Extension primers of three parallel mixes.
SNP Primer Mix
CYP2C8*3.1 5'-GGAATTTTGGGATGGGGAAGA-3' I
CYP2A6*2 5'-GCTTCCTCATCGACGCCC-3' I
CYP2D6*4 5'-CCGCATCTCCCACCCCCA-3' I
CYP2D6*10 (100C>T) 5'-ACGCTGGGCTGCACGCTAC-3' I
CYP2D6*17 (2859C>T) 5'-AGCTTCAATGATGAGAACCTG-3' I
CYP2D6*17 (1023C>T) 5'-CCCGAAACCCAGGATCTGG-3' I
CYP3A5*3 5'-TGGTCCAAACAGGGAAGAGATA-3' I
CYP3A4*1B 5'-CATAAAATCTATTAAATCGCCTCTCTC-3' I
E. CYP2C9*3 5'-TGCACGAGGTCCAGAGATAC-3' II
E. CYP2C9*5 5'-CAGGCTGGTGGGGAGAAG-3' II
E. CYP2B6*6 (516G>T) 5'-AGATGATGTTGGCGGTAATGGA-3' II
E. CYP2D6*10 (4180G>C) 5'-GTGTCTTTGCTTTCCTGGTGA-3' II
pfcrt76 5'-TTTGTTTAAAGTTCTTTTAGCAAAAATT-3' II
pfcrt97 5'-GTTTTGTAACATCCGAAACTCA-3' II
NAT2*7 5'-GTGCCCAAACCTGGTGATG-3' III
NAT2*14 5'-TTGATCACATTGTAAGAAGAAACC-3' III
CYP2C19*3 5'-AGGATTGTAAGCACCCCCTG-3' III
CYP2B6*5 5'-TACCCCCAACATACCAGATC-3' III
NAT2*5 5'-CTTCTCCTGCAGGTGACCA-3' III
NAT2*6 5'-TATACTTATTTACGCTTGAACCTC-3' III
Table 3: Labelled ddNTPs used for the three parallel extension mixes.
ddNTP and label Mix
ddATP Cy3 I
ddCTP Cy3 ddGTP Cy5 ddUTP Cy5
ddATP Cy5 II
ddCTP Cy3 ddGTP Cy5 ddUTP Cy3
ddATP Cy3 III
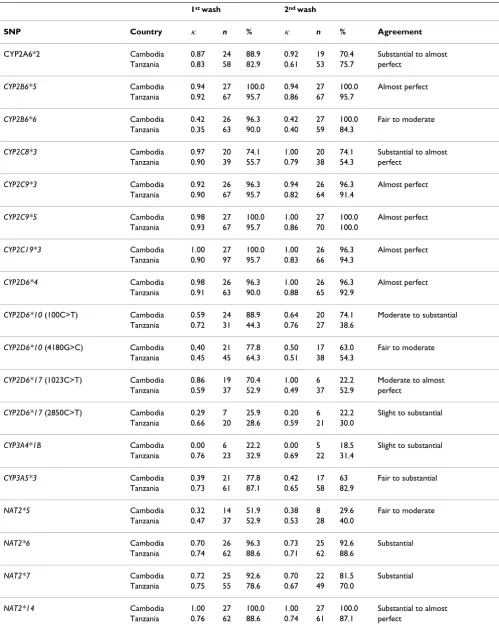
[image:4.612.56.296.552.729.2]Table 4: Comparison of SNP data acquired either by sequencing or DNA microarray technology.
1st wash 2nd wash
SNP Country κ n % κ n % Agreement
CYP2A6*2 Cambodia 0.87 24 88.9 0.92 19 70.4 Substantial to almost Tanzania 0.83 58 82.9 0.61 53 75.7 perfect
CYP2B6*5 Cambodia 0.94 27 100.0 0.94 27 100.0 Almost perfect Tanzania 0.92 67 95.7 0.86 67 95.7
CYP2B6*6 Cambodia 0.42 26 96.3 0.42 27 100.0 Fair to moderate Tanzania 0.35 63 90.0 0.40 59 84.3
CYP2C8*3 Cambodia 0.97 20 74.1 1.00 20 74.1 Substantial to almost Tanzania 0.90 39 55.7 0.79 38 54.3 perfect
CYP2C9*3 Cambodia 0.92 26 96.3 0.94 26 96.3 Almost perfect Tanzania 0.90 67 95.7 0.82 64 91.4
CYP2C9*5 Cambodia 0.98 27 100.0 1.00 27 100.0 Almost perfect Tanzania 0.93 67 95.7 0.86 70 100.0
CYP2C19*3 Cambodia 1.00 27 100.0 1.00 26 96.3 Almost perfect Tanzania 0.90 97 95.7 0.83 66 94.3
CYP2D6*4 Cambodia 0.98 26 96.3 1.00 26 96.3 Almost perfect Tanzania 0.91 63 90.0 0.88 65 92.9
CYP2D6*10 (100C>T) Cambodia 0.59 24 88.9 0.64 20 74.1 Moderate to substantial Tanzania 0.72 31 44.3 0.76 27 38.6
CYP2D6*10 (4180G>C) Cambodia 0,40 21 77.8 0.50 17 63.0 Fair to moderate Tanzania 0.45 45 64.3 0.51 38 54.3
CYP2D6*17 (1023C>T) Cambodia 0.86 19 70.4 1.00 6 22.2 Moderate to almost Tanzania 0.59 37 52.9 0.49 37 52.9 perfect
CYP2D6*17 (2850C>T) Cambodia 0.29 7 25.9 0.20 6 22.2 Slight to substantial Tanzania 0.66 20 28.6 0.59 21 30.0
CYP3A4*1B Cambodia 0.00 6 22.2 0.00 5 18.5 Slight to substantial Tanzania 0.76 23 32.9 0.69 22 31.4
CYP3A5*3 Cambodia 0.39 21 77.8 0.42 17 63 Fair to substantial Tanzania 0.73 61 87.1 0.65 58 82.9
NAT2*5 Cambodia 0.32 14 51.9 0.38 8 29.6 Fair to moderate Tanzania 0.47 37 52.9 0.53 28 40.0
NAT2*6 Cambodia 0.70 26 96.3 0.73 25 92.6 Substantial Tanzania 0.74 62 88.6 0.71 62 88.6
NAT2*7 Cambodia 0.72 25 92.6 0.70 22 81.5 Substantial Tanzania 0.75 55 78.6 0.67 49 70.0
NAT2*14 Cambodia 1.00 27 100.0 1.00 27 100.0 Substantial to almost Tanzania 0.76 62 88.6 0.74 61 87.1 perfect
Page 6 of 9
Data comparison
SNP data gathered from sequencing and from microarray analysis were compared. Kappa statistics was used as an approach to the evaluation of agreement for the categori-cal data obtained by the two methods. The kappa index was calculated from contingency tables as follows κ= ((a + b) × (a + c) + (c + d) × (b + d))/(a + b + c + d)2
The kappa index was interpreted based on the criteria of Landis and Koch [37]. Hardy-Weinberg equilibrium was tested using the chi-square Hardy-Weinberg equilibrium test calculator for bi-allelic markers of the Online Encyclo-pedia for Genetic Epidemiology studies [38].
Ethical approval
All the applied protocols were approved by the ethics committee of the two cantons of Basel (Ethikkommission beider Basel, EKBB) and the responsible local authorities (i.e. in Tanzania from the Institutional Review Board of the Ifakara Health Institute and the National Institute for Medical Research Review Board and in Cambodia from the National Ethics Committee for Health Research). Blood samples were collected following written informed consent in the respective local language (Khmer or Swa-hili) from the participants or their guardians.
Results
Agreement between results obtained from sequencing and from the microarray on 18 SNPs within eight cyp
isoen-zyme genes and nat2 genes from 26 Cambodian and 70 Tanzanian malaria patients was tested. The results are summarized in Table 4. For some SNPs agreement ranged from substantial to almost perfect, whilst for other SNPs a large variability from slight to substantial agreement was found.
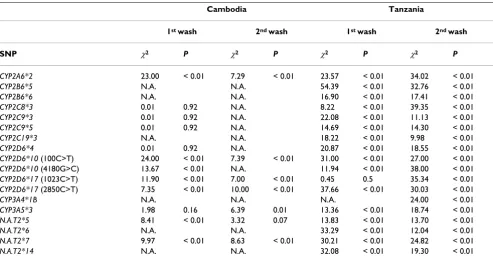
Where applicable, Chi-square Hardy-Weinberg equilib-rium tests for the allele frequencies acquired by the micro-array showed that most SNPs were significantly (P < 0.01) out of equilibrium (Table 5). Exceptions were CYP2D6*17 (1023C>T) (P = 0.50) for Tanzania after the 1st wash; CYP2C8*3 (P = 0.92), CYP2C9*3 (P = 0.92), CYP2C9*5 (P = 0.92), CYP2D6*4 (P = 0.92) and CYP3A5*3 (P = 0.16) after the 1st wash and CYP3A5*3 (P = 0.01) and NAT2 (P = 0.07) after the 2nd wash for Cam-bodia.
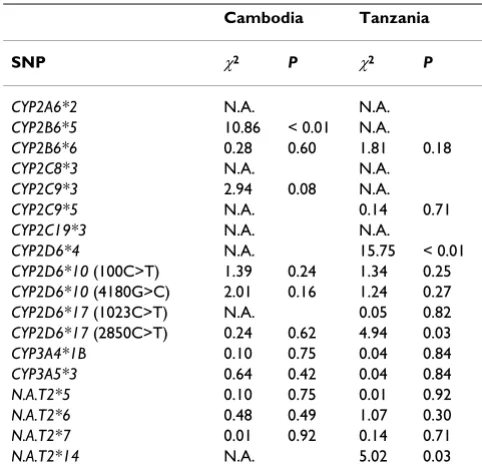
In contrast, most allele frequencies acquired by sequenc-ing were found to be in Hardy-Weinberg equilibrium (Table 6). However, in the Tanzanian study population CYP2B6*5 and CYP2D6*4 and in the Cambodian study population CYP2B6*5, CYP2C9*3, CYP2D6*10 (4180G>C), and CYP2D6*17 (2850C>T) were found not to have Hardy-Weinberg proportions.
Discussion
[image:6.612.59.552.449.710.2]Comparison of data generated by microarray analysis with sequencing showed that the performance of the DNA
Table 5: Chi-square Hardy-Weinberg equilibrium tests for SNP data acquired by DNA microarray technology.
Cambodia Tanzania
1st wash 2nd wash 1st wash 2nd wash
SNP χ2 P χ2 P χ2 P χ2 P
CYP2A6*2 23.00 < 0.01 7.29 < 0.01 23.57 < 0.01 34.02 < 0.01
CYP2B6*5 N.A. N.A. 54.39 < 0.01 32.76 < 0.01
CYP2B6*6 N.A. N.A. 16.90 < 0.01 17.41 < 0.01
CYP2C8*3 0.01 0.92 N.A. 8.22 < 0.01 39.35 < 0.01
CYP2C9*3 0.01 0.92 N.A. 22.08 < 0.01 11.13 < 0.01
CYP2C9*5 0.01 0.92 N.A. 14.69 < 0.01 14.30 < 0.01
CYP2C19*3 N.A. N.A. 18.22 < 0.01 9.98 < 0.01
CYP2D6*4 0.01 0.92 N.A. 20.87 < 0.01 18.55 < 0.01
CYP2D6*10 (100C>T) 24.00 < 0.01 7.39 < 0.01 31.00 < 0.01 27.00 < 0.01
CYP2D6*10 (4180G>C) 13.67 < 0.01 N.A. 11.94 < 0.01 38.00 < 0.01
CYP2D6*17 (1023C>T) 11.90 < 0.01 7.00 < 0.01 0.45 0.5 35.34 < 0.01
CYP2D6*17 (2850C>T) 7.35 < 0.01 10.00 < 0.01 37.66 < 0.01 30.03 < 0.01
CYP3A4*1B N.A. N.A. N.A. 24.00 < 0.01
CYP3A5*3 1.98 0.16 6.39 0.01 13.36 < 0.01 18.74 < 0.01
N.A.T2*5 8.41 < 0.01 3.32 0.07 13.83 < 0.01 13.70 < 0.01
N.A.T2*6 N.A. N.A. 33.29 < 0.01 12.04 < 0.01
N.A.T2*7 9.97 < 0.01 8.63 < 0.01 30.21 < 0.01 24.82 < 0.01
N.A.T2*14 N.A. N.A. 32.08 < 0.01 19.30 < 0.01
χ2 indicates the result from the Hardy-Weinberg equilibrium test, P the one-tailed P-value, and N.A. that Chi-square could not be calculated
microarray is limited. For some SNPs, i.e. CYP2A6*2, CYP2B6*5, CYP2C8*3, CYP2C9*3/*5, CYP2C19*3, CYP2D6*4 and NAT2*6/*7/*14, agreement ranged from substantial to almost perfect (kappa index between 0.61 and 1.00), whilst for other SNPs a large variability from slight to substantial agreement (kappa index between 0.39 and 1.00) was found, e.g. CYP2D6*17 (2850C>T), CYP3A4*1B and CYP3A5*3. No clear trend in rise or decline of agreement between methods was visible from the 1st to the 2nd wash of the slide and thus it remains ambiguous whether repeated washing improves the per-formance of the microarray. However, agreement tends to be lower among the Cambodian samples. A possible explanation is the strong dependence of kappa on true prevalence of the SNPs [39] and the dissimilar distribu-tion of the SNPs of interest in Cambodians and Tanza-nians [40]. Furthermore, among most of these SNPs a considerable number of patient samples failed to yield a signal on the microarray (e.g. CYP2D6*17 (2850C>T) and CYP CYP3A4*1B). The trend was clearly higher in samples from Tanzania, which might also be due to a lower quality of DNA arising from sub-optimal storage conditions after blood withdrawal. Sequencing data agreed with pub-lished reference sequences from public sources (Human Cytochrome P450 (CYP) Allele Nomenclature Committee [41]. The majority of samples genotyped by sequencing was found to be in Hardy-Weinberg equilibrium (excep-tions were CYP2B6*5 in Cambodians and CYP2D6*4 in Tanzanians), proving that sampling was unbiased. The cases where population data generated by microarray was found not to be in Hardy-Weinberg proportion could be attributed to the large number of patient samples that failed to yield a signal on the microarray resulting in smaller simple size.
Because cyps evolved out of a single ancestor [1,42], they show very close sequence similarities, which in turn makes it difficult to design gene specific primers, in partic-ular extension primers that have to be designed at a defined position. It, therefore, became almost impossible to develop a single multiplex PCR and thus the microarray method described here is time consuming and laborious. This is in contrast to a similar microarray developed for the analysis of drug resistance associated SNPs in P. falci-parum genes that permits the simultaneous analysis of many SNPs in hundreds of samples in a very short time period (approximately 15 h for four 96-well plates) with significantly reduced costs compared to other systems [5].
Furthermore, the costs of sequencing have decreased con-siderably during the last years and this trend may well continue. On the other hand, the costs of microarray rea-gents (especially Cy3- and Cy5-labeled ddNTPs that are used in three combinations) and glass slides for arraying have increased and are unlikely to decrease over time. So
the costs for the microarray technology are not considera-bly lower anymore and, therefore, overall costs of both methods have become comparable.
While SNP analysis microarray has been successfully used to analyse point mutations in drug resistance associated genes in Plasmodium [5,43], it seems to fail with closely related genes, such as the human cyp genes. For the latter, sequencing appears to be a more reliable method.
Conclusion
Although microarray allows the simultaneous determina-tion of many SNPs, the lack of robustness for the described approach here prohibits its wide use in pharma-cogenetics and sequencing occurs to be the more reliable technique. With the availability of large sequencing capac-ities worldwide, molecular-epidemiological studies using sequencing for a limited number of SNPs in CYP genes in a large population are feasible.
Abbreviations
[image:7.612.312.553.109.347.2]Cy: Cyanine; CYP: Cytochrome P450; ddNTP: Dideoxy-nucleotide; DNA: Deoxyribonucleic acid; dNTP: Deoxy-nucleotide; EDTA: Ethylenediaminetetraacetic acid; NAT2: N-acetyletransferase-2; PCR: Polymerase chain reaction; PFCRT: Plasmodium falciparum chloroquine resistance transporter; RFLP: Restriction fragment length polymorphism; ROC: Receiver operating characteristic; SAP: Shrimp alkaline phosphatise; SDS: Sodium dodecyl
Table 6: Chi-square Hardy-Weinberg equilibrium tests for SNP data acquired by sequencing.
Cambodia Tanzania
SNP χ2 P χ2 P
CYP2A6*2 N.A. N.A.
CYP2B6*5 10.86 < 0.01 N.A.
CYP2B6*6 0.28 0.60 1.81 0.18
CYP2C8*3 N.A. N.A.
CYP2C9*3 2.94 0.08 N.A.
CYP2C9*5 N.A. 0.14 0.71
CYP2C19*3 N.A. N.A.
CYP2D6*4 N.A. 15.75 < 0.01
CYP2D6*10 (100C>T) 1.39 0.24 1.34 0.25
CYP2D6*10 (4180G>C) 2.01 0.16 1.24 0.27
CYP2D6*17 (1023C>T) N.A. 0.05 0.82
CYP2D6*17 (2850C>T) 0.24 0.62 4.94 0.03
CYP3A4*1B 0.10 0.75 0.04 0.84
CYP3A5*3 0.64 0.42 0.04 0.84
N.A.T2*5 0.10 0.75 0.01 0.92
N.A.T2*6 0.48 0.49 1.07 0.30
N.A.T2*7 0.01 0.92 0.14 0.71
N.A.T2*14 N.A. 5.02 0.03
χ2 indicates the result from the Hardy-Weinberg equilibrium test, P
Page 8 of 9 sulphate; SNP: Single nucleotide polymorphism; SSC:
Standard saline citrate; TE: Tris-EDTA
Competing interests
The authors declare that they have no competing interests. Support for this work was provided by grant No 320000-112479 from the Swiss National Science Foundation.
Authors' contributions
EMH and SL were involved in microarray technology development and validation, data acquisition and analy-sis, and writing of the manuscript. WQ has developed the programme for the ROC analysis. FA was involved in the technology development. BG was involved in the overall pharmacogenetic project design and supervision. HPB was involved in the project design, technology develop-ment and in writing the manuscript
Acknowledgements
We would like to thank the patients who participated in the study and all the people involved in sample collection and we are grateful to the staff of the Center for Integrative Genomics in particular to Keith Hershman, Jérôme Thomas and Johann Weber for spotting the microarrays.
References
1. Ingelman-Sundberg M: The human genome project and novel aspects of cytochrome P450 research. Toxicol Appl Pharmacol
2005, 207(2 Suppl):52-56.
2. Ingelman-Sundberg M, Rodriguez-Antona C: Pharmacogenetics of drug-metabolizing enzymes: implications for a safer and more effective drug therapy. Philos Trans R Soc Lond B Biol Sci
2005, 360(1460):1563-1570.
3. Sobrino B, Brión M, Carracedo A: SNPs in forensic genetics: a review on SNP typing methodologies. Forensic Sci Int 2005,
154(2-3):181-94.
4. Sobrino B, Carracedo A: SNP typing in forensic genetics: a review. Methods Mol Biol 2005, 297:107-26.
5. Crameri A, Marfurt J, Mugittu K, Maire N, Regös A, Coppee J, Sis-meiro O, Burki R, Huber E, Laubscher D, Puijalon O, Genton B, Felger I, Beck HP: Rapid microarray-based method for moni-toring of all currently known single-nucleotide polymor-phisms associated with parasite resistance to antimalaria drugs. J Clin Microbiol 2007, 45(11):3685-3691.
6. Miller J, Trepanier L: Inhibition by atovaquone of CYP2C9-mediated sulphamethoxazole hydroxylamine formation. Eur J Clin Pharmacol 2002, 58(1):69-72.
7. Li X, Björkman A, Andersson T, Ridderström M, Masimirembwa C:
Amodiaquine clearance and its metabolism to N-desethyl-amodiaquine is mediated by CYP2C8: a new high affinity and turnover enzyme-specific probe substrate. J Pharmacol Exp Ther 2002, 300(2):399-407.
8. Khoo S, Back D, Winstanley P: The potential for interactions between antimalarial and antiretroviral drugs. AIDS 2005,
19(10):995-1005.
9. White N, van Vugt M, Ezzet F: Clinical pharmacokinetics and pharmacodynamics and pharmacodynamics of artemether-lumefantrine. Clin Pharmacokinet 1999, 37(2):105-125.
10. Svensson U, Ashton M: Identification of the human cytochrome P450 enzymes involved in the in vitro metabolism of artem-isinin. Br J Clin Pharmacol 1999, 48(4):528-535.
11. Giao P, de Vries P: Pharmacokinetic interactions of antimalar-ial agents. Clin Pharmacokinet 2001, 40(5):343-373.
12. Li X, Björkman A, Andersson T, Gustafsson L, Masimirembwa C:
Identification of human cytochrome P(450)s that metabolise anti-parasitic drugs and predictions of in vivo drug hepatic clearance from in vitro data. Eur J Clin Pharmacol 2003, 59(5-6):429-442.
13. Grace J, Aguilar A, Trotman K, Peggins J, Brewer T: Metabolism of beta-arteether to dihydroqinghaosu by human liver micro-somes and recombinant cytochrome P450. Drug Metab Dispos
1998, 26(4):313-317.
14. Projean D, Baune B, Farinotti R, Flinois J, Beaune P, Taburet A, Duc-harme J: In vitro metabolism of chloroquine: identification of CYP2C8, CYP3A4, and CYP2D6 as the main isoforms cata-lyzing N-desethylchloroquine formation. Drug Metab Dispos
2003, 31(6):748-754.
15. Kim K, Park J, Lee J, Lim S: Cytochrome P450 2C8 and CYP3A4/ 5 are involved in chloroquine metabolism in human liver microsomes. Arch Pharm Res 2003, 26(8):631-637.
16. Halliday R, Jones B, Smith D, Kitteringham N, Park B: An investiga-tion of the interacinvestiga-tion between halofantrine, CYP2D6 and CYP3A4: studies with human liver microsomes and heterol-ogous enzyme expression systems. Br J Clin Pharmacol 1995,
40(4):369-378.
17. Fontaine F, de Sousa G, Burcham P, Duchêne P, Rahmani R: Role of cytochrome P450 3A in the metabolism of mefloquine in
human and animal hepatocytes. Life Sci 2000,
66(22):2193-2212.
18. Ridtitid W, Wongnawa M, Mahatthanatrakul W, Raungsri N, Sun-bhanich M: Ketoconazole increases plasma concentrations of antimalarial mefloquine in healthy human volunteers. J Clin Pharm Ther 2005, 30(3):285-290.
19. Ridtitid W, Wongnawa M, Mahatthanatrakul W, Chaipol P, Sunbhan-ich M: Effect of rifampin on plasma concentrations of meflo-quine in healthy volunteers. J Pharm Pharmacol 2000,
52(10):1265-1269.
20. Kaneko A, Bergqvist Y, Taleo G, Kobayakawa T, Ishizaki T, Björkman A: Proguanil disposition and toxicity in malaria patients from Vanuatu with high frequencies of CYP2C19 mutations. Phar-macogenetics 1999, 9(3):317-326.
21. Skjelbo E, Mutabingwa T, Bygbjerg I, Nielsen K, Gram L, Brøosen K:
Chloroguanide metabolism in relation to the efficacy in malaria prophylaxis and the S-mephenytoin oxidation in Tanzanians. Clin Pharmacol Ther 1996, 59(3):304-311.
22. Mirghani R, Yasar U, Zheng T, Cook J, Gustafsson L, Tybring G, Eric-sson O: Enzyme kinetics for the formation of hydroxyqui-nine and three new metabolites of quihydroxyqui-nine in vitro; 3-hydroxylation by CYP3A4 is indeed the major metabolic pathway. Drug Metab Dispos 2002, 30(12):1368-1371.
23. Mirghani R, Hellgren U, Westerberg P, Ericsson O, Bertilsson L, Gus-tafsson L: The roles of cytochrome P450 3A4 and 1A2 in the 3-hydroxylation of quinine in vivo. Clin Pharmacol Ther 1999,
66(5):454-460.
24. Zhang H, Coville P, Walker R, Miners J, Birkett D, Wanwimolruk S:
Evidence for involvement of human CYP3A in the 3-hydrox-ylation of quinine. Br J Clin Pharmacol 1997, 43(3):245-252. 25. Barraviera B, Pereira P, Machado J, de Souza M, Lima C, Curi P,
Mendes R, Meira D: Isoniazid acetylating phenotype in patients with paracoccidioidomycosis and its relationship with serum sulfadoxin levels, glucose-6-phosphate dehydrogenase and glutathione reductase activities. Rev Soc Bras Med Trop
24(2):111-114.
26. Alfirevic A, Stalford A, Vilar F, Wilkins E, Park B, Pirmohamed M:
Slow acetylator phenotype and genotype in HIV-positive patients with sulphamethoxazole hypersensitivity. Br J Clin Pharmacol 2003, 55(2):158-165.
27. Daly A: Pharmacogenetics of the cytochromes P450. Curr Top Med Chem 2004, 4(16):1733-1744.
28. Gil J: Amodiaquine pharmacogenetics. Pharmacogenomics 2008,
9(10):1385-1390.
29. Mehlotra R, Henry-Halldin C, Zimmerman P: Application of phar-macogenomics to malaria: a holistic approach for successful chemotherapy. Pharmacogenomics 2009, 10(3):435-449. 30. Tarning J, Bergqvist Y, Day N, Bergquist J, Arvidsson B, White N,
Ash-ton M, Lindegårdh N: Characterization of human urinary metabolites of the antimalarial piperaquine. Drug Metab Dis-pos 2006, 34(12):2011-2019.
31. Klinker H, Langmann P, Richter E: Plasma pyrimethamine con-centrations during long-term treatment for cerebral toxo-plasmosis in patients with AIDS. Antimicrob Agents Chemother
1996, 40(7):1623-1627.
Publish with BioMed Central and every scientist can read your work free of charge
"BioMed Central will be the most significant development for disseminating the results of biomedical researc h in our lifetime."
Sir Paul Nurse, Cancer Research UK
Your research papers will be:
available free of charge to the entire biomedical community
peer reviewed and published immediately upon acceptance
cited in PubMed and archived on PubMed Central
yours — you keep the copyright
Submit your manuscript here:
http://www.biomedcentral.com/info/publishing_adv.asp
BioMedcentral
reductase. I. Kinetics, tissue distribution, and extent of metabolism of pyrimethamine, metoprine, and etoprine in the rat, dog, and man. Drug Metab Dispos6(3):329-337. 33. Lee J, Son J, Chung S, Lee E, Kim D: In vitro and in vivo
metabo-lism of pyronaridine characterized by low-energy collision-induced dissociation mass spectrometry with electrospray ionization. J Mass Spectrom 2004, 39(9):1036-1043.
34. Rolan P, Mercer A, Tate E, Benjamin I, Posner J: Disposition of atovaquone in humans. Antimicrob Agents Chemother 1997,
41(6):1319-1321.
35. Agwuh K, MacGowan A: Pharmacokinetics and pharmacody-namics of the tetracyclines including glycylcyclines. J Antimi-crob Chemother 2006, 58(2):256-265.
36. Kestler H: ROC with confidence - a Perl program for receiver operator characteristic curves. Comput Methods Programs Biomed
2001, 64(2):133-136.
37. Landis J, Koch G: The measurement of observer agreement for categorical data. Biometrics 1977, 33(1):159-174.
38. Online Encyclopedia for Genetic Epidemiology studies
[http://www.oege.org/]
39. Thompson W, Walter S: A reappraisal of the kappa coefficient.
J Clin Epidemiol 1988, 41(10):949-958.
40. Vach W: The dependence of Cohen's kappa on the prevalence does not matter. J Clin Epidemiol 2005, 58(7):655-661.
41. Home Page of the Human Cytochrome P450 (CYP) Allele
Nomenclature Committee [http://www.cypalleles.ki.se/] 42. Lewis D, Watson E, Lake B: Evolution of the cytochrome P450
superfamily: sequence alignments and pharmacogenetics.
Mutat Res 1998, 410(3):245-270.
43. Ibrahim M, Steenkeste N, Khim N, Adam H, Konaté L, Coppée J, Ariey F, Duchemin J: Field-based evidence of fast and global increase of Plasmodium falciparum drug-resistance by DNA-microarrays and PCR/RFLP in Niger. Malar J 2009, 8:32.
44. Consensus Human Arylamine N-Acetyltransferase Gene
![Table 1: Primers used to amplify target sequences in cytochromes P450 isoenzymes and Nthe master mix and annealing temperature [°C] used to amplify target sequence in cytochromes P450 isoenzyme genes and -acetyltransferase 2 genes, MgCl2 [μl] for N-acetyltransferase 2 genes.](https://thumb-us.123doks.com/thumbv2/123dok_us/8321400.297412/3.612.53.555.117.597/sequences-cytochromes-isoenzymes-temperature-cytochromes-isoenzyme-acetyltransferase-acetyltransferase.webp)