QconCAT method development and
applications in proteomics
Thesis submitted in accordance with the requirements of the University
of Liverpool for the degree of Master in Philosophy by
Victoria Margaret Elizabeth Harman
Acknowledgements
I would like to thank my supervisors, especially Prof. Rob Beynon for giving me the
opportunity to write this thesis and for his invaluable guidance. I would also like to thank the
members of PFG for their help and friendship, especially Philip Brownridge for taking the time
to answer all of my incessant silly questions and Amy Claydon for lending a sympathetic ear
and a hug whenever I needed it.
Finally I’d like to thank my family for always encouraging my continuing education and Ed for
Table of Contents
List of Figures i
List of Tables ii
List of abbreviations ii
Abstract iii
1. Introduction 8
1.1 Proteomics 8
1.2 Protein quantification 9
1.3 Mass Spectrometry 11
The mass spectrometer 11
Ionisation 12
The mass analyser 15
1.4 Quantitative techniques utilising mass spectrometry 19
Label-free quantitative strategies 19
Label mediated quantitative strategies 21
1.5 QconCAT technology 27
Selection of peptides 29
Selecting the expression strain 30
The T7 expression system 30
Quantification with QconCAT 32
2. Aims and Objectives 35
3. Materials and Methods 38
3.1 Transformation 39
3.2 Glycerol stocks 39
3.3 Expression via LB IPTG 39
3.4 Expression via minimal media IPTG 40
3.5 Expression via autoinduction – unlabelled and stable isotope labelled cultures 40
3.6 Cell lysis using BugBuster 40
3.7 Cell lysis using sonication 40
3.8 Purification with the NiMAC column method 41
3.9 Preparation of purification fraction samples for SDS-PAGE analysis 41
3.10 Purification with the spin column method 42
3.11 Purification with Protino Ni-TED resin 42
3.12 Solubilisation in RapiGest as an alternative to purification 43
3.13 Protein assay 43
3.14 1D SDS-PAGE gels 43
3.15 Western blotting 43
3.16 In-gel digests 44
3.17 In-solution digests 44
3.18 Preparation for MALDI-TOF analysis of digests 44
4. Results and Discussion 46
4.1 Production of QconCAT EB1 with the original protocol 46
Section 1: modifying the QconCAT production protocol 54
4.2 Reducing expression time 54
4.3 Alterations to the cell lysis protocol 57
4.4 Alternations to the purification protocol 62
Spin column 63
Flow through study 66
RapiGest solubilisation 69
4.5 The optimised method and troubleshooting 75
Section 2: QconCAT protein as a quality control standard 77
4.6 Methods for quantification of the QconCAT standards 79
Densitometry 80
Protein assay 82
Quantification using the GluFib peptide 82
Label-free quantification 89
Summary 95
4.7 QconCATs to assess instrument performance 95
5. Conclusions 98
6. References 102
List of Figures
Introduction
Figure 1|MALDI ionisation of peptides 13
Figure 2|ESI ionisation of peptides 14
Figure 3|Schematic of Q-TOF instrument Synapt G2 17
Figure 4|Quantitative methods 20
Figure 5|Stages in the quantitative workflow where samples can be combined 22
Figure 6|QconCAT overview of production and use 28
Aims and Objectives
Figure 7|Aims and objectives 36
Results and Discussion
Figure 8|EB1 peptide map, E.coli culture and expression of the QconCAT 47
Figure 9|In-gel digestion of QconCAT EB1 49
Figure 10|EB1 heavy isotope labelling and NiMAC purification 51
Figure 11|Labelled and unlabelled EB1 QconCAT spectra 53
Figure 12|Consistent successful expression of QconCATs 56
Figure 13|Expression and purification of CC001-003 58
Figure 14|Western blots tracking the fragmentation of CC001-003 59
Figure 15|SDS-PAGE of fractions from purifications using spin columns 64
Figure 16|Brown QconCAT solution post-dialysis in 50mM ammonium bicarbonate with 1mM DTT 65
Figure 17|Flow through study SDS-PAGE gels 68
Figure 18|RapiGest solubilisation development 71
Figure 19|QconCAT selection for purification or RapiGest solubilisation 73
Figure 20|The overall QconCAT production workflow 74
Figure 21|Ribo4 QconCAT expression in different media 76
Figure 22|Expression and purification of 10 unlabelled COPYCATs 78
Figure 23|Densitometry quantifications 81
Figure 24|Comparisons between the quantification values with different methods 84
Figure 25|Time course digest plots for three COPYCATs monitoring GluFib release 88
Figure 26|Quantification values for the 10 COPYCATs 90
Figure 27|Amino acid composition analysis 92
Figure 28|Label free selected peptide intensities comparison for COPYCAT and S.cerevisiae 94
Conclusions
List of Tables
Results and Discussion
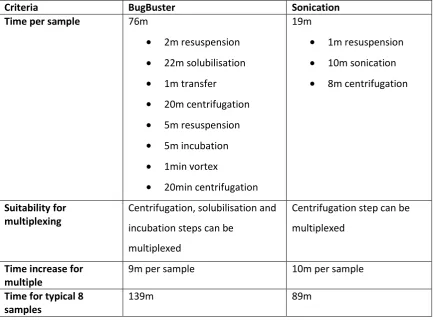
Table 1|Comparison between BugBuster and sonication methods of cell lysis 61
Table 2|Protein assay results 64
Table 3|RapiGest solubilised CC001, protein hits from the E.coli database 72
Table 4|Purified CC001, protein hits from the E.coli database 72
Table 5|Merits and demerits of five different quantification methods for the QconCAT standard 79
Table 6|Pearson’s r values for comparisons between quantification method results 85
List of Abbreviations
QconCAT| Concatemer of standard Q-peptides ELISA| Enzyme-Linked Immunosorbent Assay AQUA| Absolute Quantification
TAP-tag| Tandem Affinity Purification tag ICPL| Isotope-Coded Protein Label ICAT| Isotope-Coded Affinity Tag
iTRAQ| Isobaric Tag for Relative and Absolute Quantification TMT| Tandem Mass Tag
PSAQ| Protein Standard Absolute Quantification
SILAC| Stable Isotope Labelling by Amino Acids in Cell Culture MS| Mass Spectrometry
RT| Retention Time
SRM| Selected Reaction Monitoring MRM| Multiple Reaction Monitoring m/z| Mass to charge ratio
MALDI| Matrix Assisted Laser Desorption Ionisation ESI| Electrospray Ionisation
LC| Liquid Chromatography
HPLC| High Performance Liquid Chromatography TOF| Time of Flight
Q-TOF| Quadrupole-Time of Flight CID| Collision Induced Dissociation AMRT| Accurate Mass Retention Time AUC| Area Under the Curve
PLGS| ProteinLynx Global Server CV| Coefficient of Variation SD| Standard Deviation
SDS-PAGE| Sodium Dodecyl Sulphate - Polyacrylamide Gel Electrophoresis OD| Optical Density
Glufib| [Glu1]-FibrinopeptideB peptide IPTG| isopropyl β-D-1-thiogalactopyranoside BSA| Bovine Serum Albumin
ORF| Open Reading Frame
EDTA| Ethylenediaminetetraacetic acid DTT| Dithiothreitol
Abstract
Quantitative data is an excellent resource in any proteomics study but is essential in many. In
recent years this area has expanded from relative to absolute quantification with a wide range
of methods available for absolute quantitative proteomics. In general protein quantification is
based on either label-mediated or label-free strategies. Common label-mediated approaches
are isotope dilution strategies, such as AQUA, coupled with mass spectrometry, where analyte
signal is compared to a stable isotope labelled standard added in known abundance. These
methods are suited to small-scale studies but increasing demand for large-scale proteome
quantification exposed the need for alternative quantification methodologies. The QconCAT
technology, first published in 2005, is a label mediated approach which utilises the principle of
surrogacy to quantify analyte proteins based on a signature peptide, or peptides, for each
protein. QconCATs are concatenations of quantotypic peptides for a group of proteins, the
QconCAT gene is designed in silico and expressed heterologously in E.coli with [13C6]arg and
[13C6]lys to elicit a stable isotope labelled multiplexed absolute quantification standard.
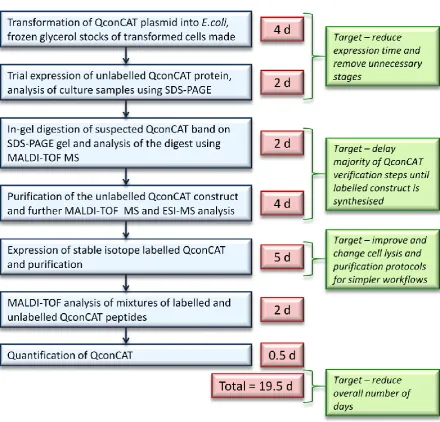
In this thesis I describe several developments to the QconCAT production protocol. These
developments reduce the production time from ~19d, using the initial method, to less than
7d. Time gains have been made across the whole workflow in the areas of protein expression,
cell lysis, and product purification. Moreover verification of the QconCAT is delayed until the
final product is synthesised, made possible by evidence of high quality reproducible
expression. I explain how these alterations allow for production of several QconCATs in
parallel, giving added efficiency. The success of the method is demonstrated through the use
of multiple QconCATs. As a result of this work it is now possible to make at least eight
QconCATs per week and the rate-limiting step of the quantification workflow has migrated
from standard preparation to data processing. The final study in this thesis discusses methods
for accurate quantification of the QconCAT protein and additional applications of QconCATs
1. Introduction
8
1.1 Proteomics
8
1.2 Protein quantification
9
1.3 Mass Spectrometry
11
The mass spectrometer
11
Ionisation
12
The mass analyser
15
1.4 Quantitative techniques utilising mass spectrometry
19
Label-free quantitative strategies
19
Label mediated quantitative strategies
21
1.5 QconCAT technology
27
Selection of peptides
29
Selecting the expression strain
30
1. Introduction
Proteomics is a wide ranging discipline, of which quantitative proteomics is just one aspect;
QconCAT is one of many methods which can be used for quantification. In order to introduce
the QconCAT methodology I will discuss some background to proteomics with an emphasis on
quantitative proteomics. I will also introduce mass spectrometry as the major analysis tool
most commonly used with QconCAT mediated quantification and discuss the instrumentation
used.
1.1 Proteomics
The proteome (Wilkins et al., 1996) (a) (Wilkins et al., 1996) (b) of an organism describes the
full complement of proteins expressed from its genetic material under a defined physiological
and pathophysiological state. Proteomics is the study of the proteome, with an aim to
characterise every protein expressed and map each protein to its cellular location, function
and interactions. The field defines identification proteomics, where expressed proteins in a
particular cell state are identified as present or absent, and quantification proteomics, which
assesses the amount of protein expressed in a given cell state. This quantification can be given
relative to other proteins in the cell or sample or as an absolute value. Disciplines such as
genomics, a study of genes and their function, and transcriptomics, a study of mRNA in a
genome, work in conjunction with proteomics. However the key advantage of proteomics is
its ability to look at the changes in protein expression by directly analysing the levels of a
protein present. The discrepancy between the level of mRNA produced within a cell and the
resulting level of protein expression was first noticed during a study of human liver proteins
(Anderson and Seilhamer, 1997), another study into the protein and mRNA in Saccharomyces
cerevisiae cells (Gygi et al., 1999) revealed a similar discrepancy. More recently a study combining transcriptome and proteome analyses on a number of Escherichia coli samples revealed that whilst many results from the transcriptome and proteome aligned well there
were also frequent cases where the values were inconsistent (Yoon et al., 2003). Vogel also
found this to be true during a study on oxidative stress in Saccharomyces cerevisiae (Vogel et
al., 2011). This illustrates the importance of proteomics as an alternative to gene-focussed studies so that the full picture of cell dynamics can be understood.
As previously mentioned, there are many facets to proteomics; often analysis of a biological
sample begins with identification of a target protein or proteins, the proteins can be
localisation within the cell, and associated proteins and function. To acquire all of this
information a wide range of techniques can be employed. The proteins can also be quantified,
either by relative abundance in changing cell or tissue states, or by absolute abundance in
copies per cell, and again quantification can employ a variety of methodologies.
1.2 Protein quantification
An established and widely used approach to protein quantification is through the use of
protein binding reagents. Applications range from specific protein targeting to analyses of
entire proteomes; an atlas of more than 700 antibodies to human proteins has been
generated, covering tissues in normal and disease states (Uhlen et al., 2005). Two major
affinity techniques are Enzyme Linked Immunosorbent Assay (ELISA) (Engvall and Perlmann,
1971) and western blotting (Towbin et al., 1979). More recently the non-affinity based
technique of mass spectrometry (MS) has also been used for protein quantification.
An ELISA uses antibodies to probe for specific proteins of interest. A simple ELISA involves the
immobilisation of a sample, containing the “analyte” protein, onto a surface; a primary
antibody is then used to bind the analyte. Often a secondary antibody is used to bind the
primary antibody and this antibody is conjugated to an enzyme. To develop the assay the
substrate for the enzyme is added, the enzyme catalyses the breakdown of the substrate to a
product, this is usually detectable by fluorescence or absorbance. If the fluorescence or
absorbance can be detected quantitatively then the technique can be used to quantify the
amount of secondary antibody bound and to therefore infer the amount of analyte protein
bound to the primary antibody. The quantification values obtained can be relative to other
samples in the assay, or if a “standard” is included in the assay, where a known protein is
measured in a range of defined amounts, this can be used to create a standard curve, from
which the absorbance or fluorescence values for the analyte can be read off to give an
absolute quantification value. This type of assay is specific and sensitive due to the use of
antibodies which are targeted solely to the protein of interest. The use of an enzyme coupled
to the secondary antibody allows for possible amplification of signal which increases the
sensitivity of the assay.
The western blotting technique also involves the use of antibodies and often detection using
enzymes, so like ELISA it can be specific and sensitive. For the blot the sample is initially
separated using SDS-PAGE. The separated proteins in the sample are then transferred to a
an antibody to detect the protein of interest. As with ELISA the antibody can be conjugated to
a radioactive, fluorescent or enzyme marker to allow detection of the bound antibody. When
an enzyme is used often the product of catalysis will give off a chemiliminescence which can
either be detected on an x-ray film or with a specialised camera. The resulting image (either
from the developed film or the image from the camera) will show bands, reflecting where the
analyte protein was present on the membrane. This image can be analysed using
densitometry to compare the optical densities (ODs) of the protein bands. If a number of
samples are present on the blot the relative ODs provide information about the relative
abundance of the analyte protein between samples. Additionally a standard can be applied in
a range of known concentrations to the same SDS-PAGE gel as the analyte protein. The ODs
from the standard can then be used to create a standard curve as with the ELISA technique,
and the OD of the analyte bands can be used to calculate the amount of analyte in the sample.
Another affinity technique involves tagging a protein of interest. The tagging of a protein was
initially used as a purification technique to extract specific proteins and protein complexes
from a solution. Two plasmids were developed which “tag” an inserted gene with the
Staphylococcal protein A gene, when the inserted gene is transcribed the protein produced is
tagged with protein A. The ability of protein A to bind immunoglobulin, particularly
immunoglobulin G (IgG), is used to remove the protein and tag by interaction with
immobilised IgG (Uhlen et al., 1983). The idea was developed to produce TAP-tags – tandem
affinity purification tags. In this design the tag consisted of protein A, as previously used,
followed by a TEV protease recognition sequence and then the calmodulin-binding peptide
(CBP). The TAP-tag was fused to a target protein, and then introduced into cells where the
target protein-tag conjugate was expressed. The benefit of the dual tag is that there can be a
two step purification to ensure that the final protein isolated is highly pure and that any
further analysis of the protein can be as accurate as possible (Rigaut et al., 1999). The TAP-tag
idea was expanded to quantification through tagging each of the open reading frames (ORFs)
in S. cerevisiae. A library of S.cerevisiae ORFs was created where, for each ORF, the gene was
tagged with a TAP and inserted into the chromosome. The method was designed not to alter
the expression levels of the tagged protein so, after isolation, quantification could be
completed on each protein in the given cell state. Quantification was performed by
1.3 Mass spectrometry
Mass spectrometry (MS) is a key tool in proteomics; major applications of MS include protein
identification, peptide or protein sequencing, and importantly for this thesis, protein
quantification. The diversity of the instrumentation and sample preparation techniques
available mean that MS can be used for studying a small number of proteins or peptides, up to
large scale analysis of highly complex samples.
ELISA and western blotting techniques are typically performed on intact protein. MS can also
be used to analyse an intact protein but in quantification it is more common to analyse
peptides resulting from a digested protein or proteins. Within the mass spectrometer peptides
can be fragmented through collision with an inert gas to give characteristic ion products which
can be used to sequence the protein, and the use of peptides also gives a wider scope of
possible methods for quantification. When a peptide is used in a quantitative experiment the
principle of surrogacy is applied. In proteomics surrogacy presumes that the molar
quantification of a peptide, arising from a proteolytically digested target protein, can be used
to directly infer the quantification of that protein. The assumption is made that the peptide
chosen is present in the same molar amount as the protein itself. The peptide is chosen as a
“proteotypic” peptide, meaning that it is a sequence unique signature peptide for that
protein, when the chosen peptide is used for quantification the term “quantotypic” can be
used, meaning that the peptide is both proteotypic for the protein and also that it is suitable
for quantification. The criteria which define a peptide as being suitable for quantification will
be discussed later.
Typically trypsin is used to digest protein samples; this enzyme is most often chosen as it
reliably and consistently recognises specific cleavage sites on the C-terminal side of arginine
(arg) and lysine (lys) residues, except when they are followed by a proline. Tryptic cleavage
produces predictable arg and lys terminated peptides, with the exception of the C-terminal
peptide. Once the sample has been fully digested into peptides it is then ready to be analysed.
THE MASS SPECTROMETER
A mass spectrometer has three components; an ionisation source, a mass analyser and a
detector. The role of the ionisation source is to deliver the peptides to the mass analyser in
the form of charged ions in the gas phase. Once inside the instrument the ions travel through
a vacuum in the mass analyser, the primary purpose of which is to separate the ions according
an ion which determines how it will travel through the analyser. Once separated the ions
collide with the detector, each event is recorded and measured. The output from the detector
is plotted as a spectrum of ion intensity plotted against m/z. There are a range of ionisation
techniques which are currently used. The two mostly commonly used in biological sciences,
which will be discussed here, are both soft ionisation techniques and produce positively
charged ions by addition of a proton or protons.
IONISATION
Matrix Assisted Laser Desorption Ionisation (MALDI), as its name suggests, uses a matrix in
order to convert analyte (in our case peptides) into positive singly charged ions in the gas
phase. Matrix ionisation techniques were developed as a way to ionise large intact masses of
polymers and proteins (Karas and Hillenkamp, 1988) and are extremely effective for peptides.
The principle of matrix assisted ionisation, (Figure 1) is that the analyte is embedded into
crystals of a matrix which absorb energy from a laser, in this way energy can be delivered to
the analyte to induce the non-volatile components into the gas phase without the molecules
being damaged by extremely high levels of energy; matrix and analyte are ejected into the gas
phase together (Fitzgerald et al., 1993). It is thought that charge is delivered to the analyte, to
create ions, via photoexcitation of the matrix, which leads to transfer of protons to the analyte
molecules (Hillenkamp et al., 1991); in MALDI-MS only singly charged peptide ions are
produced. Ionisation is variable with MALDI-MS and bias can be seen towards arginine
terminated peptides due to preferential ionisation of the arginine side chain (Krause et al.,
1999).
Many different matrices have been screened for their properties as useful compounds for the
ionisation of a sample for MS (Fitzgerald et al., 1993). We use α-cyano-4-hydroxycinnamic
acid, this is a crystalline matrix which can be solubilised, mixed with the sample and then
spotted onto a laser-target plate and allowed to dry before use in the solid state. Some are of
the opinion that the solid-phase matrices give bias to an analysis (Tholey and Heinzle, 2006). It
has been argued that regardless of how well combined the matrix and sample are, “hot spots”
will form when the matrix dries; these are places within the overall sample spot that provide
much more intense spectra, other areas of the spot may give much weaker spectra and so
reproducibility between analyses is called into question. For this reason liquid matrices are
sometimes considered more suitable. Liquid matrices are made by mixing the crystalline
matrix of choice with an organic solvent, such as pyridine. Due to the fact that the liquid
thought to occur in much the same way, however it has been reported that the homogeneity
of the spot is increased using liquid matrices, something which is beneficial for reproducibility
[image:13.595.107.538.158.546.2]of data.
Figure 1|MALDI ionisation of peptides. Energy from laser excitation of the matrix induces
expulsion of matrix and analyte peptides into the gas phase. Protons are transferred to the peptides and matrix ions are lost to create positively charged ions which progress into the mass analyser
Whilst MALDI ionisation is effective and has the benefit of being relatively tolerant to
contaminants in the sample, it has been observed that the response factor of a peptide can be
unpredictable with MALDI and equimolar peptides in a sample can give radically different ion
signals such that one peptide might not even be detected. Couto et al. conducted an investigation into the effects of using different proteases to digest the sample. They found
that changes in the positioning of a basic residue within a peptide, dictated by the location of
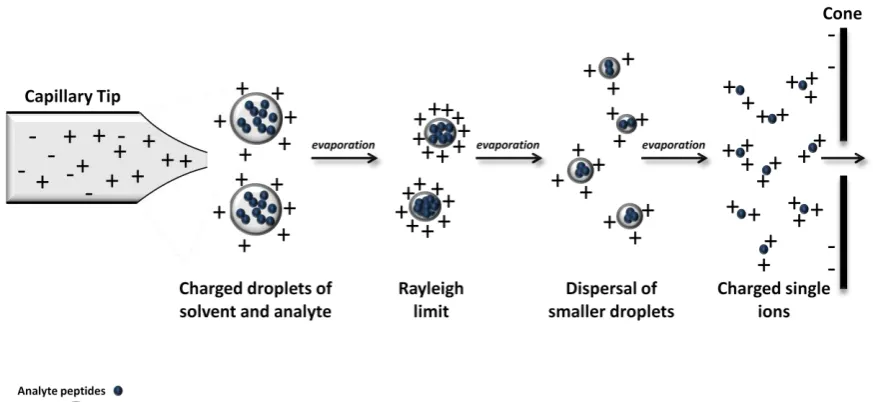
An alternative to MALDI ionisation is Electrospray Ionisation (ESI) (Figure 2). The end result of
ESI is the same as MALDI; positively charged peptide ions are ejected into the gas phase and
directed into the mass analyser. However the way in which the ions are created is very
[image:14.595.102.539.165.366.2]different and as a result ESI can produce ions with multiple positive charge states.
Figure 2| ESI ionisation of peptides. The sample is positively charged by electric current, a
fine spray of charged droplets are ejected from the tip. The solvent evaporates until the Rayleigh limit is reached, whereby the droplets separate out into smaller droplets, this cycle repeats until charged ions remain, these move through the negatively charged cone into the mass analyser.
The sample, a solution of peptides, is delivered via a capillary tube to a tip from which the
sample is sprayed into the mass spectrometer. In the case of positive ionisation an electric
field, delivered to the tip, positively charges the liquid as it flows through. As the multiply
charged liquid exits the tip, Coulomb (C) electric charge forces cause droplets to form which
repel each other and disperse, creating a spray. The solvent carrying the peptides evaporates
and the charge density on the droplet increases until the “Rayleigh limit” is reached. This limit
is defined as the point where the charge on the surface of the droplet (C) reaches a density
where the repulsion between charges is equal to the surface tension of the droplet; at this
point the droplet separates out into smaller droplets. This cycle repeats for the smaller
droplets and eventually leaves peptide ions with multiple positive charges which pass through
a negatively charged sample cone and can be analysed in the mass spectrometer (Fenn et al.,
1989; Cech and Enke, 2001).
Due to the fact that ESI is compatible with liquid flow a significant proportion of MS analyses
to reduce the complexity of the sample. This step is not part of the MS analysis but is often
used in conjunction with MS to increase the resolution of the analysis. The sample to be
analysed is taken up into an LC system (or nano-HPLC if very small volumes are being used).
Depending on the technology an autosampler can be used to inject samples from pre-defined
vial locations. The sample is then loaded onto a column; there are various columns which can
be used which separate out peptides based on different properties, one example is a reverse
phase column which separates out peptides based on their hydrophobicity. The elution from
the column is pumped through capillary to the ESI source where it can be sprayed into the
mass spectrometer. The elution time from the column becomes a factor in the MS analysis
and adds another dimension to the MS spectra; peptide ions elute into the mass spectrometer
according to their retention time (RT) so the m/z, intensity and RT of a peptide ion is
measured.
THE MASS ANALYSER
Ions are separated according to their m/z in the mass analyser. The instruments used in this
study have Time of Flight (TOF) mass analysers. The m/z value for an ion is based on the time
it takes for the ions to travel along a TOF tube of specified length. In the simplest TOF
instruments the ions enter the instrument in the gas phase and are accelerated by an electric
field. This acceleration means that ions of the same charge should have the same kinetic
energy as they enter the flight tube. After acceleration the ions travel along a linear tube,
which is free from any electric field, until they hit the detector. The time taken for this flight is
recorded and can be used to calculate the m/z of a peptide.
The longer the flight tube the greater the separation, or resolution, of the ions, therefore the
TOF tube is ideally as long as possible. The tube is generally not longer than 1-2 meters, due to
space restrictions in laboratories; however a way to increase the length of the flight without
increasing the size of the instrument is to reflect the ions back along a different trajectory
using ion mirrors (reflectron), therefore doubling the length of the flight. This increase in flight
distance increases the separation between the ions and therefore improves resolution in the
spectrum; this is termed reflectron TOF. Two instruments used in this study - the WatersTM
MALDI-TOF and the Bruker Ultraflex MALDI-TOF, both use single reflectron TOF. The WatersTM
Synapt G1 and WatersTM Synapt G2 and are also used in this study, these instruments have a
TOF system which can be used in reflectron “V” mode with a single ion reflection or in “W”
In the case of the Synapt G1 and G2 their mass analysers differ to the standard TOF seen with
the MALDI-TOF instruments. In these two instruments there is a quadrupole (Q) mass analyser
placed before the TOF, the instruments are therefore described as being Q-TOF tandem mass
spectrometers. A schematic of the G2 can be seen in Figure 3. The ions enter the mass
spectrometer and are guided through to the quadrupole. The quadrupole is made up of four
rods which conduct electric current; variations in the voltage applied to the rods will alter the
field around them. As an ion enters the quadrupole the electric field can be used to conduct
the ion through to the TOF, or the ion could be lost by altering the flight path in the electric
field, resulting in a collision with one of the rods. The quadrupole can therefore be used to
simply transmit ions through to the TOF or to select specific ions according to their m/z.
Use of the quadrupole to select specific ions is often coupled with another feature of the mass
analyser in the Synapt instruments – the collision cell. In the G2 this is made up of the trap,
ion mobility and transfer regions that can be seen on the schematic. The collision cell is
continuously active however in normal MS mode ions simply pass through to the TOF as the
collision cell is in a low energy state. When the collision cell is active it switches to high energy,
and analyte ions are bombarded with atoms of an inert gas, this fragments the peptide (in
terms of fragmentation the peptide is referred to as the precursor ion) into smaller fragments
(referred to as the product ions) which can then be separated in the TOF and measured by the
detector. This fragmentation process by collision induced dissociation (CID) is a form of
MS/MS. There are two different types of MS/MS, data dependant and data independent. In
data dependant mode ions are monitored and periodically the top 3 ions, or ions over a
certain intensity threshold, are selected by the quadrupole and the instrument then switches
to high energy mode and fragments the peptides chosen. The Synapt instruments are also
able to perform data independent MS/MS (termed MSE). In MSE all of the ions present in the
quadrupole are fragmented without selection of any kind. The purpose of MS/MS is to
fragment the peptide ions to provide more detailed structural information about the peptide.
A similar feature can be used on the Bruker Ultraflex MALDI-TOF instrument, termed
“TOF/TOF”. In MS/MS the range of fragments that can be produced can be characterised
under the Biemann nomenclature (Johnson, 1988), we mainly use b and y ions as these are
fragments at the peptide bond and are usually most abundant. An additional feature of the
Synapt G2 is the ion mobility separation feature, which WatersTM term the “HDMS” mode. This
delivers increased separation of ions in the MS mode; ions are separated according to their
cross-sectional area using a Travelling Wave potential. This increases the temporal separation
A method which utilises the selective abilities of the quadrupole and MS/MS fragmentation is
Selected Reaction Monitoring (SRM). With SRM a particular ion in selected by the user, this
ion is isolated and then fragmented and the product fragments recorded. The instrument will
have the capability to monitor a specific product ion as well as the precursor; the
precursor-product ion pair is a “transition”. The instrument used determines whether the analysis can be
termed an SRM or a pseudo-SRM. A true SRM is performed on a triple-quadrupole MS
instrument; the mass analyser in a triple-quadrupole is made up of three quadrupoles that 1)
select the precursor peptide ion to fragment 2) fragment the ion and 3) select product ions for
the detector. In the case of a Q-TOF instrument the quadrupole is used to select the precursor
ion, however once the ions are fragmented the lack of a second quadrupole means that
product ions cannot be specifically selected, so all of the product ions are monitored; this is a
“pseudo SRM”.
Multiple SRMs can be used in a single MS analysis. Multiple SRMs can be referred to as
Multiple Reaction Monitoring (MRM), although the term is less often used and SRM is
commonly used to describe MRM experiments. The benefit to SRM or MRM is that the user
selects the precursor ions to be monitored and these are programmed into the method prior
to the analysis. MRM does not use Top3 or intensity threshold criteria to select ions for
fragmentation, therefore the peptide of interest is always selected for MS/MS fragmentation.
In MS based proteomic analyses a common obstacle is the limit of detection (LOD); this is the
limit at which an ion can be detected and reliably distinguished from the background “noise”.
The LOD therefore becomes more of a challenge when analysing peptides in a complex
background (Gallien et al., 2011). SRM can help to pull the target peptide out of the
background and acquire fragmentation data on lower abundance peptides, and in this way it
can “dig deeper” into the proteome. SRM is well suited for use in quantification studies across
a large dynamic range (Picotti et al., 2009) however the method does require initial analyses,
selection of the best transitions and correction of collision energies before it can be run
(Campbell et al., 2011), this means it can be a lengthy process. Picotti et. al. (Picotti et al.,
2010) have presented a higher-throughput method for SRM where they use proteomic data
sets to select potential SRMs for target proteins and then synthesise all potential peptides
using Spot Synthesis. The potential peptides are screened using SRM based MS assays and the
most appropriate transitions are selected. Their workflow could make SRM more accessible
1.4 Quantitative techniques utilising mass spectrometry
In a quantification experiment, as mentioned previously with ELISA and western blotting, the
quantification can be relative, comparing the abundance of protein(s) between different cell
states and monitoring changes in abundance under certain stimuli; or absolute, where analyte
protein(s) are quantified to the level of copies per cell. The approaches taken for relative or
absolute quantification can be classed according to whether the method is label-free, relying
on MS data processing and in some cases unlabelled internal standards, or label-mediated,
where a chemically or metabolically incorporated label is used to differentiate between
standard and analyte (Figure 4).
LABEL-FREE QUANTITATIVE STRATEGIES
Initially, label-free quantification strategies were solely focused on relative quantification
values. Techniques such as spectral counting can be used to estimate the relative abundance
of a protein (Liu et al., 2004); this approach involves counting the number of MS/MS spectra
acquired for a peptide. It was discovered that the number of spectra acquired directly
correlated to the abundance of that peptide and therefore the abundance of the parent
protein in the sample. However spectral counting can become less reliable when looking at
lower abundance proteins with fewer spectral counts (Lundgren et al., 2010). One of the more
simple relative quantification methods available is Accurate Mass Retention Time (AMRT)
(Silva et al., 2005). This method of quantification is based on the peptide ion signal intensity in
the MS spectrum; by using the accurate mass measurement and corresponding retention time
for a peptide signal, the ion intensity of the same peptide can be compared across samples
and the relative abundance of the parent protein inferred from the intensity ratios. This
technique relies on robust and reproducible sample preparation and LC-MS performance and
can therefore be subject to inaccuracies.
Similar to AMRT, other quantitative techniques have been established which also utilise the
peptide ion signal intensity or signal area. There are a number of different Area Under the
Curve (AUC) label-free methodologies which compare the signal area and use this to infer
quantification. In initial development tryptic digests of a range of concentrations of myoglobin
were analysed using MS. The concentrations of myoglobin prior to digestion ranged from
10fmol to 100pmol and it was discovered that over this range the concentration of the
myoglobin starting protein and the sum peak areas in the MS spectrum, for five selected
peptides, showed a linear correlation (r2=0.991) (Chelius and Bondarenko, 2002). In a later
and the target peptide peak intensities were normalized to four common internal standards,
[image:20.595.105.517.132.672.2]this was found to give an improved r2=0.9978 (Bondarenko et al., 2002).
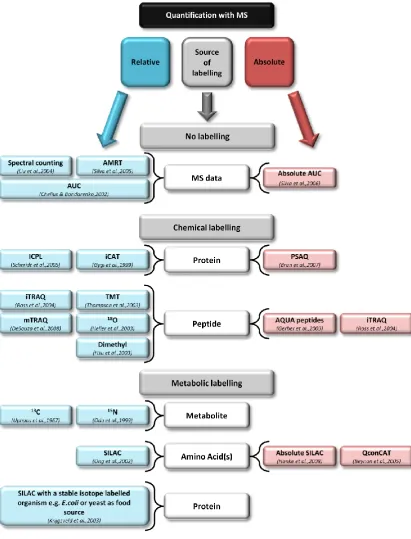
Figure 4|Quantitative methods. Summary diagram giving an overview of quantitative
Relative quantification data can give a broad overview of the expression changes within a cell
and it is often more simple to set up a relative quantification experiment. However, whilst
relative quantification is all that is necessary for many applications, if individual proteins
within the same sample need to be compared to one another, or a more accurate view of the
scale of an abundance change and its effects is required, absolute quantification is necessary
(Bronstrup, 2004). More recently AUC label-free quantification has been developed to an
absolute quantification strategy (Silva et al., 2006). In this approach the top three most
intense tryptic peptides for the protein of interest are used. A single unlabelled standard is
also included in the assay, which can be added to the sample, in a known amount, prior to
digestion and co-digested with the analyte proteins. After the sample is analysed using MS an
average signal response for the top three peptides from the standard is taken and used to
calculate the “universal signal response factor”, which is measured in counts/mol protein. The
absolute value of each of the proteins in the sample can then be calculated by dividing the
average signal response, for the top three peptides for that protein, by the universal signal
response factor. It was also demonstrated that this method was applicable to simple and
complex samples.
Quantitative MS based proteomics, especially label-free quantification, relies heavily on the
software used to analyse the data. There is a huge variety of software available for different
applications. In this study ProteinLynx Global Server (PLGS) software from WatersTM is used,
this performs label-free quantification based on the “top3” principle and comparison to a
spiked in protein digest of known concentration acting as a standard. Another example
software is MaxQuant, which started out as software for label-mediated SILAC quantification
(Cox and Mann, 2008) but now also includes label-free quantification (Luber et al., 2010).
LABEL-MEDIATED QUANTITATIVE STRATEGIES
In general, for label-mediated quantification, stable-isotope labels are used. The benefit of
these isotopes is that they introduce a mass shift in the tagged peptide, distinguishing it from
the untagged peptides but the tagged and untagged peptides still show similar behaviour;
they have the same retention time, efficiency of ionisation and during MS/MS produce the
same ion fragments (Pan et al., 2009). They are also preferred over radioactive isotopes as
they do not require stringent safe handling procedures and do not rapidly decay. There are
many different stable isotopes available; common forms used are 13C, 15N, 2H and 18O. In order
to have clear separation between tagged and untagged peptides it is helpful to have a mass
For relative quantification with stable isotope labels, the samples are differentially labelled to
distinguish between them, they are then digested and analysed in parallel using MS. Analysis
of the standard and analyte produces pairs of peaks on a spectrum – an unlabelled lower m/z
peak and the higher m/z labelled peak. The intensity ratio between the two peaks echoes any
changes in expression of that protein between the two cell states (Gouw et al., 2010). For
absolute label-mediated quantification the same principle of comparing standard and analyte
peaks is used but an accurately quantified standard is added to give an absolute value to the
quantification.
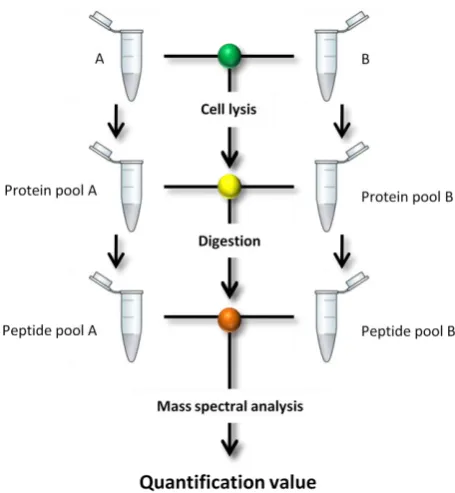
With the standard and analyte requiring differential labelling a consideration for
label-mediated quantification is the level of error which could be introduced through the individual
treatment of the samples. Ideally they should be combined as early on as possible in the
workflow to minimise variation in treatment (Figure 5). If two cultures are differentially
labelled they can be combined prior to cell lysis giving the greatest minimisation of variance. If
this is not possible the next point to combine is prior to digestion; this still minimises variation
in digestion efficiency and errors in pipetting. A greater level of variation is introduced if the
[image:22.595.217.445.401.648.2]peptides are pooled post-digestion.
Figure 5| Stages in the quantitative workflow where samples can be combined. A and B
Label can be introduced to the standard, or to differentially labelled samples, by chemical or
metabolic means. Chemical labelling involves tagging the target proteins prior to digestion,
the target peptides post-digestion or using a standard synthesised in a cell-free environment.
Isotope-Coded Protein Label (ICPL) is a chemical labelling method for relative quantification of
proteins (Schmidt et al., 2005). Two samples can be differentially labelled after cell lysis; the
ICPL reagent is either a deuterium containing (heavy) tag or is deuterium free (light tag). The
proteins are tagged at free amino groups and can then be combined for digestion. Signal
intensity from the light and heavy tagged peptides can be used to infer relative quantification.
Another labelling method for relative quantification is ICAT, where the protein is again
targeted for tagging, however unlike ICPL, in ICAT it is the cysteine residues that are tagged.
The tag can be deuterated to elicit an isotopically labelled reagent, and in a similar way to ICPL
two samples can be differentially labelled with the light or heavy forms of the reagent. The
samples can then be combined for digestion. The reagent is restrictive in that it only tags
cysteine containing peptides so not all of the peptides are suitable for quantitative analysis.
However the reagent contains a biotin molecule so post-digestion the tagged peptides can be
isolated from the solution using avidin. Comparison of the heavy and light peptide pairs in an
MS spectrum is used to infer relative quantification (Gygi et al., 1999). The benefit of both
ICPL and ICAT is that the proteins are tagged so co-digestion is possible, which helps to reduce
variation in the treatment of samples and increases the accuracy of quantification.
For targeting of peptides, rather than proteins, Isobaric Tags for Relative and Absolute
Quantification (iTRAQ) (Ross et al., 2004) reagents are commonly used. The tags bind free
amines at the N-terminus of the peptide and on lysine side chains. Every peptide in a digest is
labelled, meaning that every peptide can be used as a standard or basis for comparison for
relative quantification. Initially there were just four reagents however this has now increased
to eight. Each reagent could be used to tag a different sample set, for example eight different
growth conditions or disease states could be analysed and compared simultaneously. The
reagents are isobaric so they do not differ in mass, therefore when the tagged peptides are
analysed using MS there is no mass shift seen in the spectrum; however each of the four or
eight tags releases a different “reporter ion” in an MS/MS spectrum. The intensity of the
reporter ion can be used to relatively quantify the parent peptide and therefore the protein.
iTRAQ is commonly used as a relative quantification technique, however it can be made
absolutely quantitative with the use of accurately quantified, and subsequently tagged,
surrogate peptides, at least one peptide per protein in the analyte mix would need a
The method does call for extremely careful sample preparation, there are pitfalls which can
compromise the accuracy of the data, such as the reactivity of the tags with amine groups,
meaning that amine containing buffers such as Tris and ammonium bicarbonate cannot be
used, and adding the tags to a peptide solution at low pH can cause the tags to react with
tyrosine residues (Unwin, 2010). Additionally as the tag is applied to peptides it is introduced
later in the protocol, which allows for a greater level of error due to variance between
treatment of samples. A significant number of chemical labelling techniques tag peptides and
hence they all have an increased propensity for variation in samples. However, with iTRAQ the
late introduction of the tag can also be useful in some cases where in vivo labelling of the analyte is not possible due to the cost or scale of the labelling, for instance in the analysis of
human tissue. As a variation to iTRAQ reagents there are also mTRAQ reagents available
(Applied Biosystems, Inc., Foster City, CA) which work on a similar principle to iTRAQ but
introduce a mass-shift with the tag (DeSouza et al., 2008). There are fewer channels available
with the mTRAQ tag – just three including an “unlabelled” tag so there is less scope for
comparison between multiple cell states simultaneously. As with iTRAQ, the mTRAQ reagents
can be used for relative quantification, or absolute if a standard is used as one of the tagged
samples.
Another tagging technique is Tandem Mass Tags (TMT), which again can be used to
differentially label two samples (Thompson et al., 2003). Similarly to iTRAQ, the tags are
designed to generate a reporter ion in an MS/MS spectrum which can be used for
quantification. A benefit of the TMTs is that the reactive functionality can be altered to bind to
different groups depending on the needs of the user.
Chemical labelling does not always involve tagging with a reagent. Amongst other labelling
techniques is 18O labelling. Trypsin is used to digest the analyte protein(s) in a buffer
containing enriched 18O water, which is incorporated into the peptides as the enzyme
hydrolyses the peptide bond. Two 18O molecules are included in each peptide, one at each
terminus, which gives a 4Da mass shift (Heller et al., 2003). This method is typically used for
relative quantification, however if a standard protein of known abundance was 18O labelled
before combining the standard and analyte peptides, then absolute quantification could be
possible. The label in this method is introduced at a later stage in the protocol, so there is a
greater chance for error. However in a similar way to iTRAQ this method is widely applicable
to studies where the samples cannot be SILAC or otherwise labelled. As a final example of
is used to label the N-terminus and an amino group on lysine residues to differentially label a
set of peptides.
Rather than labelling analyte proteins with reagents, labelled standards can be synthesised for
quantification of target proteins. These standards can be produced in stable isotope labelled
form in a cell-free environment and can subsequently be accurately quantified to enable them
for use for absolute protein quantification. Protein Standard Absolute Quantification (PSAQ) is
an example of a chemically synthesised protein standard which can be used for absolute
quantification (Brun et al., 2007). The full length protein can be combined and co-digested
with the analyte protein, the resulting peptides can all be used for quantification of the target,
giving greater reliability to the method as co-digestion with the analyte minimises variation in
sample treatment. However, for each target protein a standard needs to be synthesised so
this method does not lend itself to large scale quantification. Absolute Quantification
peptides, or AQUA peptides (Gerber et al., 2003) are chemically synthesised peptides that are
stable isotope labelled and accurately quantified. They can be spiked into a sample in known
abundance before mass spectrometric analysis in order to quantify the corresponding analyte
peptide and therefore the analyte protein. Whilst quantification of the target protein is
possible from a single standard peptide, a more reliable quantification value would be
obtained from multiple peptides, in this way AQUA could be less reliable than PSAQ unless
multiple peptides were synthesised for each protein. The peptides are also combined with the
sample later on in the analysis as they do not need to be co-digested, and this has the
potential to introduce variation. Production of AQUA peptides can be expensive, especially if a
large scale study is considered. However a benefit to the chemical synthesis of the peptides is
that post-translational modifications can be added to the peptide if desired (Kettenbach et al.,
2011).
As previously mentioned, to reduce error in quantification the analyte and standard samples
should be combined as early on as possible in the protocol. In order to do this the label needs
to be introduced as early as possible and metabolic labelling in vivo rather than chemical labelling in vitro can allow for early introduction of the label (Gouw et al., 2010). As with chemical labelling, metabolic labelling can be performed with a number of different isotopes
and in different forms. For algae, bacteria or yeast the growth media can be supplemented
with a stable isotope such as 13C and 15N. Commonly 15N can be supplied in the form of
ammonium chloride and 13C can be supplied in the form of glucose (Uphaus et al., 1967; Oda
length of the protein; this can make processing more difficult. The labelled culture can be
compared to an unlabelled culture for relative quantification; as the proteins are labelled in
vivo the cells can be combined prior to cell lysis to minimise variation.
A widely used metabolic labelling strategy is Stable Isotope Labelling by Amino Acids in Cell
Culture (SILAC). SILAC is an umbrella term which covers a wide range of techniques. Initially
SILAC defined the labelling of a cell culture with a stable isotope labelled amino acid such as
deuterated leucine (Leu-d3), a labelled culture and a non-labelled culture could be combined
and the relative protein abundances quantified using MS by comparing the intensity of
labelled and unlabelled peptide ion peaks (Ong et al., 2002). This has the benefit of being able
to compare an entire proteome from one labelled culture. Arginine and lysine are commonly
used in SILAC experiments along with trypsin as the enzyme of choice. Trypsin reliably cleaves
protein after Arg or Lys residues and so leaves peptides with a consistent single heavy amino
acid at the C-terminus of the peptide, releasing a labelled peptide which will show a
predictable m/z shift in a mass spectrum. However there are other possible amino acids and
isotopes which can be used according to the particular needs of the study. With SILAC the
label is introduced early in the workflow and so the analyte and standard can be mixed prior
to digestion, this limits variation in digestion efficiency. As an alternative method SILAC has
also been used to generate a heavy reference proteome which can then be “spiked in” to
several light analyte samples for relative quantification (Geiger et al., 2011). SILAC has recently
been used to describe the metabolic labelling of larger invertebrates such as Caenorhabditis
elegans up to mammals such as mice, additionally “absolute SILAC” has been developed. It has become increasingly common to use labelling of larger organisms for relative
quantification (Gouw et al., 2010). As these organisms are not grown in culture the method of
introduction of the label can be more complex. In the labelling of mice a synthetic, usually
semi-synthetic, diet can be used which contains the stable isotope labelled amino acids. The
end result of labelling is typically 50% which, if taken into account in analysis and data
processing, still allows for effective quantification. For other organisms a two-step labelling
technique can be used; C.elegans has been labelled in this way. This two step technique
involves initially labelling E.coli with 15N using ammonium chloride as the 15N source (Krijgsveld
For absolute quantification a SILAC labelled standard can be produced in vivo which is then
spiked in with the analyte prior to digestion (Hanke et al., 2008). The recombinantly expressed
proteins are purified and accurately quantified before co-digestion, so comparison between
the standard and analyte peptide signal intensities can be used to absolutely quantify the
target protein. This method has the advantage of absolute quantification, however it is limited
by the time and costs of producing multiple labelled protein standards.
When selecting a label-mediated quantification strategy the decision has to be made between
relative and absolute quantification. If absolute quantification is to be used the two major
classes of method use peptide or protein standards. Whilst the proteins standards offer the
benefit of co-digestion with the analyte and a greater number of quantification peptides they
can take a longer time to synthesise for each target protein and every peptide is not necessary
for quantification of the analyte. A compromise between the two could be QconCAT.
1.5 QconCAT technology
A QconCAT is a concatenation of proteotypic peptides for a set of proteins of interest. A
QconCAT is assembled as a protein and can be co-digested with the analyte to reduce
variability. The benefit over other protein standards is that tryptic peptides for multiple
proteins are included in a single QconCAT construct, so quantification can be multiplexed.
QconCAT technology utilises the principle of surrogacy, which has been discussed previously.
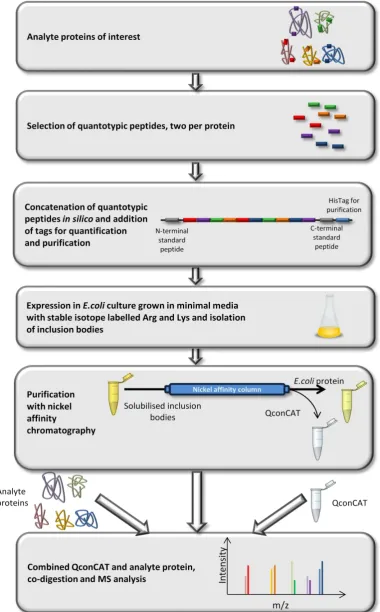
A QconCAT is a protein which is made up of carefully selected tryptic peptides; Figure 6 is an
overview of the QconCAT design process preparation and use. The design of the construct
occurs in silico; proteins of interest are selected and peptides from each are chosen, using a
number of different criteria. The peptides are concatenated into a protein sequence, and
certain peptides are added to the sequence for purification or quantification of the construct.
Finally a gene is designed, which codes for the entire construct and this is inserted into a
plasmid vector (Beynon et al., 2005; Pratt et al., 2006). The plasmid is inserted into E.coli and
the QconCAT protein is expressed in media containing stable isotope labelled amino acids. The
construct is purified from E.coli cell lysate using nickel affinity purification before co-digestion
SELECTION OF PEPTIDES
The terms proteotypic and quantotypic (section 2.3) are regularly used to describe peptides
which are suitable, under a number of criteria, for analysis and quantification of proteins.
Computational tools have been developed to predict proteotypic peptides for a given protein,
especially the detectability of the peptide in an LC-MS/MS analysis (Mallick et al., 2007; Li et
al., 2010). Properties of the amino acid residues affect the detectability of a peptide and it has become increasingly evident that a proteotypic peptide is not necessarily a quantotypic
peptide; specific criteria need to be met for a peptide to be suitable for use in a quantification
experiment (Brownridge et al., 2011) such as:
Charge on amino acid side chains
Hydrophobicity of amino acid side chains
Amino acid side chain length
Peptide structure
Must have a unique m/z value that does not overlap with another peptide in the
analysis
Ionisable to be able to be detected
Must be reproducibly observed
Avoid post-translational modification
Avoid methionine residues
Post translational modification are avoided due to the fact that the peptide can exist in the
modified and unmodified form in the analysis; the presence of both forms would split the
signal for that peptide and so give a bias towards a weak quantification. Similarly methionine
is avoided as it can be oxidised and again this would split the signal giving poor quality
quantification.
Digestion efficiency is extremely important in a quantification experiment; for the
quantification to be reliable all of the peptides, analyte and standard, must be released from
the parent proteins. A problem which is often seen in proteomics is “missed cleavage”, where
a digestion site, for example a tryptic cleavage site after an Arg or Lys residue, is not cleaved
or only partially cleaved. This results in incomplete release of the peptide, and if that
particular peptide is being used for quantification the value calculated with be biased.
Recently prediction tools such as CONSeQuence include information derived from a missed
cleavage predictor to avoid peptides that might not be completely cleaved (Eyers et al., 2011).
“QCAT”, the construct contained a single representative “Q-peptide” for each protein which
was selected using much fewer criteria than are currently used. The QconCAT protocol has
now been developed to include at least two Q-peptides per protein for more accurate
quantification and CONSeQuence is regularly used to select appropriate quantotypic peptides.
SELECTING THE EXPRESSION STRAIN
For the last 40 years E.coli has been used as a tool in molecular biology. It lends itself well to
this task as E.coli culture has a robust and high growth rate and cultures can be grown relatively cheaply (Baneyx, 1999; Wang et al., 2010). It is also an extremely well characterised
organism; the scientific community has accumulated a wealth of information on E.coli genes
and proteins. Although the E.coli genome was not the first to be completely sequenced, it was
one of the earliest with the complete genome sequence of K-12 published in 1997(Blattner et
al., 1997) and the complete BL21 (DE3) sequence following in 2009 (Jeong et al., 2009). There are many different E.coli mutants available that are knockout strains for genes coding proteins
such as proteases; crucially E.coli tolerates mutations well. The BL21 (DE3) strain has been used for many years for expression of recombinant proteins, the strain which we use for
QconCAT expression is BL21 (λDE3). This BL21 strain is deficient in both lon protease
(regulates gene expression by degradation of regulatory proteins such as transcription
regulators) and ompT protease (protease located in the outer membrane) making it a more stable environment for recombinant proteins. The λDE3 indicates that the E.coli contains λDE3
prophage DNA, this means that the E.coli strain contains the T7 RNA polymerase gene and this
is used during recombinant protein expression.
THE T7 EXPRESSION SYSTEM
Once the QconCAT gene has been synthesised it is inserted into the pET-21a plasmid vector.
This vector is chosen for two key features; firstly the vector has a selectable marker for
ampicillin resistance, meaning that E.coli cells which successfully take up the vector (transformed) will be resistant to ampicillin antibiotic, and growth of transformed cells on
ampicillin-containing agar plates allows selection of only the correctly transformed cells. The
exact mechanisms of transformation are not known; the use of CaCl2 and heat shock aid
transformation and it is thought that the calcium ions’ positive charge may shield the negative
charge on the DNA, or on the cell surface membrane (Watson, 2004) whilst the heat shock
may induce pores in the membrane which would allow passage of the shielded DNA molecule
into the cell. The transformation process is inefficient with only a small percentage of cells
therefore very important. Secondly the inserted gene is placed under the control of a T7
promoter which means that expression of the gene can be controlled using the T7 expression
system.
The T7 expression system, first used by Studier and Moffatt (Studier and Moffatt, 1986), is
based on utilising the bacteriophage T7 RNA polymerase. The BL21 (λDE3) host contains the
T7 RNA polymerase gene inserted into the bacterial chromosome under the control of the lac
operon which keeps the polymerase from being transcribed under normal cell conditions. This
polymerase is highly selective for the T7 promoter, which is not usually present in an E.coli cell. The pET21a vector, containing the T7 promoter, is transformed into the cell. After
antibiotic selection of transformed colonies, the cells are cultured and once a suitable cell
density is reached, isopropyl β-D-1-thiogalactopyranoside (IPTG) is added. The repressed
lacUV5 promoter in the lac operon prevents the T7 polymerase from being transcribed, however IPTG is a synthetic analogue of allolactose (the natural activator for the lac operon)
and its presence within the cell switches off the lac repressor, activating the lacUV5 promoter
and allowing transcription of the T7 polymerase to occur (Lewis et al., 1996). The newly
synthesised T7 RNA polymerase recognises the T7 promoter on the plasmid vector and
transcribes the QconCAT gene linked to it.
Another method has been developed to induce expression of a recombinant protein by
autoinduction (Studier, 2005). This also uses the T7 expression system but does not require
the addition of IPTG. BL21 (DE3) cells containing a recombinant gene on a pET21a plasmid
vector are grown in autoinduction media specifically designed to use allolactose as the
inducer. The media contains lactose and a restricted amount of glucose. The glucose is
designed to sustain the culture only until it reaches a suitable density for induction. The
presence of glucose prevents T7 induction by lactose as the cells use glucose preferentially as
a carbon source. Once the glucose has been depleted the cells begin to use lactose as their
carbon source. As the cells begin to metabolise lactose the metabolite allolactose is produced.
Under normal cell conditions this would bind to the lac repressor, allowing transcription of the
genes in the lac operon and so facilitating lactose metabolism. In a BL21 (DE3) cell the presence of allolactose removes the repression of the T7 lac promoter and so induces expression of the T7 RNA polymerase, leading to expression of the inserted gene on the
pET21a vector. This method of induction can be extremely useful as the optical density of the
culture does not need to be monitored to induce expression so a culture can be left to induce