UNIVERSITI TEKNIKAL MALAYSIA MELAKA
SIMULATION DESIGN ON WATER LEVEL CONTROL
SYSTEM
This report submitted in accordance with requirement of the Universiti Teknikal Malaysia Melaka (UTeM) for the Bachelor Degree of Manufacturing Engineering
(Robotic and Automation) (Hons.)
by
NOOR FAREEZA BT AMRAN SAMSUDIN B050910069
901111-08-5122
BORANG PENGESAHAN STATUS LAPORAN PROJEK SARJANA MUDA
TAJUK: Simulation Design on Water Level Control System
SESI PENGAJIAN: 2012/13 Semester 2
Saya NOOR FAREEZA BT AMRAN SAMSUDIN
mengaku membenarkan Laporan PSM ini disimpan di Perpustakaan Universiti Teknikal Malaysia Melaka (UTeM) dengan syarat-syarat kegunaan seperti berikut:
1. Laporan PSM adalah hak milik Universiti Teknikal Malaysia Melaka dan penulis. 2. Perpustakaan Universiti Teknikal Malaysia Melaka dibenarkan membuat salinan
untuk tujuan pengajian sahaja dengan izin penulis.
3. Perpustakaan dibenarkan membuat salinan laporan PSM ini sebagai bahan pertukaran antara institusi pengajian tinggi.
4. **Sila tandakan (√)
SULIT
TERHAD
TIDAK TERHAD
(Mengandungi maklumat yang berdarjah keselamatan atau kepentingan Malaysiasebagaimana yang termaktub dalam AKTA RAHSIA RASMI 1972)
(Mengandungi maklumat TERHAD yang telah ditentukan oleh organisasi/badan di mana penyelidikan dijalankan)
Alamat Tetap:
No 2, Persiaran Raja Bendahara 1, Taman Raja Bendahara,
Kuala Kangsar, Perak
Tarikh: _________________________
Disahkan oleh:
Cop Rasmi:
Tarikh: _______________________
** Jika Laporan PSM ini SULIT atau TERHAD, sila lampirkan surat daripada pihak berkuasa/organisasi berkenaan dengan menyatakan sekali sebab dan tempoh laporan PSM ini perlu dikelaskan sebagai SULIT atau TERHAD.
UNIVERSITI TEKNIKAL MALAYSIA MELAKA
DECLARATION
I hereby, declared this report entitled “Simulation Design on Water Level Control System” is the result of my own research except as cited in references.
Signature : ………..
APPROVAL
This report is submitted to the Faculty of Manufacturing Engineering of UTeM as a partial fulfillment of the requirements for the degree of Bachelor of Manufacturing Engineering (Robotics and Automation) (Hons.). The member of the supervisory committee is as follow:
……… Supervisor
TABLE OF CONTENT
Abstrak i
Abstract ii
Dedication iii
Acknowledgement iv
List of Tables v
List of Figures vi
List of Abbreviations Symbols and Nomenclatures ix
CHAPTER 1: INTRODUCTION 1
1.1 Background of Study 1
1.2 Problem Statement 4
1.3 Research Objectives 4
1.4 Scope of Project 5
1.5 Summary 5
CHAPTER 2: LITERATURE REVIEW 6
2.1 Introduction 6
2.2 Fundamentals of Process Control Technology 7
2.2.1 Types of Control System 8
2.3 Water Level Control System 11
2.3.1 Open Loop Control System in Water Level 12 2.3.2 Closed Loop Control System in Water Level 13
2.4 Liquid-level Control System 14
2.5 ProcessLine Experimental Rig of Intelitek 16
2.6 Simulation Design 17
2.6.1 Visual Basic 6 Software 18
CHAPTER 3: METHODOLOGY 20
3.1 Overview 20
3.2 Problem Tree Analysis 21
3.3 Cause and Effect Diagram 22
3.4 Project Flow Diagram 24
3.4.1 Literature Review 25
3.4.2 Understanding on Current Available System and Its Conceptual
Design 25
3.4.3 Visual Basic 6 Software Tools Setup 26
3.4.4 Creating New Application 29
3.4.5 The Control Properties 31
3.4.6 Design and Development Process of the Simulation 32
3.4.7 Testing and Debug 34
3.4.8 Troubleshooting 34
3.5 Milestone Chart 34
3.6 Summary 37
CHAPTER 4: RESULTS AND DISCUSSION 38
4.1 Simulation Concept 38
4.1.1 The Open Loop System 39
4.1.2 The Closed Loop System 40
4.1.3 The ProcessLine Concept 41
4.2 Simulation Coding 43
4.2.1 Open Loop Simulation 43
4.2.2 Closed Loop Simulation 46
4.2.3 ProcessLine Concept 50
4.2.4 Difference between Open Loop, Closed Loop and ProcessLine
Concept 53
4.3 Discussion on the System‟s Validation 55
CHAPTER 5: CONCLUSION AND RECOMMENDATIONS 62
5.1 Conclusion 62
5.2 Future Work 63
5.2.1 Add New Features to the Simulation 63 5.2.2 Extend the Simulation to Real Life Application 64
REFERENCES 65
APPENDICES
A Open Loop Simulation Code B Closed Loop Simulation Code
LIST OF TABLES
4.1 Comparison Table between Simulation 53
LIST OF FIGURES
1.1 Block Diagram of a Control System 2
1.2 Intelitek Water Level and Flow Control 3 2.1 Simplifies Description of a Control System 7
2.2 Block Diagram of Open Loop System 8
2.3 Basic Closed Loop System 9
2.4 Block Diagram of Open Loop System 12
2.5 Feedback Loop in Water Level System 13
2.6 A Level Loop 15
2.7 Front View of Water Level and Flo 16
3.1 Problem Tree Analysis 22
3.2 Cause and Effect Diagram 23
3.3 Project Flow Diagram 25
3.4 New Project Dialog 27
3.5 VB6 Programming Environmnt 28
3.6 Source Code Window 29
3.7 List of Objects 30
3.8 List of Procedure 30
3.9 Properties Window 31
3.10 Flowchart of Design and Development of Simulation 33
3.11 Milestone Chart 36
4.1 Open Loop System Concept 39
4.2 Closed Loop System Concept 40
4.3 Feedback in Close Loop System 41
4.4 ProcessLine Experimental Rig 42
4.5 Pseudocode for Open Loop Simulation 44
4.6 Arrangement in the Simulation 45
4.7 Simulation of Open Loop System 46
4.8 Pseudocode for Closed Loop Simulation 47
4.9 Arrangement of the Simulation 48
4.11 Simulation of the Closed Loop System 50 4.12 Pseudocode for ProcessLine Concept Simulation 51
4.13 Simulation of the ProcessLine 52
4.14 Arrangement in the Simulation 53
4.15 Question 1 55
4.16 Question 2 55
4.17 Question 3 56
4.18 Question 4 56
4.19 Question 5 57
4.20 Question 6 57
4.21 Question 7 58
LIST OF ABBREVIATIONS, SYMBOLS AND
NOMENCLATURE
UTeM - Universiti Teknikal Malaysia Melaka
GUI - Graphical User Interface
VB6 - Visual Basic 6
PC - Personal Computer
PID - Proportional, Integral and Derivative
VB - Visual Basic
CHAPTER 1
INTRODUCTION
This chapter explains about the background of the project, problem statement, objectives and the scope of the project.
1.1 Background of Study
The utilization of control and automation systems is very vital in optimizing production, quality and productivity furthermore lessens manufacturing cost. Process Control System is a system that consists of a computer, process control equipments and a process interface system which may be a part of the special function computer. It can also be an amalgamation between the statistics and engineering discipline that deals with the mechanism, algorithms and architectures to control the process (N. S Nise, 2008).
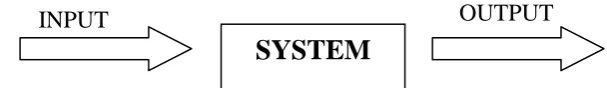
[image:16.595.189.493.684.728.2]Process control is very crucial in industrial operations as it contributes in safety, minimizing the environmental impact and optimizing processes by maintaining process variable near the desired values. The controlled system has an input variable and output variable as in Figure 1.1. The response is described in terms of reliance of the output variable that can be described using mathematical equations based on the physical laws.
Figure 1.1: Block Diagram of a Control System
OUTPUT
SYSTEM
There are some benefits that can be gained from creating a system with input and output variables and symbolizes the system as a block diagram. This representation separates the problem from the exact equipment used and allows the standard view.
In process control system, there are two major types of control system, which are open loop and closed loop. In open loop, there is no feedback system, which differs from the closed loop which has the feedback system. Feedback is a progression of the absolute casual path that leads from the primary detection of the gap to the consequent modification of the gap. In industries, application of water level control system is widely use especially in chemical industries.
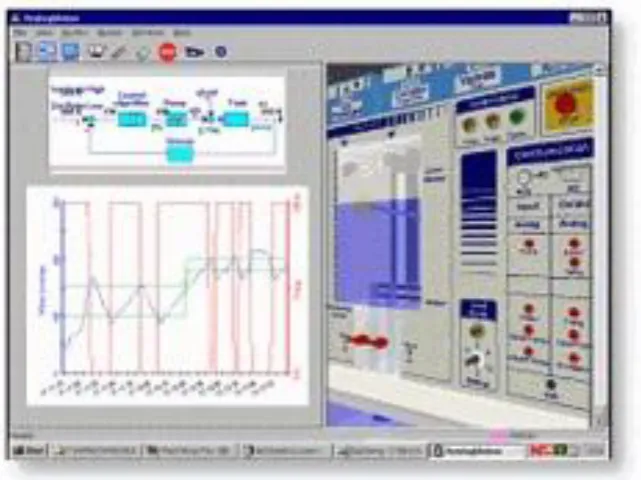
Figure 1.2 : Intelitek Water Level and Flow Control (Intelitek, 2002)
1.2 Problem Statement
The previous experimental rig, ProcessLine, which is a product from Intelitek, had encountered a software failure. Thus, the engineering students are lack of a learning kit that can help them in understanding the water level control system. In order to overcome this problem, a simulation is needed to give a better demonstration to the engineering students on how the control system in water level works. Thus, a learning demonstration using simulation assisted with a GUI needs to be designed in order to aid the process of knowledge sharing.
combination of visually arranging components or controls on a form, specifying characteristics and actions of those components, and writing further lines of code for more functionality (H. M Deitel, 1999).
1.3 Research Objectives
The main objective of this project is to develop a new learning kit simulation using Visual Basic 6 (VB6) software to aid in understanding water level control system for potential students.
Several sub-objectives identified that must be achieved in order to make this project successful:
1. To demonstrate the systems in water level system; open-loop control system and closed-loop control system.
2. To apply the ProcessLine‟s concept in the simulation.
1.4 Scope of Project
The scope of this project is to understand the basic simulation and analysis on water level control system that is created in VB 6. The simulation designed should be user-friendly and easy to be used by the students. This simulation matches with most of the water level control system that is implemented in the industries. Thus, by making the similar concept simulation, it will allow the engineering students to understand on how to control the water level system.
1.5 Summary
CHAPTER 2
LITERATURE REVIEW
This chapter explains and proves any information which is related to the project is being studied and summarized it. By referring from past studies, research and books, it will serve as a guidance for the project in the future.
2.1 Introduction
This chapter will appraise previous research which focuses on process control system, open loop system, water level control system in experimental rig and the monitoring system. There are groups of control method of monitoring and controlling the liquid level in the experimental rig system which had been implemented will be discussed.
2.2 Fundamentals of Process Control Technology
A control system usually consists of subsystems and processes assembled for the purpose of obtaining a desired output with desired performance, given as the input. Figure 2.1 (a) shows a control system in its simplest form.
[image:22.595.170.536.154.192.2]
Figure 2.1: Simplified Description of a Control System.
The control system has an input variable and output variable as in Figure 2.1. The response is described in terms of reliance of the output variable that can be described using mathematical equations based on the physical laws.
There are two major way to measure the performances, which are, transient response and steady state error. These two components can be formed into an equation: y (t) = ytr (t) + yss (t). The transient response is present right after the system is turned on. It is a response of a system to a change of form. Steady state error is the property of the input or out response for a linear system.
Control system is widely used in the industrial for moving large equipments with precision that would otherwise be impossible. Control system is build based on four main reasons which are power amplification, remote control, convenience of input form and compensation for disturbances. Other than that, robots that are designed using the control system can compensate for human abilities as control system can be useful in remote or dangerous locations. Last but not least, control system is able to reimburse for disturbance where the system itself can measure the amount of interruption and return to its position.
2.2.1 Types of Control System
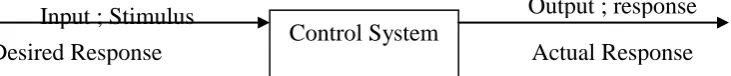
There are two major patterns of control system; open loop and closed loop. These two designs are the internal architecture of the total system. A general open loop system is shown in Figure 2.2.
Output ; response Input ; Stimulus
Control System
Figure 2.2 : Block Diagram of Open Loop system
The system starts with an input transducer that will convert the form of input to the one that is used in the controller. The controller will control the process or plant. Other signals such as the disturbance will yield the algebraic sum of the input signals using correlated signs.
Open loop system can not compensate any disturbance added like in Figure 2.2. The output of the system will be corrupted as the system can not correct the disturbance. Open loop system is easily commanded by the input. It does not take any command from any sources other than the input. Thus, the system will totally change when there‟s any disturbance added.
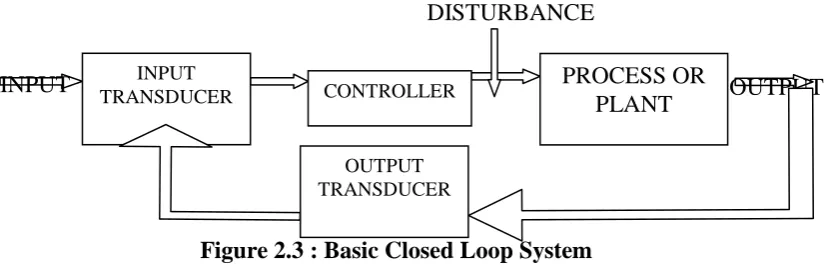
Since the open loop has its weakness towards disturbance and inability to fix it, this situation can be solved by using a closed loop system. An example of closed loop system can be seen in Figure 2.3.
Figure 2.3 : Basic Closed Loop System
The input is converted by the input transducer in a form where the controller will use. Output transducer will then measures the output response and converts it to a form that is used by the controller. A closed loop system can compensate the disturbance by measuring the output response and give the measurement back
PROCESS OR PLANT INPUT TRANSDUCER PROCESS OR PLANT
INPUT OUTPUT
DISTURBANCE
CONTROLLER
INPUT TRANSDUCER
INPUT CONTROLLER OUTPUT
DISTURBANCE
[image:23.595.121.536.491.626.2]through a feedback path. If there happens to have any difference between the responses, the system will drives back the plant.
Pressures, temperature, level and flow rate are often the variables that need to be set on large systems. The setting should not be changed when faults occur. The process control system works by using the controlled variable as the input variable since it is measured by suitable equipment and create the electrical signal. Thus, this will allow the closed-loop controller to control the variable.
Advantages that can be seen when using closed loop system is that it is more accurate compares to the open loop system since it is not easily disturbed in the presence of non-linearity. Moreover, closed loop system has the ability to reduce noise. This is because of closed loop system has the feedback mechanism which can clear out the errors between input and output signals and remain the unaffected to the external noise sources.
As the conclusion, the system that is able to perform as describes measurement and has the ability to correct any disturbance is called as closed loop system or feedback system.
2.3 Water Level Control System
One of the applications of the closed loop system can be seen in Water Level Control System. The feedback control systems are older than humanity. Numerous biological control systems were built into the earliest inhabitants of our planets. Below is the history of liquid level control:
Soon after Ktesibios, the idea of liquid-level control was applied to an oil lamp by Philon of Byzantium. The lamp is consisted of the two oil containers configures vertically. The lower pan was open at the top and was the fuel supple for the flame. The closed bowl was the fuel reservoir foe pan below. The containers were interconnected by two capillary tubes and another tube called the vertical riser, which was inserted into the oil in the lower pan just below the surface. As the oil burned, the base of the vertical riser was exposed to air, which forced the oil in the reservoir above to flow through the capillary tubs into the pan. The transfer of the fuel from the upper reservoir to the pan stopped when the previous oil level in the pan was reestablished, thus blocking the air from entering the vertical riser. Hence, the system kept the liquid level in the lower container constant.‟ (Norman S. Nise, 2008 )
2.3.1 Open Loop Control System in Water Level
An open loop control system exists when the process variables not compared and action is not taken from feedback, instead taken without any regards of the process variable. Once the ratio between output and input is determined, the controller knows how much input is needed to produce the desired system output.
In open loop control, tests are used to determine the typical system response to a particular input. Once the ratio between output and input is determined, the controller „knows‟ how much input that need to be produced in the desired system output. The open loop controller is set at the beginning of the process and provides a constant input to the system, regardless the system output (H. L. Wade, 2004).
Figure 2.4 : Block Diagram of Open Loop Control System
2.3.2 Closed Loop Control System in Water Level
If the system in Figure 2.4 undergoes a change, the system is unable to return to the desired level. In fact, the system is not even aware about the changes and continues to supply the same amount of energy to the pump. This situation can be fixed by adding a feedback system for the controller to control the water level so that it will scrutinize the change in the water level and then pass the information to the process block that is controlling the pump. Thus, when this happens we can see that the system actually works in a loop, not in a line. This type of system can be called as the closed loop system (C. Wesley, 1998)
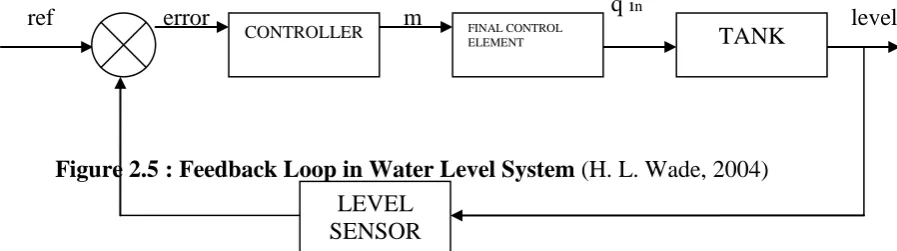
In Figure 2.5, we can see that process output (h tank) is measured by the level sensor and the transmitted to the controller. This signal transmitted is called as the feedback signal. In the controller, the measured value or feedback signal is subtracted from the reference value that represents the desired water level. This difference is called error that will serve as the input to the control algorithm. Thus, the controller will decide on what the final element status will be. As for this project, the final control element, pump, will determine the input flow (q in) which eventually will determine the water level (h tank) (H. L. Wade, 2004).
Figure 2.5 : Feedback Loop in Water Level System (H. L. Wade, 2004)
TANK
q
inH
CONTROLLER FINAL CONTROL
ELEMENT TANK
LEVEL SENSOR
[image:26.595.113.562.644.769.2]In the closed loop system, there is the on-off control algorithm, which is a common algorithm used in many closed loop systems. It is named on-off control algorithm since the output may be in one off of two states named On and Off. This control algorithm works based on:
1. When the reference value is greater than the measured value, the algorithm output is in one state named Off.
2. When the reference value is smaller than the measured value, the algorithm output is in one state named On.
There is an exception where the device being activated is mechanical, such as the water pump in this project‟s experimental rig. Since the system response is relatively fast, the pump will frequently modulates between the on and off states. Thus, this will cause wear on the pump after relatively short service. So in such cases, dead band is used to moderate the on-off control. Dead band in on-off control is a range in which the control algorithm output retains its previous state (Intelitek, 2002)
2.4 Liquid-level Control System
Liquid levels or water levels in the tanks and the flow between the tanks have always been the basic problems in the process industries. Liquid is one of the main materials in industries as most processes require the liquid to be stored in a specific tank or pumped to another tank.
The size and shape of the process vessel affect the speed of changes in a level control loop. For example, the larger vessels will take longer to fill than smaller ones and the flow rate of the input and outflow pipes. Manufacturers usually will use one of many different measurement technologies to determine level, including ultrasonic, radar, float gauge, and pressure measurement. The final control facet in a level control loop is usually a valve on the input and/or outflow connections to the tank (Figure 2.6). Because it is regularly critical to evade tank overflow, surplus level control systems are sometimes employed (PA Control, 2006).
Figure 2.6: A Level Loop (PA Control, 2006)
2.5 ProcessLine Experimental Rig of Intelitek