City, University of London Institutional Repository
Citation
: Carapeto, M., Moeller, S., Faelten, A., Vitkova, V. and Bortolotto, L. (2011).
Distress classification measures in the banking sector. Risk governance and control: financial markets & institutions, 1(4), pp. 19-30.This is the accepted version of the paper.
This version of the publication may differ from the final published
version.
Permanent repository link:
http://openaccess.city.ac.uk/12409/Link to published version
:
Copyright and reuse:
City Research Online aims to make research
outputs of City, University of London available to a wider audience.
Copyright and Moral Rights remain with the author(s) and/or copyright
holders. URLs from City Research Online may be freely distributed and
linked to.
City Research Online: http://openaccess.city.ac.uk/ [email protected]
Distress classification measures in the banking sector
Maria Carapeto*, Scott Moeller, Anna Faelten, Valeriya Vitkova, Leonardo Bortolotto
Mergers and Acquisitions Research Centre
Cass Business School, City University of London
January 29, 2010
* Corresponding author: Maria Carapeto, Faculty of Finance and Mergers & Acquisitions Research
Centre, Cass Business School, 106 Bunhill Row, London EC1Y 8TZ, United Kingdom. Telephone:
+44 (0) 20 7040 8773. Facsimile: +44 (0) 20 7040 8881. Emails: [email protected] (Carapeto),
[email protected] (Moeller), [email protected] (Faelten),
[email protected] (Vitkova), [email protected] (Bortolotto).
Grateful thanks to the sponsors of the M&A Research Centre for providing support and practical
Distress classification measures in the banking sector
Abstract
This paper investigates distress classification measures in the banking sector. The power of
ten different accounting measures is tested using media coverage as the benchmark for a
sample of 1,175 banks which participated in merger and acquisitions or divestiture deals over
the past 22 calendar years. According to the results of the study, a bank should be defined as
distressed if the ratio of its non-performing loans to total loans is in the two highest deciles of
the industry, using a three-year moving average. This measure is typically favored by
practitioners, who maintain that other common measures, e.g., those involving provisions for
loan losses, are not as accurate as they express only a managerial forecast. Interestingly,
measures that capture capital adequacy too often depict the bank as healthy even if it is de
facto distressed, while measures of asset quality, though highly correlated with each other,
tend to overestimate the number of distressed banks.
Key words: Distress classification models; Banking sector; Mergers and Acquisitions;
Divestitures.
1
Distress classification measures in the banking sector
1
Introduction
‘Leaders of the Group of 20 summit begin their summit in Pittsburgh on Thursday determined to increase the resilience of a financial sector that was brought to its knees last autumn. To this end, the G20 finance ministers, together with the Basel Committee on Banking Supervision, the international body that sets bank capital rules, have called for banks’ mandated minimum capital ratios to be raised and for large banks to hold even more capital. This is an understandable reaction to the financial crisis. But do regulators really know how much capital the banking system needs? The current regulatory capital
framework, established by the Basel Committee, provides no empirically justified answer. The Basel framework’s core regulatory capital requirement – that banks hold a minimum of 8 per cent Tier I plus Tier II capital relative to risk-weighted assets – has been in place for more than 20 years.… The regulators thus failed to address the fundamental question of whether this historical amount of capital was sufficient to protect individual banks or the system as a whole. Not surprisingly, given the lack of a solid foundation, regulatory capital requirements have not acted as a binding constraint on the amount of capital banks actually hold.… Large institutions that became distressed during the crisis maintained even greater capital buffers relative to regulatory minimums.… Indeed, a key lesson from the credit crisis is that, regardless of the level at which the minimum is set, regulatory capital, by itself, is not sufficient to prevent large banks from failing. We need to complement regulation with more effective market discipline. This requires better information, which could perhaps be provided by regular stress tests.’
‘Markets Are the Best Judge of Bank Capital’ (Financial Times, September 23, 2009)
The 2008 crisis has had a major impact on the banking industry, emphasizing the need to
identify clearly early signs of distress in the financial sector. Financial institutions, banks in
the majority of cases, differ from other businesses in that they have different accounting
rules, transparency requirements, and economic functions. Banks reconcile the different
needs of borrowers and lenders by transforming small size, low risk and highly liquid
deposits into larger, riskier, and illiquid loans. In most cases, banks’ assets are longer term
and less liquid than their liabilities. If banks were to mark to market their assets frequently,
the probability of appearing insolvent would increase significantly (see Amel-Zadeh and
2 that they earn through lending. Therefore, conventional accounting indicators of distress,
such as interest coverage ratio, cannot be applied to analyze the financial soundness of banks.
As a result, when considering financial institutions, it is necessary to devise a definition of
distress which takes into account their fundamentally different characteristics.
The accounting measures used in the literature can be broadly divided into three groups:1
i) Capital adequacy or capitalization indicators: Tier 1 Capital, Tier 2 Capital, and leverage
ratios (see, e.g., Wheelock and Wilson, 2000); ii) asset quality indicators: non-performing
loans to total loans and provision for loan losses to total loans (see, e.g., Elsas, 2007); iii)
multivariate indicators, including trigger points (see, e.g., Wirnkar and Tanko, 2008). The
existing literature on distress within the financial sector hence does not provide a universally
accepted classification tool to distinguish between healthy institutions and those that are
likely to experience financial distress. In fact, there has been no systematic analysis of the
different distress measures, their degrees of accuracy, and the ways in which they are related
to each other. The aim of this paper is to eliminate this deficiency in the existing literature on
this topic.
The main objective of this study is thus to identify the most accurate, consistent, and
simple accounting measure(s) of distress that can be used to distinguish between healthy and
financially unsound institutions. The construction of reliable and consistent measure(s) of
distress would allow for the identification of distressed financial institutions before they
became insolvent (for example, via the implementation of early warning systems), while
1It should be noted that any liquidity measures of the soundness of financial organizations
have been excluded from the groups since the liquidity of these institutions can fluctuate
considerably over short periods of time and is typically the last accounting measure to be
3 minimizing the potential costs associated with financial distress, on both micro and macro
levels. The ability to identify banks that are at risk of default accurately and in a timely
manner would also help in the targeting of audits and make the allocation of scarce bank
monitoring resources more efficient. The identification of those banks that require
examination and potential intervention could then complement the on-site bank monitoring
process. More reliable measures of distress could also assist in the assessment of the degree
of success and relative efficiency of the different approaches to dealing with distress (e.g.,
mergers and acquisitions (M&A), government intervention, filing for Chapter 11).
In light of the high media exposure of merger and acquisition deals in banking, this paper
uses a sample of 1,175 banks which participated in M&A or divestiture deals in the banking
sector over the past 22 calendar years to analyze the different accounting indicators of
distress that have been adopted by academics, practitioners, and regulators. Since information
about banks that are at risk of default is confidential, this study relies on media information to
determine the degree of accuracy of each accounting measure as a distress classification tool.
The media measure is thus used to determine the banks within the baseline sample which are
de facto distressed (see, e.g., Poghosyan and Cihak, 2009). This approach is due to the fact
that the accounting measures analyzed in this study involve a degree of subjectivity with
regards to the way they present the financial health of banks. For example, asset quality
indicators such as the ratio of the provision for loan losses to total loans reflect managerial
anticipations of future economic conditions and events (see also Laeven and Valencia, 2008),
while the majority of capitalization indicators analyzed in this study present the regulatory
perspective on how distress should be defined when considering financial institutions.
Although media information may inadvertently be influenced by the subjectivity of
4 financial health of a given bank when compared to the perspectives of managers and
regulators.
The findings of the study show that the most appropriate accounting measure of distress is
the ratio of non-performing loans to total loans. This result is in line with many practitioners
who consider this measure as the best indicator of bank distress since it does not incorporate
the future expectations of management, e.g., contained in provisions for loan losses. An
additional finding is that accounting ratios which measure the asset quality of banks seem to
be highly correlated with each other and tend to overestimate the number of distressed banks,
whereas measures which capture the capital adequacy of banks have a tendency to severely
underestimate the number of distressed banks.
The remainder of the paper is organized as follows: Chapter 2 provides a review of the
literature on distress classification measures; Chapter 3 describes the sample as well as the
methodology used in the study; Chapter 4 discusses the empirical results; Chapter 5 provides
some robustness checks; and Chapter 6 concludes.
2
Literature Review
Academics, practitioners, and regulators have all used several methods to identify
distressed financial institutions. A macro definition of distress within the financial sector is
provided by Elebute (1999). According to this author, distress in the banking sector is
observed when a fairly reasonable proportion of banks are unable to meet their obligations to
customers, owners, and the economy, as a result of weakness in financial, operational and/or
managerial capabilities, which renders them either illiquid or insolvent. Heffernan (2005)
5 ‘failed’ if it is liquidated, merged with a healthy bank (or purchased and acquired) under
central government supervision/pressure, or rescued with state financial support.”
The literature on distress in the financial sector identifies three broad categories of
distress indicators which capture both macro and micro level information and reflect both
qualitative and quantitative information with regards to the financial health of banks. The first
category comprises of accounting measures based on balance sheet and income statement
information. The second category includes measures which reflect market prices of financial
assets such as bank subordinated debt and equity. The third category of distress classification
tools consists of measures which capture the economic environment in which financial
institutions operate. Since the objective of this study is to identify the most accurate, simple
and reliable accounting measures of distress that can be used on a micro level to categorize
individual financial institutions as healthy or distressed, this literature review concentrates on
the accounting measures of financial distress.
An analysis of the existing literature suggests that there are three main groups of
accounting measures that have been utilized by academics in the past in order to distinguish
between healthy and distressed banks. The first category of accounting measures captures
information about the capital adequacy of financial institutions and their degree of
capitalization. The second group reflects information with regards to the asset quality of
banks and the third is based on multivariate analysis and combines information about
different aspects of the financial position of banks, such as their liquidity, asset quality,
capital adequacy, leverage, and managerial quality and efficiency (see, for example, Martin,
1977, Hwang et al., 1997, Logan, 2000, Heffernan, 2003, Curry et al., 2003, Elsas, 2007,
Koetter et al., 2005, and Wrinkar, 2009). These studies are not reviewed here since they are
6
2.1
Capitalization Measures
Under the Basel Accord, every bank is required to hold a certain amount of capital in
order to be able to face potential losses in the future. Under Basel II, the Tier 1 Capital ratio
has to be at least 4%, whereas the Total Capital ratio has to be at least 8%.2 A significantly
undercapitalized bank is considered to present either a Total Capital ratio lower than 6% or a
Tier 1 Capital ratio lower than 3%.
Wheelock and Wilson (2000) attempt to identify the financial characteristics that
influence the likelihood of a financial institution being acquired or failing. The authors define
a bank as failed if it was closed by the Federal Deposit Insurance Corporation (FDIC) during
the period under consideration. However, since some banks were allowed by the FDIC to
remain in operation even if in default, the study adopts a second measure of bank distress
defined as a proxy for the Tier 1 Capital ratio. In this way, a bank is categorized as distressed
if the ratio of total equity capital less goodwill divided by total assets is less than 2%. The use
of 2% as a threshold is based on the FDIC Improvement Act of 1991 which requires
regulators to close or impose prompt corrective action on any bank whose equity ratio falls
below that level.
In light of the recent financial crisis, however, many practitioners have started to question
the ability of the Tier 1 Capital ratio to accurately predict the health of banks, suggesting that
a better measure of capital adequacy should be the Tangible Common Equity ratio (TCE
2 Tier 1 Capital = Permanent Shareholder’s Equity + Disclosed Reserves – Goodwill.
Tier 2 Capital = Loss Reserves + Revaluation Reserves + Hybrid Instruments + Subordinated Long
Term Debt.
7 ratio).3 The TCE ratio does not include intangible assets and preferred equity and, therefore,
is smaller than the Tier 1 Capital ratio and a useful tool to identify those banks that issue
substantial preferred equity (e.g., banks involved in government bailouts). In this way, there
have been recent efforts by regulators to amend the capital adequacy measures used. For
instance, recently, regulators mentioned the possibility that a Tier 1 Common Equity Ratio
could be included in the Basel II accord, though there is no general agreement on what the
optimal level of the TCE ratio should be. As Roubini (2009)4 points out, regarding the
outcome of the Supervisory Capital Assessment Plan: “The regulators estimated equity needs
of the 19 banks based on a TCE ratio of 4% (as a percent[age] of tangible assets). However,
even 4% implies a leverage ratio for these banks of 25. The IMF instead – properly –
considered a scenario where the TCE ratio is increased to 6% that is equivalent to a leverage
ratio of 17 that represents the average leverage ratio for all US banks in the mid-1990s before
leverage shot up in the latest credit bubble…”
2.2
Asset Quality Measures
A useful accounting measure used by practitioners to identify financially vulnerable
banks is the so-called Texas ratio which was developed by Gerard Cassidy and others at RBC
Capital Markets. This ratio is calculated by dividing total non-performing assets by TCE plus
loan loss reserves and was initially used to analyze troubled Texas banks during the 1980s.
This indicator has been utilized by many practitioners in the current financial crisis to
3 TCE ratio = (Total Equity – Intangible Assets – Goodwill – Preferred Equity) / Tangible Common
Assets.
8 differentiate between healthy and distressed banks. The ratio classifies a bank as distressed
when its value is equal or above 1 (100%).
Another set of accounting measures which captures the asset quality of banks is based on
provision for loan losses (LLP). These measures are directly linked to credit risk, which
represents the major source of business risk in small banks. In a study of the savings and
cooperative banking sector of Germany, Elsas (2007) defines a bank as distressed if it is
placed in the two highest deciles of loan loss provisions for two subsequent years (deciles of
loan loss provisions standardized by total loans to non-financial institutions are constructed in
the cross-section of banks on a yearly basis). A similar approach is adopted by Sahut and Mili
(2009), who use the highest quartile of loan loss provisions over two subsequent years as a
measure of distress. However, many practitioners, along with some academics (see Laeven
and Valencia, 2008) consider non-performing loans to total loans a better indicator of distress
as it does not include the future expectations of management which are contained in the
provision for loan losses.
2.3
Multivariate Measures
Most studies that develop multivariate measures of distress are typically based on two
types of econometric analysis, namely discriminant analysis and logit/probit analysis. The
determinants of bank distress on the basis of which the various logistic models are estimated
include the ratios of total equity to total assets, loan loss provision to total loans, total costs to
total income, profit before taxes to total equity, liquid assets to total assets, and interest
expenses to deposits. These studies are not presented here since their analysis is not directly
pertinent to the objectives of this paper. The multivariate analysis approach in this paper
9 analyze the causes of banking distress in the EU banking sector. The study is based on a
sample of 5,708 banks from the 25 EU countries and covers the period 1996 – 2007. The
results of the study define a set of thresholds (‘trigger points‘) based on capitalization, asset
quality, and profitability that can be used to identify healthy from weak banks.
The analysis of the existing literature on distress classification tools within the financial
sector and the causes of distress thus suggests that there is no agreement with regards to
which is the most appropriate, simple, and reliable measure that could be used in order to
distinguish between financially sound and vulnerable banks. It is the objective of this study to
address this issue and identify accounting measure(s) that could be used on a consistent basis
in order to recognize banks which are in distress.
3
Data and Methodology
This study uses data on M&A and divestiture deals in the banking sector from the
Bloomberg database. The sample is global and comprises completed deals only. The search
criteria do not include any specific constraints, apart from limiting the observations of targets,
acquirers, and sellers to public companies within the banking industry. Financial information
is taken on the announcement date of each deal and one year prior from the Bureau van Dijk
database (BvD). Information from the BvD database is also used in order to estimate industry
averages. Data on leverage, profitability, non-performing loans to total loans, provision for
loan losses to total loans, Tier 1 Capital ratio and Total Capital ratio is collected for each
bank included in the sample.
The sample of banks that is examined consists of all completed M&A and divestiture
deals over the period 1987 – 2008. The rationale behind the choice of M&A and divestiture
10 order to construct the benchmark media measure. The sample of analyzed banks consists of a
sample of 472 M&A deals and a sample of 581 divestiture deals. The M&A
sample consists of 472 targets and 472 acquirers or a total of 944 banks. The divestitures
sub-sample consists of 581 sellers (banks which divest a branch or business unit), 581 acquirers
(banks which buy a branch or business unit from the seller banks), and 581 targets (the entity
that is being sold/divested). In order to ensure that the results of the analysis are accurate and
consistent, only those banks for which all of the required financial information is available
are included in the final sample of this study. Consequently, the total number of banks
analyzed for the purpose of this study is limited to 1,175 banks which participated in M&A or
divestiture deals over the period 1987 – 2008.
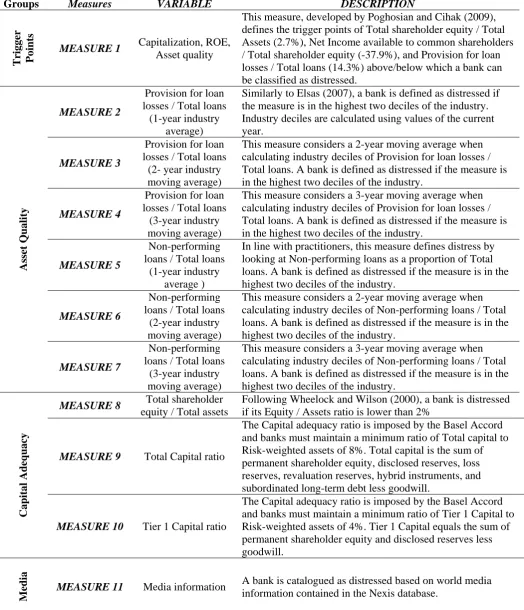
The accounting measures that this study analyzes can be divided into four groups on the
basis of the different information that these ratios capture. Group 1 consists of Measure 1, or
the so-called trigger points. It is a multivariate measure of distress in the sense that it reflects
information with respect to different characteristics of banks such as profitability, asset
quality, and capitalization. Measures 2 to 7 inclusive are members of the second group of
accounting ratios that capture information related to the asset quality of banks. Group 3
includes Measures 8 to 10 inclusive. The accounting ratios in this group reflect information
with respect to the capitalization of banks. Group 4 consists of Measure 11, which is the
benchmark media distress classification tool. It is expected that measures which belong to a
particular group will behave in a similar manner and provide consistent results with regards
to the number of banks that they identify as healthy or distressed. As such (see also Table 1):
Measure 1 is defined as ‘Trigger points’ and is based on indicators of capitalization, asset
quality, and profitability (Poghosyan and Cihak, 2009). Total shareholder equity divided by
11 capitalization. It is expected that distressed banks will have substantially lower leverage
ratios relative to healthy banks. Loan loss provision divided by total loans is adopted as a
proxy for asset quality. This ratio is likely to be significantly higher for distressed banks
relative to healthy banks. Income available to common shareholders divided by total
shareholder equity (ROE) is used in order to measure profitability. It is expected that
distressed banks will have very low or negative ROE ratios. On the basis of these trigger
points, a bank is classified as distressed if its ROE is below -37.9%, its leverage ratio is
below 2.7% or its loan loss provision to total loans is above 14.3%. It should be noted that for
a bank to be classified as distressed it is necessary that only one of these conditions is met.
Measure 2 is defined as the ratio of loan loss provision to total loans based on a one-year
industry average. According to this measure, a bank is classified as distressed if it is in the
highest two deciles of its industry (Elsas, 2007).
Measure 3 is defined as the ratio of loan loss provision to total loans based on a two-year
industry moving average. According to this indicator, a bank is defined as distressed if the
measure is in the highest two deciles of the industry. A two-year horizon has been adopted to
smooth the measure over time.
Measure 4 is defined as loan loss provision to total loans based on a three-year industry
moving average. According to this indicator, a bank is distressed if this measure is in the
highest two deciles of the industry. Similarly to the previous indicator, a three-year horizon
has been adopted to smooth the measure over time.
Measure 5 is defined as the ratio of non-performing loans to total loans, and is used to
measure the degree of credit risk and asset quality of banks. This measure is favored by
practitioners and has also been highlighted by Poghosyan and Cihak (2009). It is expected
12 bank is defined as distressed if this measure is in the highest two deciles of its industry, based
on a 1-year industry average.
Measure 6 is defined as non-performing loans to total loans based on a two-year industry
moving average. According to this indicator, a bank is defined as distressed if this measure is
in the highest two deciles of the industry.
Measure 7 is defined as the ratio of non-performing loans to total loans based on a
three-year industry moving average. According to this indicator, a bank is defined as distressed if
this measure is in the highest two deciles of the industry.
Measure 8 is defined as the Total Capital ratio. This ratio equals total capital divided by
risk-weighted assets. Total capital is the sum of permanent shareholders’ equity, disclosed
reserves, loss reserves, revaluation reserves, hybrid instruments, and subordinated long-term
debt, less goodwill. According to this measure, a bank is classified as distressed if this ratio is
less than 8% (Basel II).
Measure 9 is defined as the Tier 1 Capital ratio, and equals the sum of permanent
shareholders’ equity and disclosed reserves less goodwill divided by risk-weighted assets. A
bank is defined as distressed if this ratio is below 4% (Basel II).
Measure 10 is the so-called leverage ratio. A bank is defined as distressed if this ratio is
lower than 2% (Wheelock and Wislon, 2000).
Measure 11 is the benchmark ratio which is based on media information. A bank is
catalogued as distressed when it is possible to define it this way on the basis of world media
information contained in the Nexis database (Poghosyan and Cihak, 2009).
Detailed searches are performed on each bank in the Nexis database in line with the
methodology adopted by Poghosian and Cihak (2009). The Nexis database contains over
13 newswires updated continuously, many within minutes of publication. Searches are
performed on each of the 1,175 banks which constitute the baseline sample, for each year,
using a combination of the bank’s name and a set of key words designed to capture distressed
situations.5 When a search gives at least one reference to distress for a particular bank in the
year in consideration, the news associated with this bank is further examined to ensure that
this information is in fact related to the given bank being distressed. As a result, the risk of
incorrectly classifying a bank as distressed is minimized. This strategy results in 57 banks
identified as distressed.
In order to measure the power of each ratio to distinguish distressed from healthy banks,
it is assumed that the banks that were de facto distressed in our sample are those identified by
the media information measure. It is considered that the media measure is the most objective
benchmark measure that is readily available to use for the purposes of this analysis. This is
due to the fact that accounting measures will tend to be influenced by managerial
anticipations of future economic conditions. Furthermore, these measures can be manipulated
by management in order to misrepresent the financial soundness of their organization or
smooth earnings. In addition, regulatory measures, such as the Total Capital and Tier 1
Capital ratios can also be influenced by the perceptions of the agencies that have devised
them. For example, these ratios are typically criticized for overstating the financial health of
banks. Consequently, these regulatory measures are expected to underestimate the number of
banks that are actually distressed.
In order to determine the degree of accuracy of the accounting measures analyzed in this
study, it is necessary to identify a method that facilitates the comparison of these measures to
5 The key words used are: ‘rescue,’ ‘bailout,’ ‘financial support,’ ‘liquidity risk,’ ‘liquidity support,’
14 the benchmark media information measure in a comprehensive and formal manner.
Therefore, for every accounting measure, the study identifies a threshold above or below
which each bank is classified as distressed or healthy. Accordingly, a dummy variable is
constructed for each accounting measure. This dummy variable is assigned a value of ‘1’ if
the bank is classified as distressed according to the given accounting measure, and ‘0’
otherwise.
The study estimates industry averages for the accounting measures, based on provision
for loan losses and non-performing loans in order to ensure that the financial health of banks,
is analyzed relative to appropriate benchmarks. Accounting measures for the banking
industry as a whole are calculated with the use of one-, two-, and three-year moving averages,
in order to ensure that any potential effects of the economic cycle on the size of the examined
accounting ratios are controlled. In order to estimate industry values for each accounting
measure for each year over the period 1987 – 2008, all the banks included in the BvD
database are included.6
The data analysis uses descriptive statistics and paired correlation matrices in order to
capture the classification power of each accounting measure. In addition, interviews with
practitioners are conducted in order to gather qualitative data on the degree of usefulness of
each accounting measure as a distress classification tool.
6 It should be noted that only those categories of banks that are present in the baseline sample are
included in order to construct industry averages. The categories that are included consist of bank
holding and holding companies, central banks, commercial banks, cooperative banks, investment
15
4
Results
4.1
Correlation Analysis
Since the primary objective of this study is to identify the most appropriate measure(s) of
distress, it is of particular interest to find the measure which displays the highest correlation
with the benchmark media measure. The strength of the association between each accounting
measure and the benchmark media measure is regarded as an indication of the reliability and
accuracy of the examined distress classification tools. Through the calculation of the linear
association between the different measures, their overall ‘goodness of fit’ is evaluated. The
paired correlations ‘account’ for the overall accuracy of each accounting measure by
simultaneously capturing information related to the proportion of correctly and incorrectly
identified healthy and distressed banks by each accounting measure.
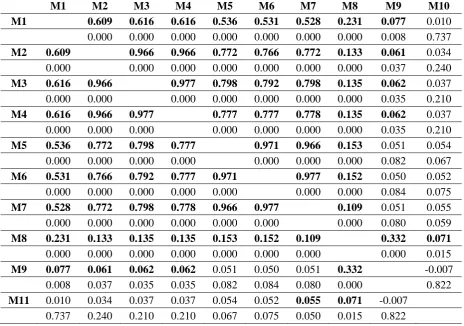
The paired correlations between the accounting measures and the benchmark media
measure are presented in Table 2. The results indicate that the most accurate classification
measure(s) of distress are those based on total shareholder equity to total assets and
non-performing loans to total loans, using one-, two-, and three-year industry moving averages.
Total shareholder equity to total assets is a measure of the capital adequacy of a given bank.
This measure is expected to be highly correlated with the media benchmark measure since it
represents the amount of capital that a bank can use as a buffer in order to offset unexpected
losses due to sudden falls in its asset values. The fact that the measures based on
non-performing loans to total loans are among the measures with highest correlation to the media
benchmark measure is in line with the information acquired from interviews that have been
conducted with practitioners. These interviews suggest that measures based on
16 results suggest that comparing non-performing loans to total loans with industry deciles
calculated with a three-year moving average is more accurate than with a simple one- or
two-year moving average.
The findings also show that, within the asset quality group, accounting measures based on
provision for loan losses are less consistent and reliable relative to measures based on
non-performing loans. These results could be explained by the fact that measures based on
provision for loan losses are overly dependent on management’s future expectations and
could be subject to accounting manipulation. For example, the provision for loan losses will
be higher if management adopts a more conservative approach to estimating expected losses.
Management can also manipulate the size of the provision for loan losses in order to
misrepresent the financial soundness of their organization or smooth earnings.
Based on the results of the analysis, major groups of accounting measures can be
identified which tend to predict distress in a consistent manner as indicated by the paired
correlations between these measures. Upon examination of the correlation matrix presented in
Table 2, it is noticed that measures based on provision for loan losses and non-performing
loans tend to behave in a similar manner. This observation could be explained by the fact that
these measures capture similar financial information about banks and can be related to the
overall asset quality of banks. Furthermore, the analysis reveals that the accounting measures
which reflect the capital adequacy of banks have very low or negative correlations with each
other. A possible explanation for these results could be the fact that capital adequacy
measures severely underestimate the number of distressed banks relative to the media
17
4.2
Accuracy of Accounting Measures
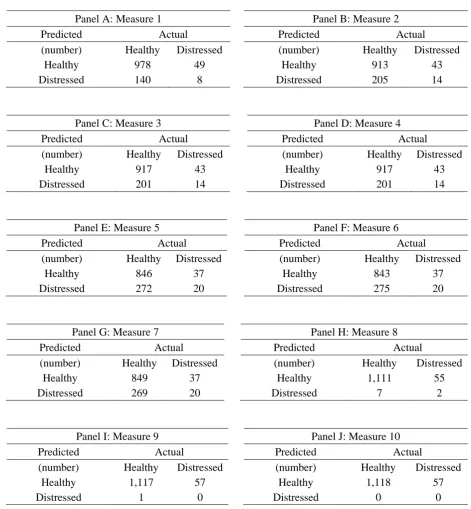
Table 3 presents expectation-prediction tables for each accounting measure relative to the
media benchmark indicator. The results presented in the table indicate the number of banks
that are correctly or incorrectly identified as healthy or distressed based on each accounting
measure. Since the primary objective of this paper is to find the simplest, most accurate and
consistent measure of bank distress, it is of particular importance to identify the accounting
measure which results in the highest number of banks correctly identified as distressed and
the lowest number of banks incorrectly identified as healthy. This is due to three key
characteristics of banks and the banking system which differentiates them from the rest of the
economy. Firstly, banks play a pivotal role in the economy of a given country by transferring
financial capital from economic agents with surplus funds to economic agents with deficit
funds. In addition, the sound functioning of the banking system is founded on the basis of the
confidence of the customers of banks in the financial stability of these financial institutions.
In order to maintain this confidence in the banking system, it is necessary to be able to
identify accurately and in a timely manner those banks that are at risk of default. Thirdly, due
to the nature of the banking system, the bankruptcy of one bank can trigger contagion effects
within the financial sector resulting in the collapse of the entire system. These three
characteristics of the financial system imply that the inability to identify reliably distressed
banks could lead to severe loss of welfare for society and significant value erosion for the
economy as a whole. Therefore, it could be argued that the ability to identify accurately
banks at risk of default is more important than the ability to identify accurately healthy banks.
Consequently, those accounting measures which result in the highest number of correctly
identified distressed banks and the lowest number of banks incorrectly identified as healthy
18 Table 3 demonstrates that the accounting measures which result in the highest number of
banks correctly identified as distressed are those based on non-performing loans to total
loans. The measures based on one-, two-, and three-year moving averages each correctly
identify 20 banks as distressed. A potential explanation for these findings could be the fact
that these ratios reflect the credit risk faced by a bank, which is the most important source of
commercial bank losses and the most common reason for bank failures.
In addition, the results presented in Table 3 show that measures of capital adequacy such
as Tier 1 and Total Capital Ratios result in the lowest number of correctly identified
distressed banks. These measures also result in the highest number of correctly identified
healthy banks. These findings could be explained by the fact that regulatory measures of
capital adequacy are set too low and consequently fail to identify those financial institutions
that are at risk of default. Another explanation for these results could be that, in order to
calculate the Tier 1 and Total Capital ratios, it is necessary to calculate the risk-weighted
assets of banks. The weights that are used to calculate these risk-weighted assets are
relatively arbitrary and not determined by an explicit risk model (this is true for the period
under consideration of this study). Furthermore, it can be proven that supervisory agencies
have a limited ability to recognize or penalize ‘bad’ banks when the amount of required
capital is dependent upon the degree of risk reported by these banks. Consequently, it may be
necessary to devise more ‘risk-insensitive’ measures of capital adequacy, in order to
overcome the shortcomings of the Tier 1 and Total Capital ratios (Poghosyan and Cihak,
2009). It can be concluded that current regulatory measures of capital adequacy should not be
used as a reliable distress classification tool and should not be adopted to make decisions or
develop policies that aim at preventing financial distress and/or minimizing its costs. These
19 default need to be revised and that it is necessary to use indicators of bank distress with a
higher predictive power such as measures of asset quality.
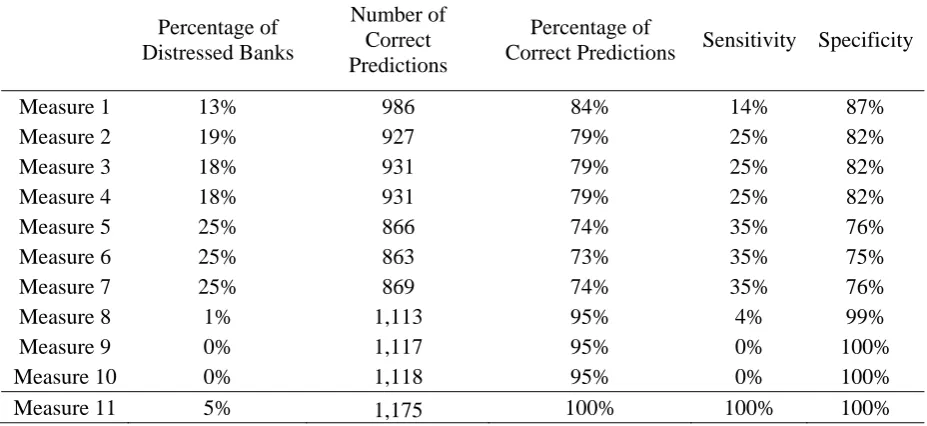
Table 4 shows an analysis of the predictive power for each accounting measure. The first
column of the table presents the percentage of distressed banks identified by each accounting
measure out of the total number of examined banks. When comparing the number of banks
that are classified as distressed according to each accounting measure relative to the
benchmark media measure, it appears that the ratios which reflect information about the asset
quality of banks, such as those based on provision for loan losses or non-performing loans,
overestimate the number of distressed banks. In contrast, the accounting ratios which measure
the capital adequacy of banks, such as the total shareholder equity to total assets, Total
Capital, and Tier 1 Capital ratios, appear to underestimate the number of distressed financial
institutions. These results support the a priori expectation that accounting measures which
belong to the same group will behave in a similar manner and provide consistent results.
Table 4 also presents the percentage of distressed banks, the total number of banks
correctly identified as either distressed or healthy by each accounting measure, the percentage
of banks correctly identified as either healthy or distressed out of the total number of banks,
the percentage of correctly identified distressed banks out of the total number of distressed
banks within the analyzed sample - or the so-called ‘sensitivity’ of each measure - and the
percentage of correctly identified banks as healthy out of the total number of healthy banks -
or the so-called ‘specificity’ of each measure. As previously explained, for the purposes of
this study, the most crucial assessment of the accuracy and reliability of each accounting
measure is that of sensitivity.
According to the measure of sensitivity of each accounting ratio, the ratios based on
20 measures based on provision for loan losses to total loans are shown to be relatively more
accurate compared to capital adequacy or multivariate measures of bank distress. The former
measures constitute the group of accounting ratios which reflect the asset quality of financial
institutions. These accounting measures capture information about the degree of credit risk
faced by financial institutions and consequently present a more accurate indication of the
financial health of banks.
Finally, the results presented in Table 4 re-confirm the finding that measures of capital
adequacy are less reliable and inconsistent indicators of the financial soundness of banks.
The above-presented findings confirm the a priori expectation that the accounting ratios
within each group of measures will behave in a similar and consistent manner. The measures
within the asset quality group appear to be more accurate relative to those within the
capitalization and multivariate groups since they result in the highest percentage of correctly
identified distressed banks.
5
Robustness Checks
In order to evaluate the reliability of the baseline analysis adopted in this study, it is
necessary to perform certain robustness checks with regards to the sample selection
techniques and the methodology employed.
Since the benchmark measure of distress is based on media information, it is possible that
some banks, in particular the smaller ones, may attract less media attention. As a result, a
bank that is distressed may be incorrectly classified as healthy if the media does not report
any information on it. In addition, it is expected that larger banks will receive higher media
exposure relative to small and medium-size banks. Consequently, the presence of banks
21 To assess the degree of robustness of the sample selection techniques with regards to bank
size, it is necessary to perform the analysis separately with a sub-sample of medium-size
banks. The proxy for size that is employed is the total value of bank assets.
In order to perform these robustness tests, a sample which excludes those observations in
the highest and lowest quartile of banks in terms of asset value is constructed. The paired
correlations between the dummies included in the sample are then re-estimated. The only
correlations between the benchmark measure and the accounting measures that are significant
are those based on total shareholder equity to total assets and non-performing loans to total
loans. Consequently, the findings associated with the baseline sample of banks appear robust
with regards to the sample selection techniques and methodology adopted in the study.
6
Conclusion
The recent financial crisis has highlighted the need to identify measure(s) of the degree of
soundness of financial institutions that can be used in order to separate distressed from
healthy organizations, identify potentially vulnerable banks well in advance of the occurrence
of insolvency, and assess the efficiency and financial consequences of existing methods of
dealing with distress. Since the characteristics of banks are fundamentally different from
those of non-financial institutions, conventional measures of distress such as the interest
coverage ratio cannot be used when analyzing them. According to the existing literature,
there is no universally accepted definition and measure of financial distress that can be
applied to banks. This paper identifies the most accurate, reliable, simple, and consistent
distress classification tool that can be used based on accounting measures of the financial
soundness of banks. Media information on each bank is used as a benchmark in order to
22 most adequate and consistent measures of distress are those based on non-performing loans to
total loans. In addition, the results show that the use of a three-year industry moving average
provides a better benchmark for distress relative to one- and two-year industry averages. The
findings also demonstrate that measures related to the asset quality of banks tend to
overestimate the number of distressed banks, and measures related to the capital adequacy of
banks tend to underestimate that of distressed banks. The results of the study appear robust
with regards to the sample selection techniques and methodology employed in order to
perform the analysis.
This study identifies the most accurate accounting measure on the basis of which banks
can be classified as healthy or distressed. As such, market-related indicators which are
naturally volatile, in particular during banking crises (as banks rarely fall alone), have been
overlooked. An interesting area for further research includes a comparative analysis of the
different types of government policies that can be devised to deal with distress in the
financial sector and the relative performance and effectiveness of these policies both in the
23
References
Alashi, S. (1993) ‘Bank Failure Resolution: The Main Option’. NDIC Quarterly, 3 (2),
pp. 41 - 58.
Amel-Zadeh, A., Meeks, G. (2009) ‘Bank Failure, Mark-to-Market and the Financial
Crisis’. Working Paper, [Online].
Available at: http://ssrn.com/abstract=1494452.
[Accessed December 1, 2009]
Barth, J. et al. (2001) ‘Bank Regulation and Supervision: What Works Best?’. Bank for
International Settlements Working Paper, [Online].
Available at: http://www.bis.org/bcbs/events/b2ealev.pdf.
[Accessed September 5, 2009]
Bernanke, B. et al. (1996) ‘The Financial Accelerator and the flight to quality’. The
Review of Economics and Statistics, 33(1), pp. 1 - 15.
Curry, T., Elmer, P., Fissel, G. (2003) ‘Using Market Information to Help Identify
Distressed Institutions: A Regulatory Perspective’. FDIC Banking Review, 15(3), pp. 1 – 16.
Demirguc-Kunt, A., Detragiache, E. (2005) ‘Cross-country Empirical Studies of Systemic
Bank Distress: A Survey’. IMF Working Paper No. 05/96, [Online].
Available at: http://ssrn.com/abstract=888142 (Social Science Research Network).
[Accessed September 5, 2009]
Elebute, K. (1999) ‘The Role of External Auditors in Resolving Distress’. This Day
Newspaper, [Online].
Available at: http://www.freewebs.com/bizadmin/publication4.htm.
24 Elsas, R. (2007) ‘Preemptive Distress Resolution Through Bank Mergers’. Working
Paper, [Online].
Available at: http://ssrn.com/abstract=967306 (Social Science Research Network).
[Accessed September 5, 2009]
Heffernan, S. (2003) ‘Bank Failures’. Modern Banking, 2nd ed. West Sussex: John Wiley
& Sons Ltd, pp. 351 – 406.
Hwang, D., Y., Lee, C., Liaw, K. (1997) ‘Forecasting Bank Failures and Deposit
Insurance Premium’. International Review of Economics and Finance, 6(3), pp. 317 – 334.
King, T., Nuxoll, D., Yeager, T. (2006) ‘Are the Causes of Bank Distress Changing? Can
Researchers Keep Up?’. Federal Reserve Bank of St. Louis Review, pp. 57 – 80.
Koetter, M. et al. (2005) ‘Accounting for Distress in Bank Mergers’. Deutsche
Bundesbank Discussion Paper Series 2, [Online].
Available at: http://papers.ssrn.com/sol3/papers.cfm?abstract_id=811525 (Social Science
Research Network).
[Accessed September 5, 2009]
Laeven, L., Valencia, F. (2008) ‘Systemic Banking Crises: A New Database’.
International Monetary Fund Working Paper, [Online].
Available at: http://papers.ssrn.com/sol3/papers.cfm?abstract_id=1278435 (Social Science
Research Network).
[Accessed September 5, 2009]
Logan, A. (2000) ‘The Early 1990s Small Bank Crisis; Leading Indicators’. Financial
25 Office of Comptroller of the Currency. (1988) ‘Bank Failure: An Evaluation of the
Factors Contributing to the Failure of National Banks’. Federal Reserve Bank of Chicago
Working Paper, [Online].
Available at: http://www.occ.treas.gov/bankfailure.pdf.
[Accessed September 5, 2009]
Olugun, S. (1994) ‘Bank Failures in Nigeria: Genesis, Effects and Remedies’. CBN
Economic and Financial Review, 32 (10), pp. 512 - 521.
Poghosyan, T., Cihak, M. (2009) ‘Distress in European Banks: An Analysis Based on a
New Data Set’. International Monetary Fund Working Paper, [Online].
Available at: http://papers.ssrn.com/sol3/papers.cfm?abstract_id=1356465.
[Accessed September 5, 2009]
Sahajwala, R., Van den Bergh, P. (2000) ‘Supervisory Risk Assessment and Early
Warning Systems’. Basel Committee on Banking Supervision Working Paper, [Online].
Available at: http://www.bis.org/publ/bcbs_wp4.pdf.
[Accessed September 5, 2009]
Sahut, J., Mili, M. (2009) ‘Determinants of Banking Distress and Merger as Strategic
Policy to Resolve Distress’. Working Paper, [Online].
Available at: http://ssrn.com/abstract=1343814 (Social Science Research Network).
[Accessed September 5, 2009]
Whalen, G., Thomson, J. (1988) ‘Using Financial Data to Identify Changes in Bank
Condition’. Federal Reserve Bank of Cleveland Economic Review, 2(1), pp. 17 – 26.
Wheelock, D., Wilson, P. (2000) ‘Why Do Banks Disappear? The Determinants of U.S.
Bank Failures and Acquisitions’. The Review of Economics and Statistics, 82(1), pp.
26 Wirnkar, D. (2009) ‘CAMEL Based Derived W-score Function for Banks Performance
Evaluation: An Urgent Necessity’. Working Paper, [Online].
Available at: http://ssrn.com/abstract=1355043 (Social Science Research Network).
[Accessed September 5, 2009]
Wirnkar, D., Tanko, M. (2008) ‘CAMEL(S) and Banks Performance Evaluation: The
Way Forward’. Working Paper, [Online].
Available at: http://ssrn.com/abstract/=1150968 (Social Science Research Network).
27
Table 1: Distress classification measures
Groups Measures VARIABLE DESCRIPTION
Trigger Points
MEASURE 1 Capitalization, ROE,
Asset quality
This measure, developed by Poghosian and Cihak (2009), defines the trigger points of Total shareholder equity / Total Assets (2.7%), Net Income available to common shareholders / Total shareholder equity (-37.9%), and Provision for loan losses / Total loans (14.3%) above/below which a bank can be classified as distressed.
Asset Quality
MEASURE 2
Provision for loan losses / Total loans
(1-year industry average)
Similarly to Elsas (2007), a bank is defined as distressed if the measure is in the highest two deciles of the industry. Industry deciles are calculated using values of the current year.
MEASURE 3
Provision for loan losses / Total loans
(2- year industry moving average)
This measure considers a 2-year moving average when calculating industry deciles of Provision for loan losses / Total loans. A bank is defined as distressed if the measure is in the highest two deciles of the industry.
MEASURE 4
Provision for loan losses / Total loans
(3-year industry moving average)
This measure considers a 3-year moving average when calculating industry deciles of Provision for loan losses / Total loans. A bank is defined as distressed if the measure is in the highest two deciles of the industry.
MEASURE 5
Non-performing loans / Total loans
(1-year industry average )
In line with practitioners, this measure defines distress by looking at Non-performing loans as a proportion of Total loans. A bank is defined as distressed if the measure is in the highest two deciles of the industry.
MEASURE 6
Non-performing loans / Total loans
(2-year industry moving average)
This measure considers a 2-year moving average when calculating industry deciles of Non-performing loans / Total loans. A bank is defined as distressed if the measure is in the highest two deciles of the industry.
MEASURE 7
Non-performing loans / Total loans
(3-year industry moving average)
This measure considers a 3-year moving average when calculating industry deciles of Non-performing loans / Total loans. A bank is defined as distressed if the measure is in the highest two deciles of the industry.
Capital Adequacy
MEASURE 8 Total shareholder
equity / Total assets
Following Wheelock and Wilson (2000), a bank is distressed if its Equity / Assets ratio is lower than 2%
MEASURE 9 Total Capital ratio
The Capital adequacy ratio is imposed by the Basel Accord and banks must maintain a minimum ratio of Total capital to Risk-weighted assets of 8%. Total capital is the sum of permanent shareholder equity, disclosed reserves, loss reserves, revaluation reserves, hybrid instruments, and subordinated long-term debt less goodwill.
MEASURE 10 Tier 1 Capital ratio
The Capital adequacy ratio is imposed by the Basel Accord and banks must maintain a minimum ratio of Tier 1 Capital to Risk-weighted assets of 4%. Tier 1 Capital equals the sum of permanent shareholder equity and disclosed reserves less goodwill.
Media
28
Table 2: Paired correlations between accounting measures and the media benchmark
M1 M2 M3 M4 M5 M6 M7 M8 M9 M10
M1 0.609 0.616 0.616 0.536 0.531 0.528 0.231 0.077 0.010
0.000 0.000 0.000 0.000 0.000 0.000 0.000 0.008 0.737
M2 0.609 0.966 0.966 0.772 0.766 0.772 0.133 0.061 0.034
0.000 0.000 0.000 0.000 0.000 0.000 0.000 0.037 0.240
M3 0.616 0.966 0.977 0.798 0.792 0.798 0.135 0.062 0.037
0.000 0.000 0.000 0.000 0.000 0.000 0.000 0.035 0.210
M4 0.616 0.966 0.977 0.777 0.777 0.778 0.135 0.062 0.037
0.000 0.000 0.000 0.000 0.000 0.000 0.000 0.035 0.210
M5 0.536 0.772 0.798 0.777 0.971 0.966 0.153 0.051 0.054
0.000 0.000 0.000 0.000 0.000 0.000 0.000 0.082 0.067
M6 0.531 0.766 0.792 0.777 0.971 0.977 0.152 0.050 0.052
0.000 0.000 0.000 0.000 0.000 0.000 0.000 0.084 0.075
M7 0.528 0.772 0.798 0.778 0.966 0.977 0.109 0.051 0.055
0.000 0.000 0.000 0.000 0.000 0.000 0.000 0.080 0.059
M8 0.231 0.133 0.135 0.135 0.153 0.152 0.109 0.332 0.071
0.000 0.000 0.000 0.000 0.000 0.000 0.000 0.000 0.015
M9 0.077 0.061 0.062 0.062 0.051 0.050 0.051 0.332 -0.007
0.008 0.037 0.035 0.035 0.082 0.084 0.080 0.000 0.822
M11 0.010 0.034 0.037 0.037 0.054 0.052 0.055 0.071 -0.007
0.737 0.240 0.210 0.210 0.067 0.075 0.050 0.015 0.822
Notes: The table shows the size of the paired correlations between the accounting and media
measures, and the corresponding significance levels (p-values presented below each correlation)
based on the sample of 1,175 banks. ‘M1,’ ‘M2,’ … ‘M11’ stand for Measure 1, Measure 2…
Measure 11, respectively. The correlations which are statistically significant at the 5% or 1%
significance levels are highlighted. Measure 10 is omitted from the table since no paired correlations
29
Table 3: Expectation-Prediction analysis of each accounting measure
Panel A: Measure 1 Panel B: Measure 2
Predicted Actual Predicted Actual
(number) Healthy Distressed (number) Healthy Distressed
Healthy 978 49 Healthy 913 43
Distressed 140 8 Distressed 205 14
Panel C: Measure 3 Panel D: Measure 4
Predicted Actual Predicted Actual
(number) Healthy Distressed (number) Healthy Distressed
Healthy 917 43 Healthy 917 43
Distressed 201 14 Distressed 201 14
Panel E: Measure 5 Panel F: Measure 6
Predicted Actual Predicted Actual
(number) Healthy Distressed (number) Healthy Distressed
Healthy 846 37 Healthy 843 37
Distressed 272 20 Distressed 275 20
Panel G: Measure 7 Panel H: Measure 8
Predicted Actual Predicted Actual
(number) Healthy Distressed (number) Healthy Distressed
Healthy 849 37 Healthy 1,111 55
Distressed 269 20 Distressed 7 2
Panel I: Measure 9 Panel J: Measure 10
Predicted Actual Predicted Actual
(number) Healthy Distressed (number) Healthy Distressed
Healthy 1,117 57 Healthy 1,118 57
30
Table 4: Prediction Power of each accounting measure
Percentage of Distressed Banks
Number of Correct Predictions
Percentage of
Correct Predictions Sensitivity Specificity
Measure 1 13% 986 84% 14% 87%
Measure 2 19% 927 79% 25% 82%
Measure 3 18% 931 79% 25% 82%
Measure 4 18% 931 79% 25% 82%
Measure 5 25% 866 74% 35% 76%
Measure 6 25% 863 73% 35% 75%
Measure 7 25% 869 74% 35% 76%
Measure 8 1% 1,113 95% 4% 99%
Measure 9 0% 1,117 95% 0% 100%
Measure 10 0% 1,118 95% 0% 100%
Measure 11 5% 1,175 100% 100% 100%
Notes: ‘Percentage of Distressed Banks’ represents the percentage of banks identified as distressed
out of the total number of examined banks by each accounting measure. ‘Number of Correct
Predictions’ equals the sum of correctly identified healthy and distressed banks by each accounting
measure relative to the media benchmark measure. The ‘Percentage of Correct Predictions’ presents
the percentage of correctly identified healthy and distressed banks out of the total number of
examined banks. The measure of sensitivity identifies the percentage of correctly identified distressed
banks out of the total number of de facto distressed banks included in the sample. The measure of
specificity identifies the percentage of correctly identified healthy banks out of the total number of de