Int. J. Electrochem. Sci., 14 (2019) 7758 – 7772, doi: 10.20964/2019.08.26
International Journal of
ELECTROCHEMICAL
SCIENCE
www.electrochemsci.org
Electrochemical Capacitive Characteristics of TiO2 Coated on
Vertically Aligned Carbon Nanotubes
Haylay Ghidey Redda*, Ruei-San Chen, Wei-Nien Su
Graduate Institute of Applied Science and Technology, National Taiwan University of Science and Technology, Taipei 10607, Taiwan
*E-mail: [email protected]
Received: 23 February 2019 / Accepted: 22 May 2019 / Published: 30 June 2019
Vertically aligned carbon nanotubes (VACNTs) were successfully grown onto stainless steel sheet (SUS) substrate at 750 ℃ by thermal chemical vapor deposition (TCVD) technique and were used as an electrode of the electric double-layer capacitor (EDLC). To grow VACNTs/SUS, Al (20 nm) was used as a buffer layer and Fe (5 nm) as a catalyst layer. To enhance the EDLC capacity, rutile phase of TiO2 nanoparticles were deposited onto VACNTs by using radio-frequency magnetron sputtering technique with a target of TiO2 in argon atmosphere without heating substrate. The as-prepared VACNTs/SUS and TiO2/VACNTs/SUS were characterized with scanning electron microscopy (SEM), energy dispersive spectroscopy (EDS), transmission electron microscopy (TEM), Raman spectroscopy and X-ray diffraction (XRD). The carbon nanotubes are found randomly oriented and approximately perpendicular to the surface of the SUS substrate. Raman spectroscopy results revealed that the crystalline structure of TiO2 onto the surface of VACNTs was rutile. The electrochemical properties of EDLCs with VACNTs and TiO2/VACNT composite electrodes were evaluated by cyclic voltammetry (CV) and galvanostatic charge-discharge using a three-electrode configuration system in 0.1 M KOH aqueous electrolyte solution at room temperature. The electrochemical measurements of electrode materials confirmed that the composition of TiO2/VACNTs/SUS exhibited much higher specific capacitance (1289 F/g) compared to the pure VANCTs/SUS (606) at a scan rate of 0.01 V/s. These results indicate that the VACNTs/SUS and TiO2/VACNT/SUS could be a candidate for advanced nanotechnology and electrochemical double-layer capacitor (EDLC) applications.
Keywords: Vertically aligned carbon nanotubes (VACNTs), Electrochemical double-layer capacitors (EDLCs), Titanium oxide (TiO2).
1. INTRODUCTION
device characteristics, including super-capacitor and batteries to achieve high energy densities, high specific surface area, and high electronic conductivity, electrochemical capacitance, and stability of an electrode [1-3]. Based on the nature of the energy storage mechanism, super-capacitors can be classified into electrochemical double-layer capacitors (EDLCs) and pseudo-capacitor [4-5]. The capacitances of EDLC and pseudo-capacitor are generated from the non-faradic and faradic process, respectively [6]. Compared with pseudo-capacitors, EDLCs have a long life span because of no phase changes and due to non-Faradic process characteristics. Nowadays, EDLC is a major green resource and environmentally friendly, which its energy is stored in the form of an electrical charge in the electrical double layer at the electrode/electrolyte interface and exhibit long life cycle, high specific surface area, high rate performance, and high energy characteristics [7-8]. The electrochemical performance of EDLCs capacity mainly depends on the properties of their electrode materials. Carbon materials, polymers and transition metal oxides in various forms have been used as active materials/electrode materials of EDLC device. Among numerous active electrode materials, carbon-based materials have been extensively used as electrode materials of EDLCs because of their effective surface area, good electronic conductivity, low reactivity, great cycle stability and relatively low cost [9-12]. Among carbon allotropes, vertically aligned carbon nanotubes (VACNTs) are considered as an electrode of EDLCs because of their high surface area, high conductivity, relatively low-cost production process, electrochemical properties, mechanical strength, high thermal and chemical stability [13]. Due to the unique physical and chemical properties, VACNTs are the most popular and promising materials as active materials for developing carbon-based EDLCs.
Various approaches and mechanisms have been used to synthesize of VACNTs with different morphologies on different substrates, such as thermal chemical vapor deposition [14-15], water-assisted chemical vapor deposition [16-17], dc plasma enhanced chemical vapor deposition [18] and microwave plasma enhanced chemical vapor deposition [19]. Among different approaches and mechanisms, thermal chemical vapor deposition (TCVD) method is the most widely used to control the length, diameter, alignment, purity, density, and orientation of VACNTs [6, 20]. Various substrates have been used to grow of VACNTs, such as aluminum foils [21], planar carbon substrate [22], graphite substrate [23], silicon substrate [24] and graphene paper [25]. However, the specific capacitance values of the device were low, for instance, the specific capacitance of EDLC using VACNTs grown directly on metal was about 21.57 F/g [26] and carbon nanotube electrodes grown on nanoporous alumina templates was 126 F/g [27]. To address the above limitations and to enhance the performance of EDLC characteristics conducting substrates are the most suitable to prepare the electrodes [28].
specific capacitance because of the oxidation states, multi-electron transfer during redox and due to the formation of various hierarchical structures and porosity [35]. In addition, transition metal oxide composites have shown improvements on the specific capacitance due to increasing the surface area in the double-layer surface. Among the various transition metal oxides studied, titanium oxide materials have used to improve the capacitance of the EDLC capacity because of their low cost, low toxicity, higher electrical conductivity, high surface area, electrochemical stability, natural abundance and environmental safety [43]. Here, rutile phase of TiO2 nanoparticles and VACNTs are used to enhance the EDLCs characteristics.
In this study, we propose and demonstrate the VACNTs with an aqueous solution of electrolyte that improves the performance of EDLCs in the standard three-electrode configuration system. VACNTs were synthesized onto Fe/Al coated SUS substrate through the TCVD technique using C2H2 gas. To enhance the specific capacitance of EDLCs, rutile phase of TiO2 nanoparticles were deposited onto VACNTs using the radio-frequency magnetron sputtering techniques. The performance of the EDLC was evaluated by using cyclic voltammetry (CV) and galvanostatic charge-discharge. The structures and morphologies of the resulting VACNTs before coating and after coating TiO2 were characterized and analyzed.
2. EXPERIMENTAL METHODS
2.1. Substrate preparation
The commercial SUS 304 thickness 1 mm SUS was cut into the square substrate of 1.0 cm2 with a 0.5 cm long arm reserved for electrical connection. Generally, the SUS 1 × 1 cm2 in size was used as the substrate. The SUS substrates were cleaned in an ultrasonic bath with acetone and alcohol sequentially for 20 minutes and then washed with de-ionized water, consequently dried by the air pump. Finally, the substrates were introduced into the electron beam evaporation system.
2.2. Preparation of Fe/Al films
The SUS samples were fixed onto the holder and placed into an electron beam evaporation system (PEVA-500E Advanced System Technology) and the holder ration was kept at a constant speed of 10 rpm to enhance the deposition layer flatness. When the chamber pressure was pumped to 8 × 10⁻⁷
Table 1. Fe/Al film evaporation condition.
Substrate Base pressure (Torr) Holder ration (rpm)
Evaporation rate (Å/second)
Fe/Al thickness (nm)
SUS 8 × 10⁻⁷ 10 0.1 5/20
2.3. Synthesis of VACNTs
The VACNTs were synthesized in a quartz tube furnace at 750 ℃ by TCVD method. For synthesis VACNTs, Al (20 nm) and Fe (5 nm) thin films were deposited onto SUS by e-beam evaporation method. The Fe/Al/SUS samples were then placed into the middle quartz tube furnace with the base pressure of 2 × 10⁻² Torr and heated up to 750 ℃. Next, the Fe/Al/SUS samples were annealed
in a quartz tube furnace at 750 ℃ for 60 minutes to form Fe catalyst nanoparticles. After annealing time (60 minutes), VACNTs were grown by introducing C2H2 with a flow rate of 3 𝑠𝑐𝑐𝑚 into the quartz tube furnace at working pressure 35 × 10−1 Torr for 20 minutes at 750 ℃. Through the assistance of Fe (as
[image:4.596.52.549.97.153.2]catalyst layer) and Al (as buffer layer) coating on the SUS substrate by the e-beam evaporation method, controlled growth of highly populated VACNTs can be achieved and we denoted the resulting sample as VACNT/SUS. The VACNTs growth conditions are summarized in Table 2.
Table 2. Summary of VACNTs growth conditions.
Substrate Fe/Al (nm)
Base pressure
Annealing temperatur e (℃)
Annealin g Time (min)
Growth temperature (℃)
Carbon source
Working Pressure (Torr)
Growth time (min)
SUS 5/20 2 × 10⁻² 750 60 750 C2H2 35 × 10−1 20
2.4. Rutile phase of TiO2 deposition on VACNTs
To improve the performance of EDLC capacity, rutile phase of TiO2 nanoparticles were deposited directly over the prepared VACNTs surface under ultrahigh vacuum conditions by radio-frequency magnetron sputtering method in an argon atmosphere. The general deposition conditions were working pressure of 3 × 10⁻¹ Torr, radio-frequency power was 70 ℃ in a sputtering machine equipped with a
mechanical pump that allows achieving a base pressure from 60 × 10−3~ 65 × 10−3 Torr in the vacuum
[image:4.596.47.555.430.501.2]
Table 3. Summary of TiO2 nanoparticles formation condition.
Sample Base pressure (Torr)
Target Working gas (sccm)
Working pressure (Torr)
radio-frequency power (℃)
Growth time (min) VACNTs/SUS 60 × 10−3~65
× 10−3
TiO2 Ar 3 × 10⁻¹ 70 180
2.5. Characterizations
The surface morphologies and chemical composition of the VACNTs and TiO2/VACNT composites were examined using scanning electron microscopy (SEM, Hitachi S-3000H) equipped with an energy dispersive spectroscopy (EDS) system. Transmission electron microscopy (TEM) was used to analyze the internal structure of the electrode. X-ray diffraction (XRD, Goniometer D8, KV = 40, MA = 40 with Cu Kα radiation source 𝜆 = 0.154056 nm) was used to analyze the crystalline structures of VACNTs and TiO2/VACNT composites. Raman spectroscopy (TRIAX 550) with 532 nm laser excitation also was used to observe the quality of the VACNTs and to ensure the rutile phase type of TiO2 nanoparticles deposited on VACNT surface.
2.6. Electrochemical measurements
The EDLC measurements were tested by a three-electrode or a two-electrode configuration system [44-45]. Here, the electrochemical properties of the active materials/electrodes were evaluated using cyclic voltammetry (CV) and galvanostatic charge-discharge techniques using an electrochemical analyzer equipped with the Noval software at room temperature. In addition, a three-electrode configuration system was used in 0.1 𝑀 KOH electrolyte. Both VACNTs and TiO2/VACNT composites were used directly as working electrodes, a platinum wire was used as counter electrode and Ag/AgCl (saturated aqueous solution KCl) was used as a reference electrode at room temperature. In addition, the cyclic voltammetry (CV) tests were conducted over a voltage range from −0.3 𝑡𝑜 0.3 𝑉 at different scan rates (from 0.01 𝑡𝑜 0.03 𝑉/ 𝑠) and the galvanostatic charge-discharge measurement was conducted under at a constant current of 1 𝑚𝐴 in the electrolyte of 0.1 𝑀 KOH and the potential range was from −0.3 𝑡𝑜 0.3 𝑉.
3. RESULTS AND DISCUSSION
3.1. Influence of catalyst layer deposition onto the SUS substrate
of VACNTs grown by TCVD depend on the annealing time, grown time, thickness of the Fe film and size of Fe nanoparticles [14].
3.2. Morphological analyses of VACNT and TiO2/VACNT
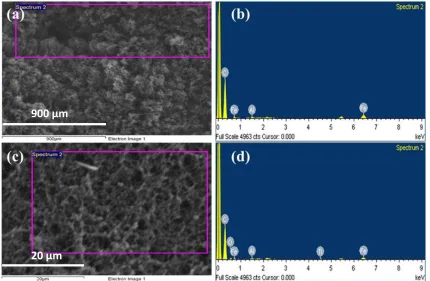
The surface morphologies of VACNTs and TiO2/VACNT composites are very important for the application of EDLCs systems. The external morphologies of VACNTs and TiO2/VACNT composite were observed by SEM. Fig. (2) shows the SEM image of VACNTs and TiO2/VACNT composites. The top-view of VACNTs/SUS revealed that they were randomly oriented onto the SUS substrate as shown in Figs. 2(a). Fig. 2(c) shows the sectional view of the VACNTs/SUS. It reveals that the cross-sectional view of the VACNTs shows the nanotubes are approximately perpendicular to the surface of the SUS substrate.
Figure 1. (a) SEM image spectrum of VACNTs, (b) EDS spectrum of VACNTs, (c) SEM image spectrum of TiO2/VACNT composites and (d) EDS spectrum of TiO2/VACNT composites.
The length of VACNT was about 45 µm with a growth time of 20 min. Moreover, the growth of CNTs depends on the catalyst particle spacing [47-48]. In our experiment also, the length and forest of VACNT depend on the initial thickness of Fe (5 nm) and Al (20 nm) and the growth of time. It can be seen the initial phase of the synthesis procedure, the initial catalyst depositions and the growth time affect the height of the VACNTs [49-50].
900 μm
[image:6.596.89.519.297.578.2]
Figure 2. SEM images of (a) the top-view of VACNTs/SUS, (b) the top-view of TiO2/VACNT/SUS, (c) the cross-sectional image of VACNTs/SUS and (d) the cross-sectional image of TiO2/VACNT/SUS.
Figure 3. (a) TEM image of VACNTs at 50 nm, (b) TEM image of VACNTs at 20 nm and (c) electron diffraction pattern of VACNTs.
3 μm 3 μm
[image:7.596.102.500.454.716.2][image:8.596.88.504.315.442.2]
To enhance the capacitance of EDLC capacity, rutile phase of TiO2 was coated onto VACNTs by radio-frequency magnetron sputtering method. Radio-frequency magnetron sputtering method is a good sputtering method for this application due to its ability to produce highly uniform and large-scale film deposition. The top-view of TiO2/VACNT composites also randomly oriented as shown in Fig. 2(b). Fig. 2(d) shows the cross-sectional view of TiO2/VACNT composites. The rutile phase of TiO2 nanoparticles were maintained to activate the side profiles of VACNTs and to increase the specific surface area in the double-layer interface. Fig. (3) shows the TEM images of VACNTs. The lattice spacing between adjacent walls of the VACNT has been determined to be 0.34 nm as shown in Fig. 3(b), which is in good agreement with layer spacing of graphite (002) plane and it shows the good crystalline structure. Fig. 3(c) shows the selected area diffraction pattern, which reveals the ring pattern.
Table 4. The weight and the atomic percentage of VACNTs, TiO2/VACNTs, Fe nanoparticles and Al nanoparticles of EDS spectrum.
Sample Element Weight % Atomic %
VACNTs
C 75.12 93.09
Al 0.98 0.54
Fe 23.90 6.37
TiO2/VACNTs
C 75.74 89.80
Al 0.82 0.43
Fe 15.55 3.97
O 5.83 5.19
Ti 2.06 0.61
3.3. X-ray diffraction (XRD) analyses of VACNT and TiO2/VACNT
carbide, and tantalum carbide are suitable to enhance the capacity of EDLC device due to their physical properties, displays high electrical conductivity and chemical stability [52]. These results indicate that TiO2/VACNT composites were strongly increased the capacitance of EDLC due to the titanium oxides deposited onto VACNTs and pseudo-capacitive properties.
3.4. Raman analysis
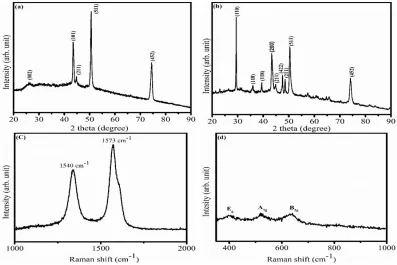
Raman analysis was done to check the purity and the quality of VACNTs/SUS and in order to confirm the rutile phase of TiO2 deposited onto VACNTs/SUS. Figs. 4(c) and 4(d) show the Raman spectra of the VACNTs/SUS and TiO2/VACNT/SUS, respectively. Raman spectroscopy was conducted with 532 nm wavelength laser in a spectral region from 1000-2000 cm-1.
From Fig. 4(c), VACNTs have D-band at 1340 cm-1 indicates the breathing modes of the ring [17] and the G peak (1573 cm-1) or the order peak is due to the graphitic crystallinity of the pristine carbon atoms that make up the carbon nanotubes [18] and the band based on the relative motion of sp3 carbon atoms, all these are happening without the coating of TiO2. The intensity ratio of the D and G band was 0.78 in the Raman spectrum of VACNTs. This result indicates that the disorder of the VACNTs onto SUS substrate is low and the materials highest crystalline content. The intensity of the D band often referred to as the defect or disorder band [53]. Fig. 4(d) shows the Raman spectrum of TiO2/VACNT composites. Fig. 4(d) shows the Raman spectrum TiO2/VACNT composites and the rutile phase of TiO2 peaks are observed Eg at 401 cm-1, A1g at 520 cm-1 and B2g at 640 cm-1. Hence, the TiO2/VACNT composites were successfully synthesized on the surface of the SUS substrates.
[image:9.596.100.497.447.712.2]
3.5. Electrochemical analysis of VACNTs and TiO2/VACNT composites 3.5.1. Cyclic voltammetry (CV) analysis
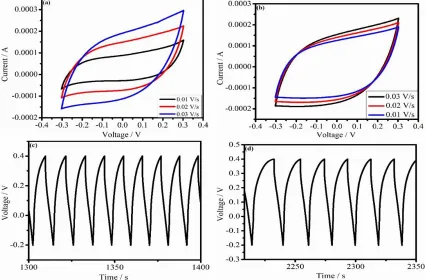
In order to verify whether the VACNTs and TiO2/VACNT composites were suitable for EDLC, electrochemical measurements have been carried out using CV and galvanostatic charge-discharge techniques by three-electrode configuration method. Figs. 5(a) and 5(b) show the CV curves of the VACNTs and TiO2/VACNT composites in 0.1 𝑀 KOH aqueous electrolyte solution at different scan rates 0.01 𝑉/𝑠, 0.02 𝑉/𝑠 and 0.03 𝑉/𝑠, respectively. The CV curve of VACNTs and TiO2/VACNT composites exhibit nearly rectangular shape at a scan rate of 0.01 𝑉 ⁄ 𝑠 with potential window ranging from −0.3 𝑉 ~ 0.3 𝑉. The rectangular-type CV and symmetry in anodic and cathodic directions are the indications of ideal capacitor behavior of the electrode materials and it produces large current [2]. In addition, the rectangular-type CV indicating good charge propagation of the non-faradaic charging (EDLCs) characteristic and low contact resistance between the electrode and substrate. The feature also shows highly capacitive nature with good ionic response [54,55]. On the other hand, the CV curve area increases with increasing sweep rate, which reveals the capacitive behaviors of the electrodes. In addition, the specific capacitance increases with increasing linear current and sweep rate indicate that the charge is primarily non-faradic in nature. These characteristics make them valuable candidates as the EDLC electrodes. The specific capacitances of VACNTs and TiO2/VACNT composites are calculated from the CV curves according to the following equation,
C𝑠𝑝 = ∫ 𝐼(𝑣)𝑑𝑉
2×∆𝑉×𝑚×𝑠 … (1)
where 𝐼(𝑉) is the instantaneous current in CV, 𝐶𝑠𝑝 (F/g) is the specific capacitance, ∫ 𝐼(𝑉)𝑑𝑉 is
electrodes were good and the electrodes have low internal resistance [2,56]. To obtain the specific capacitances of the electrode from the galvanostatic charge-discharge, the triangular method was used.
The specific capacitance was evaluated from the charge-discharge curves according to the following equation by,
Csp = 𝐼∆𝑡
∆𝑉×𝑚 … (2)
where 𝐼 is the applied constant current, ∆𝑡 is the elapsed time in discharging, 𝑚 is the total mass of the electrode (including positive and negative electrode), ∆𝑉 is the potential window.
Figure 5. The CV curve of (a) VACNTs/SUS, (b) TiO2/VACNT/SUS, (c) the charge-discharge curve of VACNTs and (d) the charge-discharge curve of TiO2/VACNT composites in 0.1 𝑀 KOH aqueous solution and with fixed current 1 𝑚𝐴.
The specific capacitance values reported for all samples have been calculated using the active mass of VACNTs and TiO2/VACNT composites in the working electrode. According to the Eq. 2 the specific capacitance of VACNTs and TiO2/VACNT composites from the charge-discharge curves are 763 F/g and 917 F/g, respectively (see Table S2 in the supporting information for more details). The enhanced the specific capacitance value obtained from the charge-discharge of TiO2/VACNT composites is highly increased due to the coated of pseudo-capacitive rutile phase type of TiO2.
[image:11.596.87.513.212.492.2][image:12.596.56.549.218.426.2]
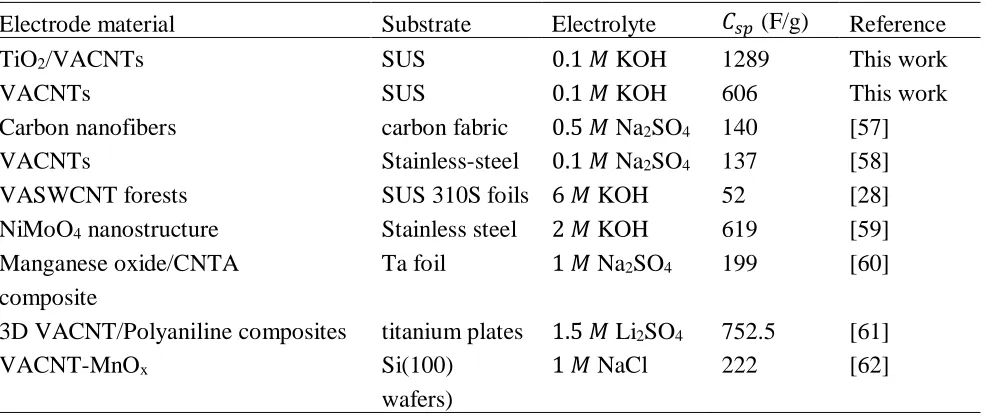
capacitances. In addition, the speed of charge and discharge is limited to the speed with which the ions move within the electrolyte because of electrolytes have high ionic conductivity and show fast charge-discharge, due to these reasons the specific capacity depends on the electrolyte concentration. Compared with other materials as shown in Table 5, VACNTs and TiO2/VACNT have a larger specific surface area and specific capacitance.
Table 5. Comparison of substrates, electrolyte and the specific capacitances (𝐶𝑠𝑝) of different electrode materials
Electrode material Substrate Electrolyte 𝐶𝑠𝑝 (F/g) Reference
TiO2/VACNTs SUS 0.1 𝑀 KOH 1289 This work
VACNTs SUS 0.1 𝑀 KOH 606 This work
Carbon nanofibers carbon fabric 0.5 𝑀 Na2SO4 140 [57]
VACNTs Stainless-steel 0.1 𝑀 Na2SO4 137 [58]
VASWCNT forests SUS 310S foils 6 𝑀 KOH 52 [28]
NiMoO4 nanostructure Stainless steel 2 𝑀 KOH 619 [59]
Manganese oxide/CNTA composite
Ta foil 1 𝑀 Na2SO4 199 [60]
3D VACNT/Polyaniline composites titanium plates 1.5 𝑀 Li2SO4 752.5 [61]
VACNT-MnOx Si(100)
wafers)
1 𝑀 NaCl 222 [62]
4. CONCLUSIONS
In this study, we synthesized vertically aligned carbon nanotubes (VACNTs) successfully using a bi-layer Fe/Al catalyst and using the decomposition of C2H2 onto SUS substrate at 750 ℃ by thermal chemical vapor deposition (TCVD) method. To enhance the specific capacitance of EDLC capacity, the rutile phase of TiO2 nanoparticles were deposited on VACNTs via radio-frequency magnetron sputtering method and resulted in increased surface area of the device. The morphological and structure analyses of VACNTs and TiO2/VACNT composites were observed by SEM, EDS, TEM, XRD and Raman spectroscopy. From the SEM observation, the cross-sectional view of VACNT shows the nanotubes are approximately perpendicular to the surface of the SUS substrate and the height of nanotubes were about 45 µm long. The length and diameter of the VACNTs depend on the thickness of the Fe and Al catalyst deposition onto SUS substrate and on the growth time.
ACKNOWLEDGMENTS
This work was financially supported by the Ministry of Science and Technology, Taiwan, R.O.C. SUPPORTING INFORMATION
Calculation of electrochemical parameters of electrochemical double-layer capacitors (EDLCs) The electrochemical measurements of the EDLCs were carried out in a three-electrode configuration system at room temperature. The specific capacitances of VACNTs and TiO2/VACNT composites are calculated from the cyclic voltammetry (CV) curves according to the following equation,
𝐶𝑠𝑝 = ∫ 𝐼(𝑣)𝑑𝑉
2×𝑚×𝑠×∆𝑉 ... (1)
where 𝐼(𝑣) is the instantaneous current in CV, 𝐶𝑠𝑝 (F/g) is the specific capacitance, ∫ 𝐼(𝑣)𝑑𝑉 is the area of the CV under the I-V curve, ∆𝑉 is the potential window, 𝑚 is the total mass of the electrode (including positive and negative electrode (g)) and 𝑠 is the potential sweep rate or the potential scan rate (V/s).
Table S1. Parameters of electrochemical double-layer capacitors (EDLCs) to calculate the specific capacitance from CV curves.
Sample Active mass (g)
Area of CV curves
Scan rate (V/s)
∆𝑉 (V)
𝐶𝑠𝑝 (F/g)
VACNTs 1 × 10⁻⁵ 7.275 × 10⁻⁵ 0.01 6 × 10⁻¹ 606
TiO2/VACNTs 2 × 10⁻⁵ 3.094 × 10⁻⁴ 0.01 6 × 10⁻¹ 1289
The specific capacitances of VACNTs and TiO2/VACNT composites are also calculated from the charge-discharge curves according to the following equation
𝐶𝑠𝑝 = 𝐼×∆𝑡
𝑚×∆𝑉 ... (2)
where 𝐼 is the applied constant current, ∆𝑡⁄∆𝑉 calculated from the slope of the charge-discharge curve and 𝑚 is the total mass of the electrode (including positive and negative electrode (g)).
Table S2. Parameters of electrochemical double-layer capacitors (EDLCs) to calculate the specific capacitance form the charge-discharge curves.
Sample Active mass (g)
∆𝑡 ∆𝑉⁄ (s/V)
𝐼 (Ampere)
𝐶𝑠𝑝 (F/g)
VACNTs 1 × 10⁻⁵ 7.63 1 × 10⁻³ 763
[image:13.596.80.517.392.466.2] [image:13.596.89.506.680.752.2]
References
1. H. Zhang, X. Yu and P.V. Braun, Nat. Nanotechnol., 6 (2011) 277.
2. R.M. Silva, A.C. Bastos, F.J. Oliveira, D.E. Conte, Y. Fan, N. Pinna and R.F. Silva, J. Mater. Chem. A, 3 (2015) 17804.
3. L. Guan, L. Yu and G.Z. Chen, Electrochim. Acta, 206 (2016) 464. 4. L.L. Zhang and X.S. Zhao, Chem. Soc. Rev., 38 (2009) 2520.
5. H. Chen, L. Wu, K. Zhang, A. Qin and S. Chen, Int. J. Electrochem. Sci., 13 (2018) 12437. 6. H. Zhang, J. Wang, Q. Shan, Z. Wang and S. Wang, Electrochim. Acta, 90 (2013) 535.
7. R. N. A. R. Seman, M. A. Azam and M. A. Mohamed, Adv. Nat. Sci: Nanosci. Nanotechnol., 7 (2016) 045016.
8. P. Sharma and T.S. Bhatti, Energy Convers. Manag., 51 (2010) 2901.
9. B. François, P. Volker, B. Andrea and F. Elzbieta, Adv. Mater., 26 (2014) 2219. 10.J. Hou, C. Cao, F. Idrees and X. Ma, ACS Nano, 9 (2015) 2556.
11.G.P. Pandey, S.A. Hashmi and Y. Kumar, Energy Fuels, 24 (2010) 6644.
12.J.V.S. Moreira, E.J. Corat, P.W. May, L.D.R. Cardoso, P.A. Lelis and H. Zanin, J. Electron. Mater., 45 (2016) 5781.
13.B. Kim, H. Chung and W. Kim, J. Phys. Chem. C, 114 (2010) 15223.
14.S. Rezaee, A. Ghaderi, A. Boochani and S. Solaymani, Results Phys., 7 (2017) 3640.
15.H. Sato, Y. Hori, K. Hata, K. Seko, H. Nakahara and Y. Saito, J. Appl. Phys., 100 (2006) 104321. 16.T. Yamada, A. Maigne, M. Yudasaka, K. Mizuno, D.N. Futaba, M. Yumura, S. Iijima and K. Hata,
Nano Lett., 8 (2008) 4288.
17.B.K. Gupta, G. Kedawat, A.K. Gangwar, K. Nagpal, P.K. Kashyap, S. Srivastava, S. Singh, P. Kumar, S.R. Suryawanshi, D.M. Seo, P. Tripathi, M.A. More, O.N. Srivastava, M.G. Hahm and D.J. Late, AIP Adv., 8 (2018) 015117.
18. D.Q. Duy, H.S. Kim, D.M. Yoon, K.J. Lee, J.W. Ha, Y.G. Hwang, C.H. Lee and B.T. Cong, Appl. Surf. Sci., 256 (2009) 1065.
19.Y.C. Choi, Y.M. Shin, Y.H. Lee, B.S. Lee, G.-S. Park, W.B. Choi, N.S. Lee and J.M. Kim, Appl. Phys. Lett., 76 (2000) 2367.
20.Y.-M. Shyu and F.C.-N. Hong, Mater. Chem. Phys., 72 (2001) 223.
21.I.B. Dogru, M.B. Durukan, O. Turel and H.E. Unalan, Prog. Nat. Sci.: Mater. Int., 26 (2016) 232. 22.X. Liu, K.H.R. Baronian and A.J. Downard, Carbon, 47 (2009) 500.
23.M. Chhowalla, K. B. K. Teo, C. Ducati, N. L. Rupesinghe, G. A. J. Amaratunga, A. C. Ferrari, D. Roy, J. Robertson and W. I. Milne, J. Appl. Phys., 90 (2001) 5308.
24.H.-B. Lian, K.-Y. Lee, K.-Y. Chen and Y.-S. Huang, Diam. Relat. Mater., 18 (2009) 541. 25.S. Li, Y. Luo, W. Lv, W. Yu, S. Wu, P. Hou, Q. Yang, Q. Meng, C. Liu and H.-M. Cheng, Adv.
Energy Mater., 1 (2011) 486.
26.R. Shah, X. Zhang and S. Talapatra, Nanotechnology, 20 (2009) 395202. 27.S. Wen, M. Jung, O.-S. Joo and S.-i. Mho, Curr. Appl. Phys., 6 (2006) 1012. 28.M.A. Azam, A. Fujiwara and T. Shimoda, Int. J. Electrocyhem. Sci, 8 (2013) 3902.
29.C.J. Lee, D.W. Kim, T.J. Lee, Y.C. Choi, Y.S. Park, Y.H. Lee, W.B. Choi, N.S. Lee, G.-S. Park and J.M. Kim, Chem. Phys. Lett., 312 (1999) 461.
30.J. Liu, J. Essner and J. Li, Chem. Mater., 22 (2010) 5022.
31.Y. Jiang, P. Wang, X. Zang, Y. Yang, A. Kozinda and L. Lin, Nano Lett., 13 (2013) 3524.
32.S. Talapatra, S. Kar, S.K. Pal, R. Vajtai, L. Ci, P. Victor, M.M. Shaijumon, S. Kaur, O. Nalamasu and P.M. Ajayan, Nat. Nanotechnol., 1 (2006) 112.
36.B. Senthilkumar, R. K. Selvan, D. Meyrick and M. Minakshi, Int. J. Electrochem. Sci., 10 (2015) 185.
37.Y. Bai, L. Lu, J. Bao, G. Sun, B. Zhang, J. Zeng and S. Chen, Int. J. Electrochem. Sci., 14 (2019) 606.
38.Z. Sun, Z. Liu, B. Han, S. Miao, J. Du and Z. Miao, Carbon, 44 (2006) 888. 39.B. Tao, J. Zhang, F. Miao, S. Hui and L. Wan, Electrochim. Acta, 55 (2010) 5258.
40.M. Xie, X. Sun, H. Sun, T. Porcelli, S.M. George, Y. Zhou and J. Lian, J. Mater. Chem. A, 4 (2016) 537.
41.Z. Lei, F. Shi and L. Lu, ACS Appl. Mater. Interfaces, 4 (2012) 1058.
42.F. Konstantinou, A. Shougee, T. Albrecht and K. Fobelets, J. Phys. D: Appl. Phys., 50 (2017) 415503.
43.A. Ramadoss and S. J. Kim, Int. J. Hydrog. Energy, 39 (2014) 12201.
44.R.B. Rakhi, W. Chen, D. Cha and H.N. Alshareef, Nano Lett., 12 (2012) 2559.
45.X. Wang, R.S. Chandrabose, S.-E. Chun, T. Zhang, B. Evanko, Z. Jian, S.W. Boettcher and G.D. Stucky, X. Ji, ACS Appl. Mater. Interfaces, 7 (2015) 19978.
46.W. Winadda, K. Mitsuhiro, I. Takashi, Y. Norihiro, M. Tomoaki, M. Toshiya, H. Shin-ichi, O. Kenjiro, K. Kenji, H. Hiroshi, Jpn. J. Appl. Phys., 44 (2005) 457.
47.L. Zhang, Y. Tan and D.E. Resasco, Chem. Phys. Lett., 422 (2006) 198. 48.X. Cui, W. Wei, C. Harrower and W. Chen, Carbon, 47 (2009) 3441.
49.B. Kim, H. Chung, K.S. Chu, H.G. Yoon, C.J. Lee and W. Kim, Synth. Met., 160 (2010) 584. 50.Y.-S. Lin, K.-Y. Lee, K.-Y. Chen and Y.-S. Huang, Appl. Surf. Sci., 256 (2009) 1042.
51.V. Thirumal, A. Pandurangan, R. Jayavel, S.R. Krishnamoorthi and R. Ilangovan, Curr. Appl. Phys., 16 (2016) 816.
52.Y. Zhong, X. Xia, F. Shi, J. Zhan, J. Tu and H. J. Fan, Adv. Sci., 3 (2016) 1500286.
53.A. Szabó, E. Kecsenovity, Z. Pápa, T. Gyulavári, K. Németh, E. Horvath and K. Hernadi, Sci. Rep., 7 (2017) 9557.
54.A. Ramadoss, T. Kim, G.-S. Kim and S. J. Kim, New J. Chem., 38 (2014) 2379. 55.D. Kasprzak, I. Stępniak and M. Galiński, J. Solid State Electrochem., 22 (2018) 3035. 56.Q. Sun, T. Jiang, G. Zhao and J. Shi, Int. J. Electrochem. Sci., 14 (2019) 1.
57.Y. Gao, G. P. Pandey, J. Turner, C. R. Westgate and B. Sammakia, Nanoscale Res. Lett., 7 (2012) 651.
58.H. A. Moreno, S. Hussain, R. Amade and E. Bertran, Mater. Res. Express, 1 (2014) 035050. 59.V. Kannan, H.-J. Kim, H.-C. Park and H.-S. Kim, Nanomaterials, 8 (2018) 563114.
60.H. Zhang, G. Cao, Z. Wang, Y. Yang, Z. Shi and Z. Gu, Nano Lett., 8 (2008) 2664.
61.S. Jiao, T. Li, Y. Zhang, C. Xiong, T. Zhao and M. Khan, RSC Adv., 6 (2016), 6, 110592–110599 62.W. Shi, X. Zhou, J. Li, E. R. Meshot, A. D. Taylor, S. Hu, J.-H. Kim, M. Elimelech and D. L.
Plata, Environ. Sci. Technol. Lett., 5 (2018) 692.