comment
reviews
reports
deposited research
interactions
information
refereed research
Research
Permutation-validated principal components analysis of
microarray data
Jobst Landgrebe*, Wolfgang Wurst*
and Gerhard Welzl
Addresses: *Max Planck Institute of Psychiatry, Molecular Neurogenetics, Kraepelinstrasse 2-10, 80804 Munich, Germany. Institute of Mammalian Genetics and Institute of Biomathematics and Biometry, GSF-National Research Center for Environment and Health, Ingolstädter Landstrasse 1, D-85764 Neuherberg, Germany.
Correspondence: Gerhard Welzl. E-mail: [email protected]
Abstract
Background: In microarray data analysis, the comparison of gene-expression profiles with respect to different conditions and the selection of biologically interesting genes are crucial tasks. Multivariate statistical methods have been applied to analyze these large datasets. Less work has been published concerning the assessment of the reliability of gene-selection procedures. Here we describe a method to assess reliability in multivariate microarray data analysis using permutation-validated principal components analysis (PCA). The approach is designed for microarray data with a group structure.
Results: We used PCA to detect the major sources of variance underlying the hybridization conditions followed by gene selection based on PCA-derived and permutation-based test statistics. We validated our method by applying it to well characterized yeast cell-cycle data and to two datasets from our laboratory. We could describe the major sources of variance, select informative genes and visualize the relationship of genes and arrays. We observed differences in the level of the explained variance and the interpretability of the selected genes.
Conclusions:Combining data visualization and based gene selection, permutation-validated PCA enables one to illustrate gene-expression variance between several conditions and to select genes by taking into account the relationship of between-group to within-group variance of genes. The method can be used to extract the leading sources of variance from microarray data, to visualize relationships between genes and hybridizations and to select informative genes in a statistically reliable manner. This selection accounts for the level of reproducibility of replicates or group structure as well as gene-specific scatter. Visualization of the data can support a straightforward biological interpretation.
Published: 22 March 2002
GenomeBiology2002, 3(4):research0019.1–0019.11
The electronic version of this article is the complete one and can be found online at http://genomebiology.com/2002/3/4/research/0019 © 2002 Landgrebe et al., licensee BioMed Central Ltd
(Print ISSN 1465-6906; Online ISSN 1465-6914)
Received: 12 December 2001 Revised: 31 January 2002 Accepted: 15 February 2002
Background
Microarrays have become standard tools for gene expression analysis as the messenger RNA levels of thousands of genes can be measured in one assay. In a standard microarray experiment, total RNA or mRNA is extracted from cells or tissue, labeled by reverse transcription with radioactive or
such experiments, different experimental conditions can be compared to each other. In many cases, different conditions are analyzed with some replications to allow variance analy-sis [1,2]. This procedure results in multivariate grouped data in which one group represents a condition with several repli-cates. Such data can be represented as a matrix with nrows (genes) and p columns (hybridizations) and a vector of length pcontaining the group labels. These data are charac-teristic of multi-condition microarray experiments.
To analyze such data, multivariate statistics are needed. Before carrying out the analysis, the data must be pre-processed by background subtraction, computation of ratios and array-wise normalization. After this step, the data can be analyzed using different multivariate approaches. These methods can be classified as supervised and unsupervised. A wide variety of supervised approaches have been described, for example, classification and regression trees [3] or support vector machines [4]. Among unsupervised methods, hierarchical clustering [5] and other clustering approaches [6,7], as well as projection methods such as multidimen-sional scaling [8], principal components analysis (PCA) [9-13] and correspondence analysis [14] have been described. Such projection techniques reduce the dimen-sionality of multivariate data to embed the variables and objects of the data in a visualizable (two- or three-dimen-sional) space. The projection aims to represent the objects and variables in the reduced space in such a way that they approximate their original distances in the high-dimensional space. This enables one to extract and visualize the domi-nant effects on variance from the data. With PCA, linear combinations (principal components) of the original vari-ables can thus be functionally interpreted (for review see [15]). This enables a biological interpretation of the nature of coherent variation.
In microarray experiments, the identification of subsets of genes with large variation between groups is of primary inter-est. This process has to comprise a criterion that accounts for the variance within groups. Sometimes this selection is only the first step in the data analysis. Hastie et al. [16] carried out hierarchical clustering of gene-expression data and computed an average expression profile for each cluster, providing the input for a response model. A direct significance analysis to select genes from microarray data (SAM) was proposed by Tusher et al. [17]. This method is based on t-like (in the case of two conditions) or F-like statistics.
Several methods for gene selection involving PCA have been proposed. The gene shaving approach of Hastie et al. [10] restricts PCA to the first principal component. Groups of genes are generated by iterative exclusion of fixed fractions of genes (typically 10%) with smallest absolute loadings according to the first principal component. After orthogonal-ization of the data with respect to an averaged expression profile of the first group, the procedure is repeated. Another
PCA-based method of gene selection using PCA-derived gene coefficient vectors and F-statistics was described by Landgrebe et al. [18].
Although these methods allow the detection of patterns or characteristic nodes by dimension reduction and the selec-tion of gene subsets with large variaselec-tion between condiselec-tion groups, the reliability of the results has to be determined. Therefore, it is imperative to assess whether the results are statistically reliable relative to the level of noise in the data. Classical statistical parametric tests depend on the assump-tions of normality and independence of variables (hybridiza-tions). Yet, these assumptions do not hold for microarray data [1,19]. Consequently, computationally intensive methods such as permutation tests or bootstrap procedures as introduced by Efron [20] are preferable. Kerr et al. [1] show the application of bootstrap technique to clustering results. Ghosh [21] describes another approach based on mixture modeling to assess the reliability of clustering results. Other permutation-based approaches were pub-lished by Tusher et al. [17] and Dudoit et al. [3]. The method proposed by Hastie et al. [10] also contains bootstrap ele-ments. An approach of Wall et al. [22] tries to combine PCA-based gene selection with a confidence measure using leave-one-out cross-validation.
Here we describe an approach combining PCA-directed gene selection with validation by permutation tests. We use a test statistic based on the genes object scores to select genes with high variance with respect to the principal components. The method was developed for the analysis of microarray data having several conditions with a few replicates per con-dition or a group structure. We demonstrate this approach by applying it to the well-characterized data of Spellman et al. [23]. Although other methods are better adapted to the analysis of temporal effects (for example [24]), we chose the yeast data to allow comparison with other approaches applied to this dataset [14,23]. In addition, two datasets gen-erated in our own laboratory were also analyzed. Our method was successfully applied to the different datasets. We revealed the main sources of variance in the data and described the genes related to this variance. This allowed the interpretation of variance and the permutation-validated selection of genes in a functional context.
Results
Permutation-test-validated PCA
comment
reviews
reports
deposited research
interactions
information
refereed research
are not correlated to each other. The central point of such analysis is to decompose the original n xpdata matrix (n
objects, pvariables) in the following manner:
X= AFT,
where Xis the n xpdata matrix, A is the n xpmatrix of factor scores and F is the px p matrix of factor loadings. With s = p factors the total variance of all variables is explained. The decomposition of X is done in such a way that the factors explain the total variance in a descending order. Therefore, it is possible to reduce the data to s dimen-sions with a minimum loss of information expressed by the matrix of residuals E:
X=A~F~T+ E,
where à is the n x s matrix of factor scores, F~ the p x s
matrix of factor loadings and E is the matrix of residuals as a result of dimension reduction. In this manner, PCA provides a projection of the objects from p-dimensional to s -dimen-sional space.
In grouped data with replicates per group (condition), there is additional information about the columns of the data matrix: y= (y1,y2,...,yp) is a set of class labels identifying the
replicates for each condition. Although PCA is generally not considered to be appropriate for grouped data, the method has been adapted for this data type (rank-ordered PCA [25]).
The consecutive steps of the permutation validated PCA pro-cedure are shown in Figure 1. In step 1, we perform rank-ordered PCA based on the polished gene expression matrix
X(see Materials and methods) by computing separate one-way ANOVAs on the principal components loadings for each of the components. If the between-group variance dominates the total variability in the data, PCA discriminates between groups. In this situation, the first components of the PCA and components with high F-values are identical. Thus, fol-lowing the order of explained variance, we select the compo-nents with significant F-statistics (p£0.01). At the occurrence of a component with nonsignificant F-statistics, we terminate the selection. This process results in k compo-nents (step 2). Data approximated in the space based on these components reflect the between-group variance. Thus, in step 3 of the procedure, we compute components from the group-averaged data and derive the exact between-group variance for each gene, which can be estimated by:
1 k s2
g = p- 1 a2gi, i=1
where agiis the factor score for gene g and component i. As a
test value, we use tg= (p- 1)s2g (step 3). Genes with a high
value are candidates for selection.
To assess the reliability of the results we perform a permuta-tion analysis (steps 4-6). Under the hypothesis of no effect of different conditions on gene expression profiles, the class labels given by yare randomly sampled to determine the per-mutation distribution of the required test statistics. Comput-ing PCAs from randomized group-averaged data yields the distribution of the test statistic Tgfor each gene g(step 4):
k Tg = (p-1)s2g= a2gi.
i=1
We compute 1,000 permutation distributions for each gene (step 5). In step 6 we select the genes for which tgis greater
than the 95% quantile of the permutation distribution of
Tg. The last step is the visualization of the arrays and
selected genes in the reduced k-components space. If k= 2, a twofold visualization is suggested. The biplot with marked selected genes can be used to relate genes and con-ditions. Genes lying near an axis of a condition are upregu-lated in this hybridization and genes lying in the opposite direction are repressed. With several conditions, this rela-tion is generally not unique. Therefore, the visualizarela-tion may be supported by color-coded expression-profile tables. Here, the data matrix is rearranged according to the angular distance from the x-axis for each gene (rearranging
nrows). The same is done for hybridizations (rearranging
[image:3.609.311.553.94.339.2]pcolumns). If k> 2 several biplots and color-coded tables must be constructed.
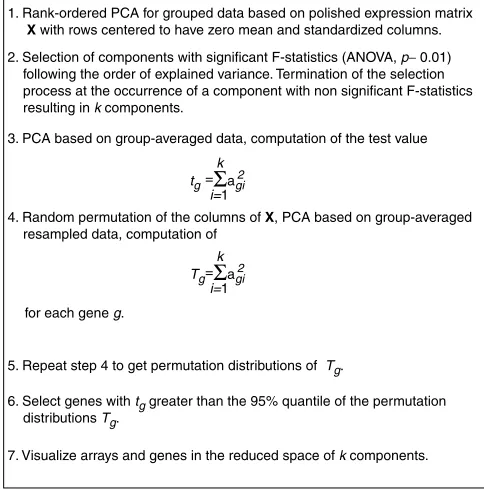
Figure 1
The permutation-validated PCA procedure for grouped data.
1. Rank-ordered PCA for grouped data based on polished expression matrix X with rows centered to have zero mean and standardized columns.
2. Selection of components with significant F-statistics (ANOVA, p≤ 0.01) following the order of explained variance. Termination of the selection process at the occurrence of a component with non significant F-statistics resulting in k components.
3. PCA based on group-averaged data, computation of the test value
4. Random permutation of the columns of X, PCA based on group-averaged resampled data, computation of
for each gene g.
5. Repeat step 4 to get permutation distributions of Tg.
6. Select genes with tg greater than the 95% quantile of the permutation distributions Tg.
7. Visualize arrays and genes in the reduced space of k components.
Σ
tg agi k
2 i=1 =
Σ
Tg agiApplication to yeast cell-cycle data
To demonstrate our approach, we applied it to the yeast cell-cycle data published by Spellman et al. [23]. These authors synchronized the yeast cell cycle using independent methods of cell-cycle arrest and measured the expression of all yeast open reading frames (ORFs) at different time points after the cell-cycle synchronization. They identified genes related to the cell cycle using Fourier transformation and correlation measures. We analyzed the cell-cycle-related genes selected by Spellman et al. [23] to demonstrate the relationship between cell-cycle phases and gene-expression patterns and to select a subset of genes that show the highest and most reproducible variance across the cell-cycle phases. We ana-lyzed the expression patterns of 773 selected genes over all 73 hybridizations.
The cell cycle is a temporal continuum that is generally grouped into cell-cycle phases. This classification was also carried out by Spellman et al. [23]. The classification of
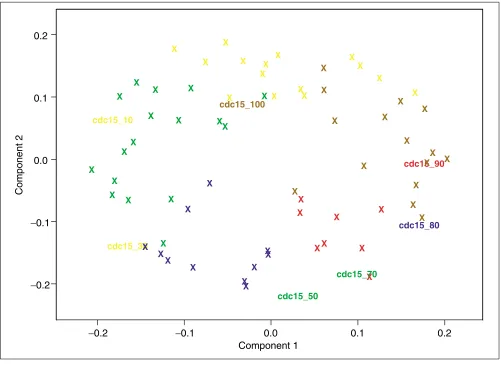
genes in cell-cycle phase groups enables one to analyze the variance of gene expression across the cell-cycle phases and to select genes with different and robust regulation. We ana-lyzed the data using permutation-validated PCA. A first PCA was based on the polished logarithmic ratios including all arrays. An analysis of variance (ANOVA) using the variable loadings as dependent variables and the classification-derived cell-cycle phase groups as factors was carried out. The first two components were highly significant whereas the others were not. Figure 2 shows a plot of the first two compo-nent loadings against each other. Of the datas variance, 37.2% was explained by the first two components. The plot shows that the resulting ordination of the hybridizations cor-responds to the assignment of cell-cycle phases by Spellman
[image:4.609.55.556.329.695.2]et al. [23]. The angular position of the hybridizations in the plot reflects their correct temporal situation in the cycle. The first seven arrays of the CDC series seem to be misclassified. They are shown with colored labels in Figure 2 and show a counterclockwise shift in expression in the cell cycle. Thus,
Figure 2
PCA of the cell-cycle data. Plot of the first two components’ loadings against each other. Crosses or gene names represent the variable (hybridization) loadings. Colors indicate the cycle phase to which the hybridizations were classified by Spellman et al. [23]. M/G1, yellow; G1, green; S, blue; G2, red; M, brown. The labeled arrays are misclassified CDC hybridizations assigned to new cell-cycle phases by PCA.
−
0.2
−
0.1
0.0
0.1
0.2
Component 1
Component 2
−
0.2
−
0.1
0.0
0.1
0.2
X X
X
X
X
X
X
X X
X X
X
X
X
X
X
X X cdc15_100
cdc15_10
cdc15_30
cdc15_50
cdc15_70
cdc15_80
cdc15_90
X
X X
X
X
X
X X X
X
X X
X
X X
X
X X
X
X
X
X
X
X X
X X
X
X
X
X
X
X
X
X X X
X
X
X
X
X
X X
X
X X
the first two components approximate the cell-cycle aspect of the data quite well and could be interpreted as cell-cycle com-ponents. They reflect the main temporal aspect of the data.
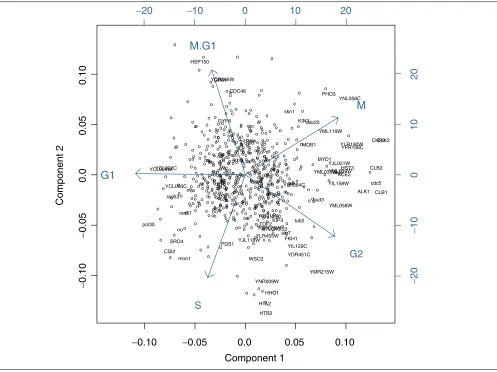
A second PCA was carried out on the group-averaged data using the original cell-cycle classification with two compo-nents (94.4% explained variance). Figure 3 shows a biplot of the 773 gene scores and the five cell-cycle phase group load-ings. For each gene the distance to the origin indicates the variance in the reduced two-dimensional space. The hole in the middle of the plot reflects the fact that only genes related to the cell cycle were chosen by Spellman et al. [23]. Genes without variance with respect to the cell cycle (equally tran-scribed in most cell-cycle phases) would lie in the middle of the biplot. In Figure 3, 60 genes are labeled with gene symbols. These genes had a test value above the 95% per-centile of the permutation distribution of the related test sta-tistic. Figure 3 allows the assignment of the genes to the
cell-cycle phases in which they are regulated. As illustrated by Figures 3 and 4, in the cell-cycle phase M/G1, CDC46
(encoding part of the replication complex) was selected as an upregulated gene, whereas the histone genes HTB2, HTA2
and HHO1(also marked by Spellman et al. [23] and Fellen-berg et al. [14]) were selected as downregulated genes. In phases G1 and S, POL30(replication complex) and RAD51
[image:5.609.56.553.318.690.2](cell-cycle-related protein kinase) were selected. The histone genes repressed in M/G1 were upregulated in S. In G2 and M, CLB1 (G2/M-specific cyclin involved in mitotic induc-tion), CDC5 (mitotic DNA replication) and CLB2 (G2/M-specific cyclin involved in mitotic induction) were selected as upregulated, in phase M CDC20(cyclin degradation, part of the anaphase-promoting complex). Thus, among the known genes selected by our algorithm, many play a crucial role in the cell cycle. As described by Spellman et al. [23], the microarray expression data confirm the results of other gene expression studies. comment reviews reports deposited research interactions information refereed research Figure 3
PCA of the grouped cell-cycle data. Biplot of gene scores and cell-cycle phase group loadings according to the first two components of the PCA. The open circles or gene names represent the gene scores. The vectors represent the cell-cycle phase group (variable) loadings. The biplot enables the association of genes with the cell-cycle phase groups. Labeled genes were selected by permutation test.
Component 1
Component 2
−
0.10
−
0.05
0.0
0.05
0.10
−
0.10
−
0.05
0.0
0.05
0.10
ACE2 o o o o o o o alg7 ALK1 o o o o o o o o o o o o o o o o o o o o o bud3 o o o o o o o o o cdc20 o o CDC46 o cdc5 o o o o o CHS2 o o o o o CLB1 CLB2 o o o o o o o o o CSI2 o o o o o o o o CYK2 o o o o o o o o o o o o o o o o o o o o o o o o o o o o o o o o o FKH1 o o o o o o o o o o o o o o o o o o GPA1 o o GYP6 o o o o o HHO1 o o o o HOS3 o o o o HSP150 HST3 o o HTA2 o o HTB2 o o o o o o o o o o o o o o o o o o o KIN3 o o KIP3 o o o o o o o o o o o o o o o o o o o o o o o o o o o o o o o o mnn1 MOB1 o o o o o o o o MYO1 o o o o o o o o o o o o o o o o o o o o o o o o o o PDS1 o o o o o o o o o PHO3 o o o o o o o o o o o o o o o o o o pol30 o o o o o o o o o o o o o o o rad51 rad53 o o o o o o o o o o o o o o o o o o o o o o o oo o o o o o o o o o o skn1 o o o o o o o o o o o o o o o o o o o SRO4 o o o o o o o o o o o STU2 o o o o o o o o o swi5 o o o o o o o o TOF2 o o o o o o tub2 o o o o o o o o o o o o WSC2 o o o o o o o o o o o o o o o o o o o o o o o o o o o o o o o o o YCL022C o YCL024W o o YCL060C o o o o o o o o o o o o o o o o o o o o o o o o o o o o o o o o o o o o o o o YDR451C o o o o o o o o o o o o o o o o o o o o o o o o o o o o o o o o o o o o o o o o o o o o o o o o o o o o o o o o o o o o o o o o o o o o YIL129C o o o YIL158W o o YIR010W o o o o YJL051W o o o o YJL118W o o o o o o o o o o o o o o o o o o o o o o o o o o o o o o o o o o o o o o o o o o o o o o o o YLR084C o o o o o o o o YLR190W o o o o o o o o o o o o o o o YLR455W o o o o o o oo YML033WYML034W o YML058W o o o YML119W o o o o o o o o YMR215W o o o o o o o o o YNL058C o o o o o o o o o o o o o o o YNR009W o o o o o o o o o o o o o o o oo o YOR066W YOR073W o o o o o o o o o o o o o o o o o o o o o o o o o o o o o o o o o o o o o o o o o o o o o o o o YPR156C o o o o o o o o o o
−
20
−
10
0
10
20
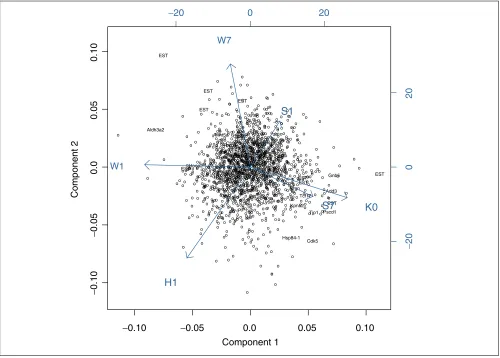
Application to abolition of CRH-R1 function data In this experiment, mRNAs from whole brains of mice of dif-ferent genetic backgrounds which had been treated with an antagonist directed against the ligand-binding domain of a seven-transmembrane neuropeptide receptor [26] (the cor-ticotropin-releasing hormone receptor 1 (CRH-R1) [27]) were compared to mRNAs from brains of mice lacking a functional CRH-R1 (CRH-R1 knockout mice [28]) using cDNA-microarrays (Table 1). The data consist of log2ratios. The matrix had 1,810 complete observations (genes) and 21 hybridizations. We computed a PCA based on the polished matrix of single hybridizations to show that the treatment group members clustered together (data not shown). We performed an ANOVA using the variable loadings as depen-dent variables and the treatment groups as factors. The first two components were highly significant, whereas the third component was not. The first two components explained 37.5% of the datas variance. We carried out PCA for group-averaged data with two components (54.8% explained vari-ance). Figure 5 shows a biplot of these components. The two components describe a gradient effect of the abolition of CRH-R1 function in different genetic backgrounds. Compo-nent 1 (abscissa) distinguishes the CRH-R1 abolition (null mutant) from relatively mild CRH-R1 function impairment (h1, w1: 1 day of treatment with antagonist). With the increasing effect on the animals of gene function impair-ment, the animals loadings on the first component become more similar to the genetic CRH-R1 inactivation. Compo-nent 2 (ordinate) distinguishes between impairment of het-erozygotes treated for 1 day and wild-type animals treated for 7 days (both of 129Ola/CD1 background).
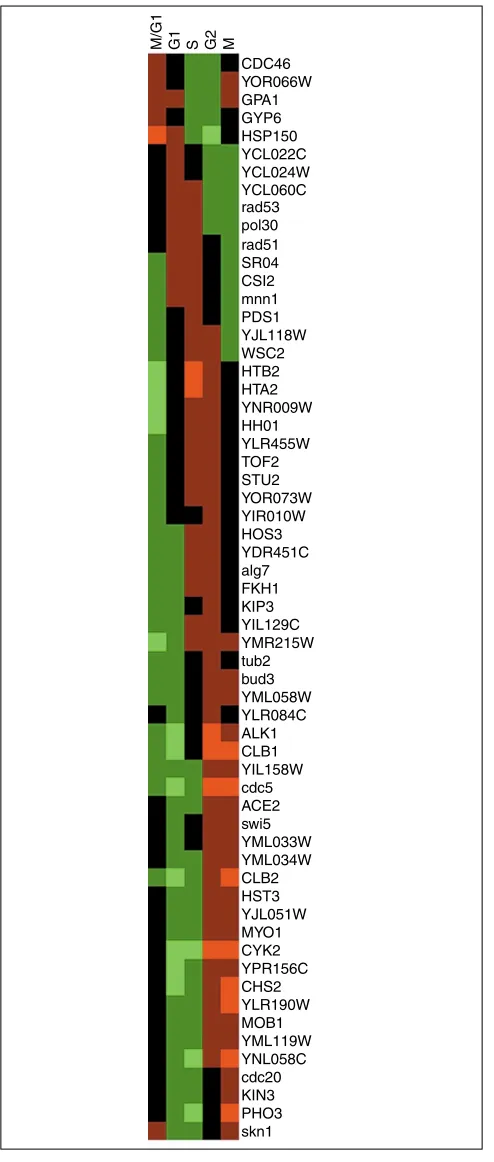
Figure 4
Color-coded expression-profile table of the genes selected from the cell-cycle data by permutation test. Abscissa, cell-cell-cycle phase groups; ordinate, genes. The cycle phase groups and the genes are arranged according to the angular position in the PCA biplot (see Figure 3). Upregulation, red; downregulation, green. The figure was generated using Michael Eisen’s software TreeView [4].
CDC46
M/G1 G1 S G2 M
YOR066W GPA1 GYP6 HSP150 YCL022C YCL024W
rad53 YCL060C
[image:6.609.313.554.507.685.2]pol30 rad51 SR04 CSI2 mnn1 PDS1 YJL118W WSC2 HTB2 HTA2 YNR009W HH01 YLR455W TOF2 STU2 YOR073W YIR010W HOS3 YDR451C alg7 FKH1 KIP3 YIL129C YMR215W tub2 bud3 YML058W YLR084C ALK1 CLB1 YIL158W cdc5 ACE2 swi5 YML033W YML034W CLB2 HST3 YJL051W MYO1 CYK2 YPR156C CHS2 YLR190W MOB1 YML119W YNL058C cdc20 KIN3 PHO3 skn1
Table 1
Hybridizations performed in the CRH-R1 abolition experiment
Genotype (symbol) Treatment (days) Group ID N
129Ola/CD1 knockout (k) 0 k0 4
129Ola/CD1 heterozygous (h) 0 h0 4
129Ola/CD1 heterozygous (h) 1 h1 5
129Ola/CD1 wild type (w) 0 w0 4
129Ola/CD1 wild type (w) 1 w1 4
129Ola/CD1 wild type (w) 7 w7 3
129SvJ wild type (s) 0 s0 4
129SvJ wild type (s) 1 s1 3
129SvJ wild type (s) 7 s7 2
Total 33
Because long-term-treated wild-type animals of 129SvJ background (s7) are similar to the knockout animals, treat-ment seems to have a strong effect in these animals. Animals with a 129Ola/CD1 background (group w7) show a weaker response to treatment with the antagonist. Both components describe abolition-of-function effects in a background-dependent manner. Thus, given a particular genetic background, treatment with an antagonist against CRH-R1 can mimic the genetic abolition of gene function. A comparable phenomenon was shown in yeast by Hughes
et al. [29].
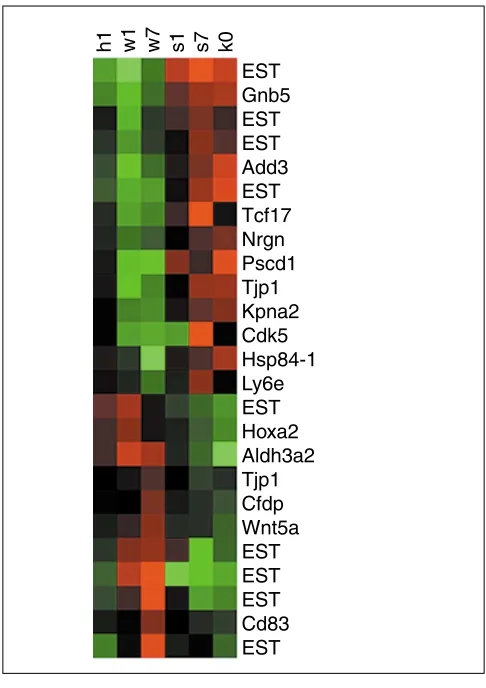
Only 25 genes were selected by permutation tests and are labeled with gene symbols in Figure 5. These genes show high variance across the treatment groups and are highly reproducible. Only genes that contrast the groups k0 and s7 on one side and in the groups w1 and w7 on the other side are selected. The profiles of these genes are illustrated in Figure 6 and support the interpretation of the biplot.
Application to antidepressant data
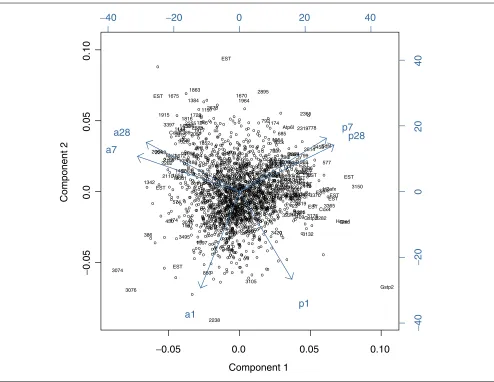
In this experiment, 29 12-week-old male mice of 129SvJ background were treated with mirtazapine, paroxetine or vehicle for 1, 7 or 28 days (Table 2). cDNA microarrays were used to measure the mRNA expression in total brain homogenates of these animals. The data consist of log2ratios. The matrix had 2,190 complete observations (genes) and 24 hybridizations. We computed a PCA based on the polished matrix of single hybridizations to show that the treatment groups were ordinated together (data not shown). We per-formed an ANOVA using the variable loadings as dependent variables and the treatment groups as factors. The first two components were highly significant. They explained 36.3% of the datas variance and the object (gene) scores with respect to these two components were used to compute the variance of genes according to the group differences.
We carried out a PCA with group-averaged data and two components (72.1% explained variance). Figure 7 shows a
[image:7.609.55.555.87.445.2]comment reviews reports deposited research interactions information refereed research Figure 5
PCA of the grouped CRH-R1 function abolition data. Biplot of gene scores and treatment group loadings according to the first two components of the PCA. The open circles or gene names represent the gene scores. The vectors represent the treatment group (variable) loadings. The biplot enables the association of genes with the treatment groups. Labeled genes were selected by permutation test.
Component 1
Component 2
−0.10 −0.05 0.0 0.05 0.10
− 0.10 − 0.05 0.0 0.05 0.10 o o o o o o o
oo o o o o EST o oo o o o o o o o o o o o o o o o o o o o o o o o o o o o o o o o oo o o o o o o o o o o o o o o o o o o o o o o o o o o o o o o o o o o o o o o o Cdk5 o o o o o o o o o o o o o o o o o o oo o o o o o o o o o o o o o o o o o o o o o o o o o o o o o o o o o o o Cfdp o o o oo o o o o o o o o o o o o o o o o o o o o o o o o o o o o o o o o o o o o o o o o o o o o o o o o o o oo o o o o o o o o o o o o o o o o o o o o o oo o o o Tjp1 o o o o o o o o o o Cd83 o o o o o o o o o o o o o o o o o o o o o o o o o o o o o o o o o o o o o o o o o o o o o o o o o o o o o o o o o o o o o o o o o o o o o o o o o o o o o o o o o o o o o o o o o o o o o o o o o o o o o o o o o o o o o o o o o o o o EST o o o o o o o o o o o o o o o o o o o o o o o o o o o o o o o o o o o o o o o o o o o o o o o o o o o o o o o o o o o o o o o o o o o o o o o o o o o o o o o o o o o o o o o o o o o o o o o o o o o o o o o o o o o o o o o o o o o o o o o o o o o o o o o o o o o o o o o o o o o o o o o o o o o o o o o o o o
o o o
o o o o o o o o o o o o o o o o o o o o o o o o o o o o EST o o o o o o o o o o o o o o o o o o o o o o o o o o o o o o o o o o o o o o o o o o o o o o o o o o o o o o o o o o o o o o o o o o o o o o o o o o o o o o o o EST o o o o o o o o o Kpna2 o o o o o o o o o o o o o o o o o o o o o o o o o o o o o o o o o o EST o o o o o o o o o o o o o o o o o o o o o o o o o o o o o o o Wnt5a o o o o o o o o o o o o o o o o o o o oo o o o o o o o o o o o o o o o o o o o o o o o o o o o o o o o o o o o o o o o o o o o o o o o o o o o Hooa2 oo
o o o o o o o o o o o o o o o o o o o o o o o o o o o o o o o o o o o o o o o o o o o o o o o o o o o o o o o o o o o o o o o o o o o o o o o o o o o o o o o o o o o o o o o o o o o o o o o o o o o o o o o o o o o o o o o o o o o o o o o o o o o o o o o o o o o o o o o o o o o o o o o o o o o o o o Add3 o o o o o o o o o o o o o o o o o o o o o o o EST o o o o o o o o o o o o o o o o o o o o o o o o o Tcf17 o o o o o o o o o o o o o o Aldh3a2 o o o o o o o o o o o o o o o o o o o o o o o o o o o o o o o o o o o o o o Pscd1 o o o o o o o o o o o o o o o o o o o o o o o o o o o o o
o o o o o o o o o o o o o o o o o o o o o o o o o o o o o o
o o o
o o o o o o o o o o
o o o o o o o o o o o o o o o o o o o o o o o o o o o o o o o o o o o o o o o o o o o o o o o o o o o o o o o o o o o o o o o o o o o o o o o o o o o o o o o o o o o o o o o o o o o o o o o o o o o o Hsp84-1 o o o o o o o o o o o o o o o o o o o o o o o o o o o o o o o o o o o o o o o o o o o o o o o o o o o o o o o o o o o o Nrgn o o o o o o o o o o o o o o oo o o o o o o o o o o o o o o o o o o o o o o o o o o o o o o o o o o o o o o o Gnb5 o o o o o o o o o o o o o o o o o o o o o o o o o oo o o o o o o o o o o o o o o o o o o o o o o o o o o Ly6e o o o o o o o o o o o o o o o o o o o o o o o o o o o o o o o o o o o o o o o o o o o o o o o o o o o o o o o o o o o o o o o o o o o o o o o o o o o o o o o o o o o o o o o o o o o o o o o o o o o o o o o o o o o o o o o o o o o o o o o o o o o o o o o o o o o o o o o o o o o o o o Tjp1 o o o o o o o o o o o o o o o o o o o o o o o o o o o o o o o EST o o o o o o o o o o o o o o o o o o o o o o o o o o o o o o o o o o o o o o o o o o o o o o o o o o o o o o o o o o o o o o oo o o o o o o o o o o o o o EST o o o o o o o o o o o o o o o o o o o o o o o o o o o o o o o o o o EST o o o o o o o o o o o o o o o o o o o o o o o o o o o o o o o o o o o o o o o o o o o o o o o o o o o o o o o o o o o o o o o o o o o o o o o o o o o o o o o o o o o o o o o o o o o o o o o o o o o o o o o o o o o o o o o o o o o o o o o o o o o o o o o o o o o o o o o o o o o o o o o oo o
−20 0 20
biplot of these components with 127 selected genes at the 95% percentile (labeled with numbers) and 30 genes at the 99% percentile (labeled with gene symbols). The compo-nents describe the effects of antidepressant treatment on the mouse brain. The first component (abscissa) discerns treat-ment with mirtazapine (a) from treattreat-ment with paroxetine (p). This component can be interpreted as the drug-type effect. The second component discerns short (1 day) from longer (7 or 28 days) treatment and can be interpreted as the treatment duration effect. Figure 8 shows the 30 genes selected at the 99% percentile in a color-coded expression table. These genes strongly reflect the treatment type and duration effect.
Discussion
Here we propose a method for analyzing microarray data with group structure imposed by different conditions. We combine the visualization focused on the variance of genes
between groups and gene selection, taking into account the within-group variance. Based on PCA, this method is able to visualize relationships between hybridizations by dimension reduction. Yet, data visualization via a biplot allows more than biological interpretation of the components. After appropriate data preprocessing, searching for genes with changes in expression patterns across the groups can be based on the genes (objects) distance from the centroid of the biplot. This distance is proportional to the variance of genes in the dimension-reduced space. A correspondence analysis would give a similar result [14]. But a selection of genes must be accompanied by an assessment of whether the results are statistically reliable relative to the level of noise in the data. Whereas classic statistical tests (like t- and F-statistics) are based on assumptions concerning distribution and variable independence that do not hold for microarray data [1,19] the permutation-validation procedure presented here makes no assumption about the dependence of gene-expression mea-surement within the expression matrix X. Therefore, gene-specific scatter is taken into consideration by calculating the test-value permutation distributions for each gene under the null hypothesis of no group-structure effect in the expression profiles. Another method for validating PCA results using a leave-one-out approach (Wall et al. [22]) is very global, and can only be applied when the conditions correspond to a con-tinuous parameter, such as time or dose.
[image:8.609.54.297.85.429.2]The last step of the permutation-validated PCA procedure concerns the visualization and the interpretation of the selected genes according to their importance in a biological context. In the case of two dimensions (k = 2), a color-coded expression profile can be generated by rearranging the selected genes and the arrays with respect to angular distances in the biplot. When looking at a biplot showing several vari-able loadings, a given object (gene) has to be projected on all Figure 6
Color-coded expression-profile table of the genes selected from the CRH-R1 function abolition data by permutation test. Abscissa, treatment groups; ordinate, genes. The treatment groups and the genes are arranged according to the angular position in the PCA biplot (see Figure 5). Upregulation, red; downregulation, green.
EST
h1
w1
w7
s1
s7
k0
Gnb5
EST
EST
Add3
EST
Tcf17
Nrgn
Pscd1
Tjp1
Kpna2
Cdk5
Hsp84-1
Ly6e
EST
Hoxa2
Aldh3a2
Tjp1
Cfdp
Wnt5a
EST
EST
EST
Cd83
EST
Table 2
Design of the antidepressant experiment
Drug Treatment (days) Group ID N
Mirtazapine 1 a1 3
Mirtazapine 7 a7 3
Mirtazapine 28 a28 5
Paroxetine 1 p1 5
Paroxetine 7 p7 5
Paroxetine 28 p28 3
Vehicle 28 c28 5
Total 29
[image:8.609.314.556.545.694.2]different variables (conditions) to understand its pattern with regard to all of them. A color-coded expression-profile table may support this visual interpretation. As a further develop-ment of the method described here, we envisage cluster analysis of the selected genes for higher dimensions (k> 2).
The application of permutation-validated PCA to microarray data shows that the basic sources of variance could be extracted from all datasets: The components computed from the Spellman et al. [23] yeast data described the cell cycle and allowed ordinations of the hybridizations according to their temporal situation in the cell cycle. Arrays misclassified by the Fourier transformation [23] were assigned to shifted positions in the cell cycle (this was also achieved by corre-spondence analysis [14]). The components computed from the abolition of CRH-R1 function experiment described a
gradient of increasing functional impairment depending on the genetic background of the animals. The analysis of the antidepressant data also shows how principal components led to an understanding of the fundamental biological phe-nomena captured by the data: here, they discern the types of treatment and the treatment duration.
But there were important differences in the results: whereas the grouped PCA of the cell-cycle data explained 94.4% of the datas variance, the corresponding rates were 72.1% explained variance for the antidepressant data and 54.8% for the CRH-R1 abolition data. In a situation with homogeneous array groups and preselected genes such as the cell-cycle data, the level of explained variance was very high as the components explained the kind of variance the genes were preselected for. For the antidepressant data, no a priori information about
[image:9.609.59.553.85.467.2]comment reviews reports deposited research interactions information refereed research Figure 7
PCA of the grouped antidepressant data. Biplot of gene scores and treatment groups loadings according to the first two components of the PCA. The open circles represent the gene scores. The vectors represent the treatment groups (variable) loadings. The biplot enables the association of genes with the treatment groups. Genes labeled with numbers have test values above the 95% percentile of the permutation distribution; genes labeled with gene symbols have test values above the 99% percentile.
Component 1
Component 2
−
0.05
0.0
0.05
0.10
−
0.05
0.0
0.05
0.10
o o o o o o o 16 o o 22 23 o o o o o o o o o o o o o o o o o o o o o o o o o o o o o o o o o o o o o o o o o o o o o o o o o o o oo o o o
o
o o o
o oo o o o o o o o o o o o o o o o 144 o o o o o o o o o oo o o o o o o o o o o o o o o o o o o o o o o o o o o o o o o o o o o o o o o o o o o o o o o o o o o o o o o o o o o o o o o o o o o o o o o o o o o o o o o EST o o o o o o o o o o o 316 o o o o o o o o o o o o o o o o o o o o o o o o o o 360 o o o o o o o o o o 386 o o o o o o o o o o o o o o o o o o o o o o o o o o o o o o o o o o o o 450 o o o o EST o o o o o o o o 470 o o 474 o o o o o o o o o o o o o o o o o o o o o o o o o o o o o o o o o o o o
oo o
o o o o o o o o o o o o o o o oo o o o o o o o o o o 574 o o 577 o o o o 598 o o o o o o o o o o o o o o o o o o o o o oo o o o o o o o o o o 685 o Nyren18-pending o o o o o o o o o o o o o o 717 o o o o o o o o 736 o o o o o o o o o o o o o o o o o o o o o o o 778 o o o o o o 788 o oo 792 o o o o o o o o o o o o o o o o o o o o o o o o o o o o o o o o o o 850 o o o o o o o o o o o o o o o o o o o o o o o o o o o o o o o o o o o o o o o o o o o o o o o o o o o o o o o o o o o o o o o o o o o o o o o o o o o o o o o o o o o o o o o o o o o o o o o o o o o o o o o o o o o o o o o o o o o o o1050 o
o o o o o o o o o o o o o o o o o o o o oo o o o o 1098 o o o o o o o o o 1116 o o o o o o o o o o o o o o o o o o o Cdh11144 o o o o o o o 1157 o o o o o oo o o o o 1174 o o o o o oo
o o o o o o 1197 o o 1202 1203 o oo o o o o o o o o o o o o o o o o o o o o o o o o 1246o o o o o o o o o o o o o o o o o o o o o o o o o o o o o o o o o o o o o o o o o o 1316 o o o o o o o o o o o o o o o o o o 1342 o o o o o o o o o o o o o o o o o o o o o o o o o o o o 1384 o o o 1389 o o o o o o o o o o o o o o o o o o o o o o o o o o o o o o o o o o 1432 1434 o o o o o o o o o o o o o o o o o o o o o o o o o o o o o o o o 1480 1482 o Mod1 o o o o o o o o o o o o o 1502 o o o o o o o o o o o o o o o o o o o o 1526 o o o o o o o o o o o o o o o o o o o o o o o o o o o o o o o o o o 1599 o 1604 o o o o o o o o o o o o o o o o o o o oo o o o o o o 1652 o o o 1656 o o o o o o 1670 o 1672 o 1675 o o o o o o o o o o o o o o o o o o o o o o o o o o o o o 1722 o 1728 o 1735 o o Cck 1745 1747 o o o o o o o o o o o o o o o o o o o o o o o o o o o o o o o o 1799 o o o o o o o o o o o 1816 o o o o o o o EST o o o o o o o 1848 o o 1852 o o o o 1863 o o o o o o o o o o o o o o o o o o o o o o o o o o o EST o o o 1915 1917 o o o o o o o o o o o o o o o 1954 o o o o o 1964 o o o o 1969 o 1972 o EST o o o o o o 1987 o o o o 1997 o o o o o o o o o o 2015 o o o o o Sirt2 o o o o o o o o o o o o o o 2057 EST o 2063 2064 o o o o o o o o o o o o 2086 o o o o o o o o o o 2108 2110 o o o o o o o o o o 2133 o o o o o o o o o o o o o o o o o o o o o o o o o o o o o o 2181 o o o o o o o o o o o o o o o o o o 2210 o 2215 2216 o o o EST o o o o o o o o o o o 2238 o o o 2248 o o o o o o 2255 o o o o o o EST o o o o o o o o o o o o o o o 2282 o o o o o o o o Mcl1 o o o o o o o o o o o o o o o o H2afx o 2319 2320 o EST o 23252326 o o o o o o o o o o o o o o o o o o o o o 2360 EST 2362 EST EST 2365 2366 o o o o2374 o o o o o o 2396 o o o o Atp6l o o o o o o o o o o o o o o o o o o o o o o o 2449 o o o o o o o o o o o o o o o o o o o o o o o o o o o o o o o o o o o o o o o o o o 2514 o o o o o o o o o o o o o o o o o o o o o o o o o o o o o o o o o o o o o o o o o o o o o o o o o o o o o o 2587 o o o o o o o o o o o o o o o o o o o o o o o o o o o o o o o o o
o o oooo
o o o o o o o o o o o o o 2678o o o o 2685 o o EST o o o o o o o o o o o o o o o EST o o o o o o o oo o o o o o o o o o o o o o o o o o o o o 2760 o o o o o o o o o o o o o o o o o o o o o o o o o o o o o o o o o o o o o o o o o o o o o o o o o o o o 2853 o o o o o o o o o o o o o o o o o o o o o o o o o o o o o o o 2895 2896 o o o o o o o o o o o o o o o o o o o o o o o o o o o o o o o o o o o o o o o o o o o o o o o o o o o o o o o o o o o o o o o o o o o o o o o o 2991 EST o o o o o o o o 3011 o o o o o o o o o o o o o o o o o o o o o o o o o o o o o o o o o o o o o o 3074 3076 o o o 3084 o o o o o o o o o o o o o 3105 o o o o o o o o o o oo o 3132 o o o o o o o o o o o o 3150 o o o o 3175 o o o o o o o o o o o o o o o o o o
o Gstp2 Hspe1 Cox4 o o o o Sdf4 3282 o o o o o o o o o o o o o o o o o o oo o o o Pde6d Gstp2 o 3319 o 3321 oo o o 3331 o o o o o o o o o o o o o o o o o o o o o o o o o 3365 o o o 3369 3370 3371 Ctsd o 3374 o o o o o o o o o o
o o o o o o o 3397 o o o o o o o o o 3409 o o o 3414 o o o o 3420 o o o o o o o o o o o o o o o o o o o o o o o o o o o o o o 3458 o o o o o o o o o o o o o o o o o 3484 o o o o o o o o 3495 o o o o o o o o o o o o o o o o o o o o o o o o o o o o o o o o o o o o o o o o o o o o o 3612 o o o o o 3619 o o o o o
−
40
−
20
0
20
40
the relation of genes to treatment type and duration was avail-able. Thus the level of explained variance was lower (72.1%), although the two components used to build the test statistics still captured a big part of the variance present in the data. Although the material used for the antidepressant treatment data (RNA from total mouse brain homogenates containing a variety of cell types) was more heterogeneous than the clonal yeast cell lines, antidepressant effects on the brains mRNA transcription were so important that clear variance structures emerged in the data. In contrast, the level of explained vari-ance for the CRH-R1 function abolition data was 54.8%. In this experiment, different methods of impairing or abolishing the function of CRH-R1 were used on different mouse genetic
backgrounds. The variance in the experimental design was thus quite high. Heterogeneity within the groups was also higher than in the antidepressant experiment, probably because a selective pharmacologic antagonization of the neuro-modulating peptide CRH [27] had a less pronounced and stereotypic effect on transcription in the brain than the anti-depressant drugs acting on a wide spectrum of neurotrans-mitter receptors, transporters and related enzymes [30]. In this situation of high variance in the experimental design, and a relatively high rate of heterogeneity in the treatment groups, permutation-validated PCA only selected genes reflecting the contrast between the groups w1, w7 on one side and s7 and k0 on the other side because this contrast was captured by the first two components. Other aspects of the data were not captured by PCA. Thus, a multivariate approach trying to compare very different gene expression patterns at the same time might lead to loss of information. In such a case, the selection of genes should be treated with caution and cross-validation by inde-pendent methods should be applied if hypotheses are to be derived from the selected genes. Pairwise comparisons of groups might be more appropriate in such a situation.
In conclusion, permutation-validated PCA can be used to extract the leading source of variance from microarray data, to visualize relationships between genes and hybridizations and to select informative genes in a statistically reliable manner. This selection accounts for the level of reproducibility of repli-cates or group structure as well as gene-specific scatter.
Materials and methods
Sample processing and hybridization
A subset of the data from Spellman et al. [23] was used. To acquire our own data, microarrays were manufactured, mice treated and total brain RNA extracted, labeled and hybridized as described in [18]. Briefly, mice were killed after the end of treatment, RNA was extracted by RNeasy and TRIZOL procedure. Total RNA (100 mg) was fluorescence-labeled by oligo-dT-primed reverse transcription to cDNA in the pres-ence of Cy3-dUTP as described by Eisen and Brown [31]. After reverse transcription, total brain Cy3-labeled cDNA from each animal was hybridized to a microarray. Fluorescence intensity was detected using the Genetic Microsystems GMS 418 Array Scanner. Raw data were assessed with the Spectrum vs.3.2 image-analysis software developed by Chen et al. [32].
Data preprocessing
[image:10.609.54.297.84.498.2]Data from Spellman et al. [23] were also used by Fellenberg et al. [14]; we did not modify the described preprocessing. The two datasets from our lab were preprocessed in the following manner. Matrix rows (genes) with missing observations were excluded from the datasets, resulting in data without missing values. To normalize and compare the different hybridizations to each other, the intensity measured at each spot of the arrays was divided by the centered median of the intensities mea-sured at the corresponding spot in the reference groups. Thus, Figure 8
Color-coded expression-profile table of the genes selected from the antidepressant data by permutation test above the 99% percentile. Abscissa, treatment groups; ordinate, genes. The treatment groups and the genes are arranged according to the angular position in the PCA biplot (see Figure 7). Upregulation, red; downregulation, green.
Gstp2
p7
p28
p1
a1
a7
a28
Gstp2
Ctsd
Hspe1
Cox4
EST
EST
EST
Pde6d
EST
H2afx
EST
EST
EST
EST
EST
EST
Nyren18-pending
EST
every single hybridization was normalized against the refer-ence groups by computing the log2of the ratios (the mean of groups s0, h0 and w0 for the CRH-R1 data and group c28 for the antidepressant data). Therefore, these groups do not appear in Figures 5 to 8. Given an nx pdata matrix, the fol-lowing model [1,2] can be stated:
Xgj= m+ ag+ bj+ dgj+ egj
In this model, Xgiis the log-ratio of gene gunder
experimen-tal condition j, agis the normalizing effect for gene g(row),
bjis the experimental variance effect for j(column), dgjis the
differential gene expression for gene gunder experimental condition jand egjis the random error.
To estimate the interaction term dgj, several other effects must
be controlled: as agreflects the relation of experiment RNA to normalizing RNA and is of no biological interest, it can be con-trolled by mean centering rows. bjreflects the global variance in RNA preparation, labeling efficacy and hybridization quality as well as other sources of experimental variance between the arrays and can be controlled by standardizing the matrix columns. Doing replicates enables control of egj. The
term dgjcan thus be obtained by data polishing [9], that is, the
matrix is iteratively subjected to column standardization and row mean centering until convergence is reached. This pol-ished matrix was used as the basis for multivariate analysis.
Acknowledgements
We thank Claudia Kühne for technical assistance. We thank the GSF-Research Center, the Max-Planck-Gesellschaft and the Volkswagenstiftung for funding.
References
1. Kerr M, Martin M, Churchill G: Analysis of variance in
microar-ray data.J Comp Biol2000, 7:819-837.
2. Ting Lee M, Kuo C, Whitnore G, Sklar F: Importance of replica-tion in microarray gene expression studies: statistical methods and evidence from repetitive cDNA hybridization. Proc Natl Acad Sci USA2000, 97:9834-9839.
3. Dudoit S, Fridlyand J, Speed T: Comparison of discrimination methods for the classification of tumours by using gene expression data expression data processing and modeling. Technical Report 576, Berkeley, CA: University of California at Berke-ley, 2000. Available at [http://www.stat.berkeley.edu/users/terry/zarray/ Html/papersindex.html]
4. Brown M, Grundy W, Lin D, Cristianini N, Sugnet C, Furey T, Ares MJ, Haussler D: Knowledge-based analysis of microarray gene
expression data by using support vector machines.Proc Natl
Acad Sci USA2000, 97:262-267.
5. Eisen M, Spellman P, Brown P, Botstein D: Cluster analysis and
display of genome-wide expression patterns.Proc Natl Acad Sci
USA1998, 95:14863-14868.
6. Tavazoie S, Hughes J, Campbell M, Cho R, Church G: Systematic
determination of genetic network architecture. Nat Genet
1999, 22:281-285.
7. Tamayo P, Slonim D, Mesirov J, Zhu Q, Kitareewan S, Dmitrovsky E, Lander E, Golub T: Interpreting patterns of gene expression with self-organizing maps: methods and application to
hematopoietic differentiation. Proc Natl Acad Sci USA 1999,
96:2907-2912.
8. Bittner M, Meltzer P, Chen Y, Jiang Y, Seftor E, Hendrix M, Radmacher M, Simon R, Yakhini Z, Ben-Dor A, et al.: Molecular classification
of cutaneous malignant melanoma by gene expression
pro-filing.Nature2000, 406:536-540.
9. Holter N, Mitra M, Maritan A, Cieplak M, Banavar J, Fedoroff N:
Fundamental patterns underlying gene expression profiles:
simplicity from complexity. Proc Natl Acad Sci USA 2000,
97:8409-8414.
10. Hastie T, Tibshirani R, Eisen MB, Alizadeh A, Levy R, Staudt L, Chan W, Botstein D, Brown P: Gene shaving as a method for identi-fying distinct sets of genes with similar expression patterns. Genome Biol2000, 1:research0003.1-0003.21.
11. Alter O, Brown P, Botstein D: Singular value decomposition for
genome-wide expression data processing and modeling. Proc
Natl Acad Sci USA2000, 97:10101-10106.
12. Hilsenbeck S, Friedrichs W, Schiff R, O’Connell P, Hansen R, Osborne C, Fuqua S: Statistical analysis of array expression
data as applied to the problem of tamoxifen resistance. J
Natl Cancer Inst1999, 91:453-459.
13. Raychaudhuri S, Stuart J, Altman R: Principal components analy-sis to summarize micorarray experiments: application to
sporulation time series.Pac Symp Biocomput2000:455-466.
14. Fellenberg K, Hauser N, Brors B, Neutzner A, Hoheisel J, Vingron M:
Correspondence analysis applied to microarray data.Proc
Natl Acad Sci USA2001, 98:10781-10786.
15. Krzanowski W: Principles of Multivariate Analysis. Oxford: Oxford Uni-versity Press, 2000.
16. Hastie T, Tibshirani R, Botstein D, Brown P: Supervised harvesting
of expression trees.Genome Biology2001, 2:research0003.1-0003.12.
17. Tusher V, Tibshirani R, Chu G: Significance analysis of
microar-rays applied to the ionizing radiation response.Proc Natl Acad
Sci USA2001, 98:5116-5121.
18. Landgrebe J, Welzl G, Metz T, van Gaalen M, Ropers H, Holsboer F, Wurst W: Molecular characterization of antidepressant effects in the mouse brain using gene expression profiling. J Psychiat Res2002, 36:119-129.
19. Dudoit S, Yang Y, Callow MJ, Speed T: Statistical methods for identifying differentially expressed genes in replicated
cDNA microarray experiments.Technical Report 578. Berkeley,
CA: University of California at Berkeley, 2000. [http://www.stat.berkeley.edu/users/terry/zarray/Html/papersindex.html] 20. Efron B: The bootstrap and modern statistics.J Amer Stat Assoc
2000, 95:1293-1296.
21. Ghosh D, Chinnaiyan AM: Mixture modelling of gene
expres-sion data from microarray experiments.Bioinformatics 2002,
18:275. [http://www.sph.umich.edu/~ghoshd/COMPBIO/mixture1/] 22. Wall M, Dyck P, Brettin T: SVDMAN — singular value
decompo-sition analysis of microarray data.Bioinformatics2001, 17:566-568.
23. Spellman P, Sherlock G, Zhang M, Iyer V, Anders K, Eisen M, Brown P, Botstein D, Futcher B: Comprehensive identification of cell
cycle-regulated genes of the yeast Saccharomyces cerevisiae
by microarray hybridization.Mol Biol Cell1998, 9:3273-3297.
24. Zhao L, Prentice R, Breeden L: Statistical modeling of large microarray data sets to identify stimulus-response profiles. Proc Natl Acad Sci USA2001, 98:5631-5636.
25. Krzanowski W: Ranking principal components to reflect
group structure.J Chemometrics1992, 9:509-520.
26. Keck M, Welt T, Wigger A, Renner U, Engelmann M, Holsboer F, Landgraf R: The anxiolytic effect of the CRH1 receptor
antag-onist R121919 depends on innate emotionality in rats.J
Neu-rosci2001, 13:373-380.
27. De Souza E: Corticotropin-releasing factor receptors: physiol-ogy, pharmacolphysiol-ogy, biochemistry and role in central
nervous system and immune disorders.
Psychoneuroendocrinol-ogy1995, 20:789-819.
28. Timpl P, Spanagel R, Sillaber I, Kresse A, Reul J, Stalla G, Blanquet V, Steckler T, Holsboer F, Wurst W: Impaired stress response and
reduced anxiety in mice lacking a functional crh-r1.Nat Genet
1998, 19:162-166.
29. Hughes T, Marton M, Jones A, Roberts C, Stoughton R, Armour C, Bennett H, Coffey E, Dai H, He Y, et al.: Functional discovery via
a compendium of expression profiles. Cell2000, 102:102-126.
30. Duman R, Heninger G, Nestler E: A molecular and cellular
theory of depression.Arch Gen Psychiatry1997, 54:597-606.
31. Eisen M, Brown P: DNA arrays for analysis of gene expression. Methods Enzymol1999, 303:179-205.
32. Chen Y, Dougherty E, Bittner M: Ratio-based decisions and the
quantitative analysis of cDNA micro-array images.J Biomed
Optics1997, 2:364-374.
comment
reviews
reports
deposited research
interactions
information