*
Escaping Electrons from Intense Laser-Solid Interactions as a
Function of Laser Spot Size
Dean Rusby1,2, Ross Gray2, Nick Butler2, Rachel Dance2, Graeme Scott1, Vincent Bagnoud3, Bernhard Zielbauer3, Paul
McKenna2, and David Neely1,2*
1STFC Rutherford Appleton Laboratory, Oxfordshire OX11 0QX, UK
2SUPA Department of Physics, University of Strathclyde, Glasgow G4 0NG, UK 3PHELIX Group, Gesellschaft fur Schwerionenforschung, D-64291 Darmstadt, Germany
Abstract. The interaction of a high-intensity laser with a solid target produces an energetic distribution of electrons that pass into the target. These electrons reach the rear surface of the target creating strong electric potentials that act to restrict the further escape of additional electrons. The measurement of the angle, flux and spectra of the electrons that do escape gives insights to the initial interaction. Here, the escaping electrons have been measured using a differentially filtered image plate stack, from interactions with intensities from mid 1020-1017 W/cm2, where the intensity has been reduced by defocussing to increase the
size of the focal spot. An increase in electron flux is initially observed as the intensity is reduced from 4x10²⁰ to 6x10¹⁸ W/cm2. The temperature of the electron distribution is also measured and found to be
relatively constant. 2D particle-in-cell modelling is used to demonstrate the importance of pre-plasma conditions in understanding these observations.
1 Introduction
When a high intensity laser (𝐼𝐼𝜆𝜆#> 10'( W/cm2µm2)
interacts with a solid target, multi-MeV electrons are accelerated and travel into the target. These so called `hot electrons' will generate x-rays via bremsstrahlung inside the target and, upon reaching the rear surface, create a sheath field that can accelerate protons to mega electron Volt energies. The initial electron heating caused by the laser absorption is a crucial aspect of the interaction as it dictates all subsequent particle acceleration/generation. At intensities > 1016 W/cm2,
resonance absorption usually plays a dominant role. This mechanism accelerates the electrons perpendicular to the target or critical surface. For higher intensities (>> 1016
W/cm2), the ponderomotive force becomes relevant. This
force accelerates the electrons along the laser axis. The dominance of each of these processes depends on the interaction conditions, such as the incident laser intensity and the pre-plasma density scale length on the front surface.
The incident laser intensity depends on three laser parameters; the laser energy, pulse duration and focal spot size. Many investigations have been conducted to show how the laser energy and pulse duration affects the emitted protons[1] and x-rays[2].
It has been demonstrated in the past that the size of the focal spot changes the dynamics of the laser interaction with the target. This has been investigated with regard to the proton acceleration mechanism numerous times. Coury et al. [3] showed that as the laser was defocused
from a peak intensity of 4x10²⁰ W/cm2, the maximum
energy of the protons decreased. However, this reduction was smaller for a given intensity than that demonstrated when the target was kept at best focus and the laser energy reduced. This measurement of the maximum proton energy is consistent with the data found by Brenner et al. [4,5] for shorter pulse laser conditions. Measurements of the divergence of the electrons were also conducted by Coury et al. using the K-alpha x-rays from the rear surface. This found no significant trend for the angular divergence of the electrons as a function of intensity for variation of energy or focus. The primary observable for both of these studies, and others, is the effect that the laser spot size has on the accelerated protons. No studies have examined in detail the escaping electron population as a function of focal spot size.
Electrons can be measured using FUJI-film image plate which is highly sensitive to ionising radiation [6]. Hidding et al. [7] showed that interleaving multiple layers of image plate with filtering material in a stack behind a laser-solid interaction enables, the temperature and flux to be extracted from simple Monte Carlo modelling. Curving the image plate and also using multiple layers provides angular information on the flux and temperature [8,9]. In this investigation, the so called `wraparound' diagnostic is deployed on an experimental campaign at the PHELIX laser. During this campaign the laser was defocused by up to 400 µm, decreasing the incident intensity onto the target from 4x10²⁰ - 4x10¹⁷
W/cm2. Previous studies have employed wraparound
electrons [9,10] whilst simultaneously investigating the electron flux emitted the front surface [8]. The experimental results from this campaign are accompanied by two dimensional particle-in-cell (PIC) simulations, investigating the influence of a front surface pre-plasma on a defocused pulse.
2
Experimental Method
The experimental campaign was conducted on the 1.05 µm PHELIX glass laser facility at GSI. The maximum laser energy post-compressor was 140 J and the pulse length measured using an auto-correlator was 700±60 fs. The laser is focused using an F/1.5 copper parabolic mirror, which is capable of delivering a laser focal spot with a Full Width Half Maximum (FWHM) of approximately 4 µm. This leads to a peak intensity of 4x10²⁰ W/cm2. The laser was s-polarised and incident at
20 degrees relative to the target normal. The target was a 100 µm thick copper foil.
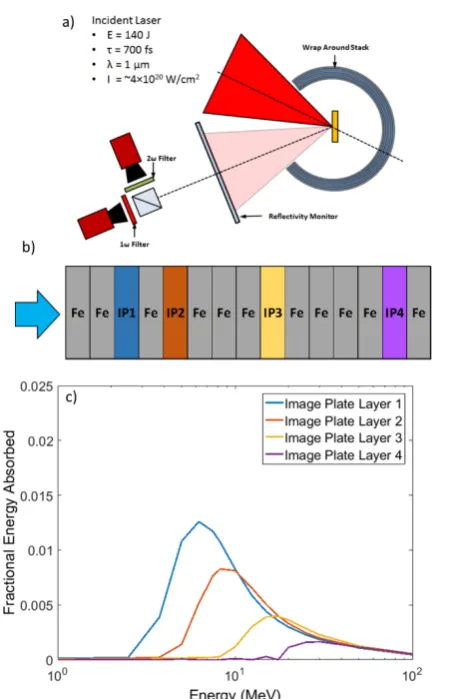
Fig 1. a) A schematic of the experimental setup from above with the aproximate laser parameters. A cross section of the wraparound diagnostic is shown in b) where the image plate (IP) layers are separated by iron (Fe) filters. Each of the IP layers is coloured to correspond with the response shown in c).
A wraparound diagnostic was deployed to measure the escaping electrons. A cross-section of the diagnostic is shown in Figure 1 b). As electron pass through the
0.85mm thick iron filtering layers, they lose energy. Therefore, the deeper layers will only detect the higher energy electrons. The response function of each layer of image plate, as calculated by Rusby et al. [9], was calculated using the Monte Carlo code GEANT4; this is shown in Figure 1 c). The first layer of image plate will only detect electron energies greater than 3 MeV. The copper target was placed directly in the middle of the wraparound diagnostic so it provides angular information about the escaping electrons. It is biased vertically such that it only observes the lower half of the escaping electron beam. The specular reflectivity was also monitored using two 12-bit CCDs; one that observes the 1 µm laser reflection and the other the emitted 2nd
harmonic light from the interaction. A basic schematic of the setup with the previously mention laser parameters is shown in Figure 1 a).
3 Results
Polar plots of the escaping electrons from a series of shots of varying laser defocus are shown in Figure 2. These are taken from a lineout across the most intense part of the signal. On each plot the incident angle of the laser and the target plane is shown. The angular distribution of the escaping electrons appears to either be pointed towards the laser axis and target normal, with some smaller features also observed occasionally (see Figure 2 d) and f)). Although there is a shot to shot variation, collecting the angular profiles demonstrates the benefits of using such a diagnostic to measure the electrons and not relying on a standard electron spectrometer, which only samples a very small solid angle. The integrated and peak flux extracted from the wraparound diagnostic is shown in Figure 3 a), as a function of incident laser intensity. It is clear that there is an increase in both integrated and peak flux when the laser is defocused; with the optimum occurring for a defocus of 100 µm which corresponds to an intensity of approximately 6x10¹⁸ W/cm2. This is an increase of a
factor of ~x2 from the tight-focus shot. When the intensity is reduced further by increasing the focal spot size, the signal reduces rapidly.
[image:2.595.62.288.323.673.2]Fig 2. Polar plots of the angularly-resolved electron varied by laser defocus. The laser intensity is reduced from a) to f). The data is taken from a line-out across the most intense region of signal
Experimentally, not all the electrons will escape the target as they experience a rear surface sheath that restricts them. The escaping percentage of electrons is estimated to be between a few percent and 30% [11] depending on laser and target parameters.
The experimental data is compared to various electron temperatures and escaping fractions. The comparison is conducted using the least-squares method; with the most suitable temperature being determined when the residuals between the two sets of data is reduced to a minimum. Varying the escaping electron fraction changes the measured temperature slightly; these changes are taken as the largest uncertainty in the temperature extraction.
The temperatures extracted from the peak of the angular data on the wraparound diagnostic are shown in Figure 3 b) as a function of calculated laser intensity for a given defocus. Also plotted are 3 estimations of the hot electron temperature from Beg, Haines and Wilks [12-14]. Figure 3 b) clearly shows that the escaping hot electron temperature is very similar as the laser is defocussed over 3 orders of magnitude of incident intensity.
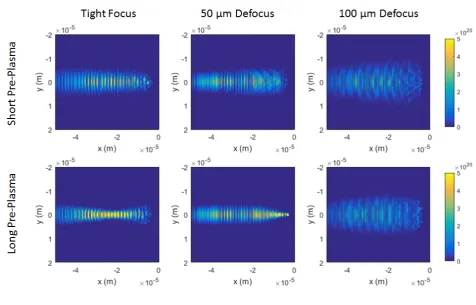
To better understand why the flux peaks for a defocused laser and the temperature remains constant, 2D PIC simulations were conducted.
[image:3.595.63.532.78.371.2] [image:3.595.319.517.414.695.2]Fig 2. Two dimensional PIC simulation results of the laser incident onto the target for different focus and plasma conditions. The short pre-plasma case (top row) shows that the spot size increases as the focus is moved further away from the target surface. However, for the longer pre-plasma, the laser self focuses, causing the beam to achieve a higher intensity on target for a 50 µm defocus than for the tight focus case.
4 2D EPOCH Simulations
The PIC code EPOCH [15] was used to simulate a defocused laser onto a planar solid target. The spatial size of the simulation box is set to 200 × 120 µm, which is made up of 8000×4800 cells. This leads to a resolution of 25 nm. To reduce the computational resources required to conduct the simulations, the target thickness and pulse duration was reduced by a factor of 4 to 25 µm and 175 fs respectively.
Simulations corresponding to the experimental campaign were performed in which the laser was defocused relative to the target surface. Rather than making the beam laterally larger, curvature was added to the phase of the beam, φ; this ensures that the same amount of energy enters the simulation by keeping the peak intensity constant. The phase of the beam is given as,
𝜑𝜑 = −
-./01-./21#34
+ atan
0 39
(1)
where 𝑘𝑘;= 2𝜋𝜋/𝜆𝜆, 𝑅𝑅@ is the Rayleigh range 𝑅𝑅@= 𝜋𝜋𝑤𝑤B#/𝜆𝜆, 𝑅𝑅C= −𝑥𝑥 1 + 309
#
is the radius of curvature and 𝑤𝑤B is the diffraction limited width of a Gaussian beam. Experimentally an F/1.5 off-axis parabola was employed, which yields an ideal waist size of ~3.7 µm. The beam focus is offset in the positive x direction to simulate the defocus of the laser.
The experimentally measured contrast of 10-7 would
form a preplasma on the front surface. Although, this was not measured on this experiment, the extent of the expansion can be estimated using previously measured pre-plasmas. McKenna and Carroll et al. [16,17] show a long, shallow density gradient measured using interferometry of a probe beam across the front surface of the target. Wagner et al. [18] characterised the contrast of the PHELIX laser and its effects on the pre-plasma [19] by measuring the expansion of the pre-plasma using shadowgraphy of a probe beam. These two sources provide sufficient information to make a first estimate of the pre-plasma. Coupled with this, additional simulations are conducted with a short scale length.
[image:4.595.68.545.60.365.2]understand the real laser intensity distribution present on full shots, which could be significantly different from the intensity which would be present without a pre-plasma.
5 Conclusion
Understanding the internal electron distribution present during laser solid target interactions is important to enable a greater degree of control and optimisation of secondary sources such as Bremsstrahlung x-rays, ions and neutrons. The entire angular distribution of the forward escaping electrons in the 3-20 MeV energy region has been observed as a function of defocus distance from copper foil targets. A 2 times enhancement of the escaping electron flux at a defocus of 100 µm from the optimum pre shot focal position was measured. As the laser is moved further away from focus, the escaping electrons numbers drop rapidly. Surprisingly, the temperature of the escaping electrons remains almost constant even though the flux changes considerably. The angular distribution of the electron beam does vary from shot to shot, though it generally points in the laser forward direction. These measurements highlight the importance of observing the entire escaping electron distribution, as a single conventional electron spectrometer would not observe the shot to shot beam distribution changes. PIC simulations clearly demonstrate that the presence of a pre-plasma plays a significant role in determining the real intensity conditions achieved on experimental shots. Future work will investigate this relationship in more detail and also the role that the-pre plasma has on modifying the angular distribution and spectra of the escaping electrons.
The authors gratefully acknowledge the expert assistance of the PHELIX operations team, targets from Scitech and funding from Laserlab grant 284464 and EPSRC (Grant Nos. EP/K022415/1, EP/M018091/1 and EP/R006202/1). Data associated with this paper can be accessed at http://dx.doi.org/10.5286/edata/709
References
1. Diado, H. et al. Review of laser-driven ion sources and their applications, Reports on Progress in Physics, 75,5, 2012
2. Fiorini, F. et al. Characterization of laser-driven electron and photon beams using the Monte Carlo code FLUKA, Laser and Particle Beams, 32, 233-241, 2013
3. Coury, M. et al. Influence of laser irradiated spot size on energetic electron injection and proton acceleration in foil targets. Appl. Phys. Lett. 100, 074105 (2012).
4. Brenner, C. et al. Dependence of laser accelerated protons on laser energy following the interaction of
defocused, intense laser pulses with ultra-thin targets. Laser Part. Beams 29, 345–351 (2011). 5. Brenner, C. M., McKenna, P. & Neely, D.
Modelling the effect of laser focal spot size on sheath- accelerated protons in intense laser–foil interactions. Plasma Phys. Control. Fusion 56, 084003 (2014).
6. Bonnet, T. et al. Response functions of imaging plates to photons, electrons and 4He particles. Rev. Sci. Instruments 84, 103510 (2013).
7. Hidding, B. et al. Novel method for characterizing relativistic electron beams in a harsh laser-plasma environment. Rev. Sci. Instruments 78 (2007). 8. Gray, R. J. et al. Surface transport of energetic
electrons in intense picosecond laser-foil interactions. Appl. Phys. Lett. 99, 171502 (2011). 9. Rusby, D. R. et al. Measurement of the angle,
temperature and flux of fast electrons emitted from intense laser–solid interactions. J. Plasma Phys. 81, 475810505 (2015).
10. Ge, X. L. et al. Directed fast electron beams in ultraintense picosecond laser irradiated solid targets. Appl. Phys. Lett. 107, 091111 (2015).
11. Link, A., Freeman, R. R., Schumacher, D. W. & Van Woerkom, L. D. Effects of target charging and ion emission and the energy spectrum of emitted electrons. Phys. Plasmas 18 (2011). DOI 10.1063/1.3587123.
12. Beg, F. N. et al. A study of picosecond laser–solid interactions up to 1019 W/cm2. Phys. Plasmas 4,
447–457 (1997).
13. Haines, M. G., Wei, M. S., Beg, F. N. & Stephens, R. B. Hot-electron temperature and laser-light absorption in fast ignition.Phys. Rev. Lett. 102, 1–4 (2009). DOI 10.1103/PhysRevLett.102.045008. 14. Wilks, S. C. & Kruer, W. L. Absorption of
Ultrashort, Ultra-Intense Laser Light by Solids and Overdense Plasmas. 33, 1954–1968 (1997).
15. Arber, T. D. et al. Contemporary particle-in-cell approach to laser-plasma modelling. Plasma Phys. Control. Fusion 57, 113001 (2015).
16. McKenna, P. et al. Effects of front surface plasma expansion on proton acceleration in ultraintense laser irradiation of foil targets. Laser Part. Beams
591–596 (2008). DOI 10.1109/PLASMA.2009.5227320.
17. Carroll, D., Quinn, M., Yuan, X. & McKenna, P. Effects of front surface plasma expansion on proton acceleration driven by the Vulcan Petawatt laser. clf.rl.ac.uk 19–22 (2008).
18. Wagner, F. et al. Temporal contrast control at the PHELIX petawatt laser facility by means of tunable sub-picosecond optical parametric amplification. Appl. Phys. B: Lasers Opt. 116, 429–435 (2014). 19. Wagner F., et al, Pre-plasma formation in