R E S E A R C H A R T I C L E
Open Access
Clinical characteristics of HIV-1-infected
patients with high levels of plasma
interferon-
γ
: a multicenter observational
study
Dai Watanabe
1,2*, Tomoko Uehira
1, Sachiko Suzuki
1, Erina Matsumoto
1, Takashi Ueji
1, Kazuyuki Hirota
1,
Rumi Minami
3, Soichiro Takahama
3, Kimikazu Hayashi
4, Morio Sawamura
5, Masahiro Yamamoto
3and
Takuma Shirasaka
1,2Abstract
Background:Circulating interferon-γ(IFN-γ) concentration may be sustained at a high level regardless of the initiation of antiretroviral therapy (ART) in some patients with HIV-1 infection. In the present study, we examined the clinical characteristics of HIV-1-infected patients with high levels of plasma IFN-γ.
Methods:The study subjects were patients infected with HIV-1 who were either naïve to ART with CD4+cell count > 200 cells/μL (n= 12), or had achieved viral suppression after ART for over a year (n= 188). The levels of plasma IFN-γand interleukin-6 (IL-6) were measured by the enzyme-linked immunosorbent assay. Patients were divided into high IFN-γand low IFN-γgroups based on a cutoff level of 5 pg/mL.
Results:The high IFN-γgroup included 41 patients (21%). Compared to the patients on ART with low IFN-γlevels, those on ART in the high IFN-γgroup were more likely to be younger than 50 years of age (P= 0.0051) and less likely to have dyslipidemia (P= 0.0476) or to be on a protease inhibitor (P= 0.0449). There was no significant difference between groups in the median increase of CD4+cell counts from the initiation of ART for up to 3 years. However, after 4 years, the increase in CD4+cell counts was significantly lower in the high IFN-γgroup compared with that in the low IFN-γgroup. There were no such significant differences between patients with low and high (> 2 pg/mL) levels of plasma IL-6.
Conclusion:We concluded that HIV-1-infected patients with high levels of circulating IFN-γdid not have a higher rate of comorbidities related to immune activation. However, they exhibited lower CD4+cell count recovery after 4 years of being on ART. This deficit could be a consequence of persistent immune activation.
Keywords:HIV-1 infection, Interferon-γ, Interleukin-6, CD4+cell count recovery
Background
During HIV-1 infection, serum cytokine levels generally rise with the progression of immunodeficiency and de-crease with the initiation of antiretroviral therapy (ART) [1–6]. However, we previously measured the levels of 12
serum cytokines in 35 HIV-infected patients and demon-strated that the level of serum interferon-γ (IFN-γ) ex-hibits a trend different from those of other cytokines [7]. Specifically, in a cross-sectional study, we revealed that some patients who were asymptomatic carriers or being treated by ART had a high level of serum IFN-γ. Simi-larly, in a longitudinal study, we revealed that a high level of serum IFN-γ was sustained in about 30% of the patients after the initiation of ART. Those observations suggested that serum IFN-γconcentration is maintained at a high level in some patients regardless of the state of * Correspondence:[email protected]
1AIDS Medical Center, National Hospital Organization Osaka National
Hospital, 2-1-14, Hoenzaka, Chuo-ku, Osaka City, Osaka 540-0006, Japan
2Department of Advanced Medicine for HIV Infection, Osaka University
Graduate School of Medicine, 2-2, Yamada-oka, Suita City, Osaka 565-0871, Japan
Full list of author information is available at the end of the article
immunodeficiency or ART. Thus, compared with the concentrations of other cytokines, the level of circulating IFN-γmay have different clinical significance in patients infected with HIV-1 [8].
It has been reported that initiation of ART reduces the levels of inflammation-associated soluble biomarkers, including serum cytokines such as interleukin-6 (IL-6), although their levels do not return to those observed in non-infected population [3, 5, 9]. Various factors, such as old age, comorbidities, and death, have been associ-ated with the high level of circulating IL-6 in patients infected with HIV-1 [9–11].
In contrast to the current knowledge about factors influencing IL-6 levels, the parameters associated with the high level of circulating IFN-γ have not been well established. It is unclear whether sustained high level of circulating IFN-γ has any influence on the clinical course of individuals infected with HIV-1. Although it may have an immunostimulatory effect that suppresses viral replication and increases CD4+cell count, excessive immune activation may result in the reduction of CD4+ cell count and increased likelihood of comorbidity development. In the present study, we examined HIV-1-infected patients who were either naïve to ART, with CD4+ T cell count > 200 cells/μL, or had HIV-1 RNA levels below the detection limit after being on ART for over a year and compared the clinical characteristics between the participants with high and low levels of plasma IFN-γor IL-6.
Methods Study population
The study complied with the principles of the Declar-ation of Helsinki regarding the investigDeclar-ations in human subjects and was performed after an ethics approval H26-NHO (AIDS)-03 had been received from Central Institutional Review Board Committee of the National Hospital Organization of Japan. Written consent was ob-tained from all study participants. The study cohort comprised 200 HIV-1-infected patients over 20 years of age who were regularly seen at one of the four hospi-tals of the National Hospital Organization. Patients were either naïve to ART, with CD4+ T cell count > 200 cells/μL, or had achieved viral suppression after having been on ART for over a year. Patients who developed fever or had other acute diseases were excluded from the study cohort.
Plasma measurements of IFN-γand IL-6
Plasma was separated from the whole blood and kept frozen in −80 °C until use. The levels of plasma IFN-γ
and IL-6 were measured by the enzyme-linked
immunosorbent assay (ELISA) (ThermoFisher Scientific, Waltham, MA) according to the supplier’s protocol. A
cutoff level of 5 pg/mL was selected to delineate groups with high and low IFN-γ levels as previously described [7]. The cutoff level for IL-6 was set to 2 pg/mL, close to the upper quartile (1.9 pg/mL). When repeated blood collections were possible for patients with IFN-γ ≥5 pg/ mL, samples were collected three times with at least 1 month in between each collection to confirm the repro-ducibility of high plasma IFN-γlevels.
Comparisons of the groups with high and low levels of IFN-γand IL-6
Participants were divided into the groups with high and low IFN-γ and IL-6 levels based on cutoff values indi-cated above. The initial measurement of IFN-γwas used to divide the patients into the groups. Sex, age, assumed route of infection, use of ART, and comorbidities were compared at the time of entry to the study. The patients were defined to have diabetes mellitus, dyslipidemia, hypertension, chronic kidney disease, and osteoporosis if they were diagnosed with these conditions according to the Japan Diabetes Society criteria, Japan Atherosclerosis Society guideline, Japanese Society of Hypertension guideline, Japanese Society of Nephrology guideline, and Japanese Society for Bone and Mineral Research criteria [12–14], respectively. Patients that received treatment for these conditions were also included. History of ma-lignancy was defined as having history of any cancer that had been proven by biopsy. Chronic hepatitis B was de-fined as persistence of hepatitis B surface antigen for 6 months or more. Chronic hepatitis C was defined as the presence of detectable hepatitis C virus RNA in the serum. Only those comorbidities that were identified in over 5% of the study patients at entry were considered for analysis. Clinical categories, number of CD4+ T cells (CD4+ cell count), plasma HIV-1-RNA levels, and comorbidities at the time of HIV-1 diagnosis were also collected retrospectively from the medical records and compared between the groups. The change in CD4+ cell count following ART was calculated based on the cell count prior to the initiation of ART. Changes in CD4+ cell count were measured from 1 year after ART initi-ation for up to 10 years.
Phylogenetic analysis
acid residues 1–99 and reverse transcriptase amino acid residues 1–240) were registered in GenBank (Additional file 1: Supplementary Materials and Methods). Nucleic acid sequences were aligned using Clustal W program version 2.1 (http://www.clustal.org/ clustal2/) and GENETYX-MAC version 18.0.6 (GENE-TYX, Tokyo, Japan). HIV-1 subtype B (HXB2, accession no. K03455) and HIV-2 (accession no. KX174313) were used for subtyping and as outgroup, respectively. Phylogenetic tree was constructed by using the neighbor-joining method (MEGA6 program), and the bootstrapping method was used to perform statistical evaluations.
Statistical analysis
The Mann-Whitney U test was used to analyze continu-ous variables. The chi-squared test was performed for 3 × 2 and 6 × 2 contingency tables, and the Fisher’s exact test was performed for 2 × 2 contingency tables. Spearman’s rank correlation coefficient was calculated for 2 × 2 contingency tables. All analyses were performed using JMP software version 11.2.1 (SAS Institute Inc., Cary, NC). All statistical analyses were conducted with a significance level ofα= 0.05 (P< 0.05).
Results
Clinical characteristics
Clinical characteristics of the patients are shown in Table 1. The median age was 42 years, and 98% of the patients (n= 196) were men. Twenty-seven percent of the patients (n= 53) were over the age of 50. The major-ity of the patients infected with HIV-1 (99%, n= 198) were Japanese; the remaining two patients were from Latin America and Oceania, respectively. Six percent of the patients (n= 12) were naïve to ART.
Plasma IFN-γand IL-6 measurements
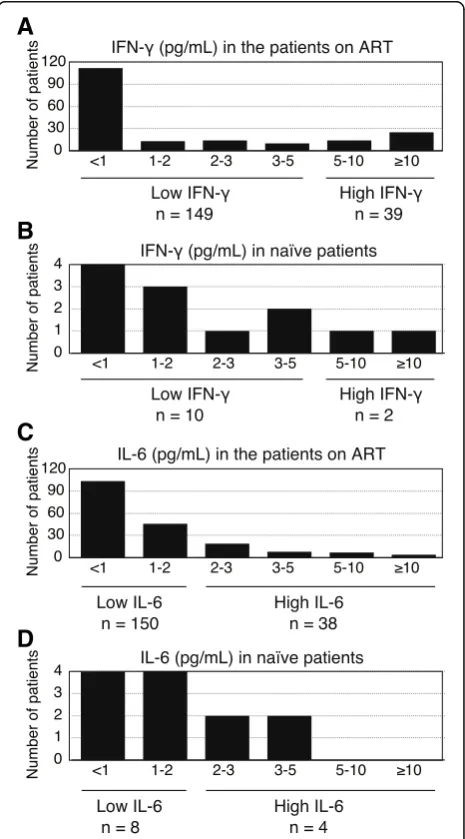
[image:3.595.306.539.266.686.2]Plasma IFN-γ and IL-6 levels measured by ELISA are shown in Fig. 1. High IFN-γ and IL-6 levels were ob-served among the patients both on ART (Fig. 1a and c) and naïve to ART (Fig. 1b and d). Based on the cutoff value of 5 pg/mL, 41 patients were categorized as high IFN-γ group (21, 95% confidence interval: 15–27%), and the remaining 159 patients were categorized as low IFN-γ group. Furthermore, 42 patients (21, 95% confi-dence interval: 16–27%) had plasma IL-6≥2 pg/mL; among them, 17 patients also had IFN-γ≥5 pg/mL. The distributions of patients between high and low cytokine groups were different for IFN-γand IL-6 (P< 0.0001).
Table 1Characteristics of participants at entry
Age (year), median [IQR] 42 [35–51]
Males (n, %) 196 (98%)
Assumed route of HIV-1 infection (n, %)
Homosexual 168 (84%)
Heterosexual 28 (14%)
Others 4 (2%)
Nationality (n, %)
Japanese 198 (99%)
Non-Japanese 2 (1%)
Current ART use (n, %)
Naïve 12 (6%)
Use for≥1 years 188 (94%)
Abbreviations:HIV-1= human immunodeficiency virus 1,ART= antiretroviral therapy,IQR= interquartile range
A
B
C
D
[image:3.595.57.293.544.714.2]Reproducibility of the initial high IFN-γmeasurements Reproducibility of the test results was examined by measuring plasma concentrations of IFN-γ three times in 35 out of 41 patients in the high IFN-γ group. IFN-γ concentration was ≥5 pg/mL in the two follow-up mea-surements for all patients who had IFN-γ≥10 pg/mL at the initial measurement (n= 24, 69%). Similarly, IFN-γ concentration was ≥5 pg/mL in the two follow-up measurements for 6 of the 11 patients whose IFN-γwas 5–10 pg/mL at the initial measurement. For the remaining five patients, IFN-γ concentration was 2–5 pg/mL in at least one of the two follow-up measure-ments. Thus, the high levels of plasma IFN-γ were con-sistent and not transient across the three replicate measurements in most patients (n= 30, 86%).
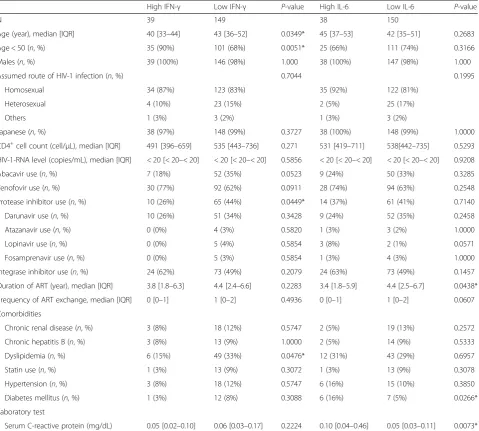
Comparison of patient characteristics across the groups Patients were divided into the two groups based on the initial levels of IFN-γ and IL-6, and their characteristics were compared. In order to match the characteristic background, the patients on ART were included for comparison (n= 188). Table2shows patient characteris-tics for each group. The median age of the patients at the time of study entry was statistically different (P= 0.0349), and the proportion of the patients below the age of 50 was higher in the high IFN-γ group (P= 0.0051). The proportion of patients who were on a pro-tease inhibitor was significantly lower in the high IFN-γ group (26%) than in the low IFN-γ group (44%, P= 0.0449). The duration of ART in the high IL-6 group was shorter than that in the low IL-6 group. Patients in the high IFN-γ group were less likely to have dyslipid-emia (15%,n= 6) compared with those in the low IFN-γ group (33%, n= 49; P= 0.0476). In addition, patients in the high IL-6 group had a higher rate of diabetes mellitus and higher levels of serum C-reactive protein than those in the low IL-6 group (P= 0.0266 and 0.0073, respectively). These observations indicated that patients’ characteristics were different in the groups with high and low IFN-γand IL-6 levels.
The rates of comorbidities were also evaluated at the time of HIV-1 diagnosis (Table 3). The rate of dyslipid-emia at diagnosis was lower than that at entry (9% ver-sus 29%; P< 0.0001). Similar results regarding the rates of hypertension (2% versus 11%;P= 0.0006) and chronic renal disease (2% versus 11%; P= 0.0002, respectively) were observed at diagnosis and at entry. Dyslipidemia rates between the high and low IFN-γ groups and the rates of diabetes mellitus between the high and low IL-6 groups (P= 0.5327 andP= 0.0635, respectively) were not significantly different. These observations indicate that comorbidities tended to appear during the course of HIV infection.
Next, Spearman’s rank correlation coefficients among the factors related to high IFN-γlevels (age < 50, abaca-vir use, protease inhibitor use, and with dyslipidemia at entry) were calculated (Table 4). In contrary to the results illustrated in Table 2, a significant association was observed between high IFN-γ and abacavir use. A significant relationship was observed in all other com-parisons except those between protease inhibitor use and abacavir use as well as between protease inhibitor use and age < 50, suggesting that these factors may inter-act with each other.
Recovery of CD4+cell counts following ART
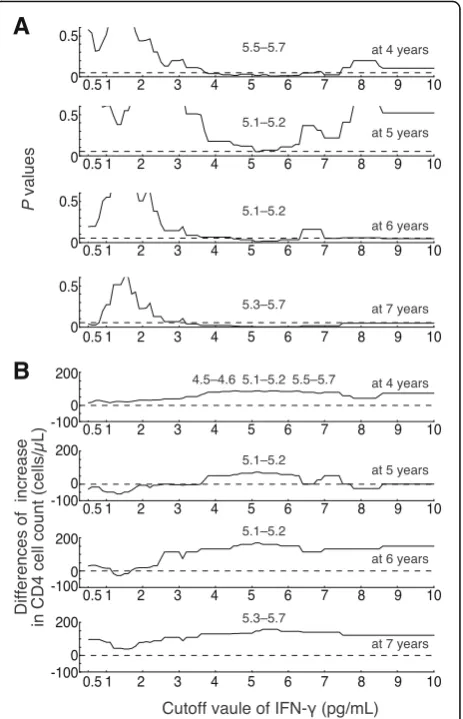
The recovery of CD4+ cell counts following ART was compared between the groups (Fig. 2). Patients that did not receive ART (n= 12) or for which CD4+ cell count just before initiating ART was unknown (n= 7) were excluded from this analysis. At the initiation of ART (baseline), CD4+ cell counts were not significantly dif-ferent between the groups, with 268 and 210 cells/μL in the high and low IFN-γ groups (P= 0.0961), and 229 and 217 cell/μL in the high and low IL-6 groups (P= 0.9112), respectively. Figure 2 shows the median CD4+ cell count increase ± interquartile range (IQR) from the baseline. The difference between the groups was not significant for 3 years on ART. However, there was a significant difference indicating lower re-covery of CD4+ cell counts in the high IFN-γ group after 4 years of ART (Fig. 2a). A similar reduction was not observed in the high IL-6 group (Fig. 2b). Cutoff values were evaluated by the comparisons with CD4+ cell count recovery after 4–7 years of ART. Cutoff values varied from 0.5, which was close to the median value of plasma IFN-γ concentration (0.54) in this study, to 10, so the participants were divided into two groups using these cutoff values. Figure 3 indi-cates P values and differences in the increase of CD4+ cell count for intergroup comparisons. The low-estP values were located within 5.1–5.7 pg/mL of IFN-γ concentration in all four assays (Fig.3a). Maximum differ-ences were also located within 4.5–5.7 pg/mL (Fig. 3b). These observations suggested that 5 pg/mL was poten-tially the optimal cutoff value for IFN-γconcentration and higher cutoff value may show nearly the same results. No significant differences were observed in any cutoff values at 1–3 years of ART for plasma IFN-γ concentration and at 1–10 years of ART for plasma IL-6 concentration. Phylogenetic analysis
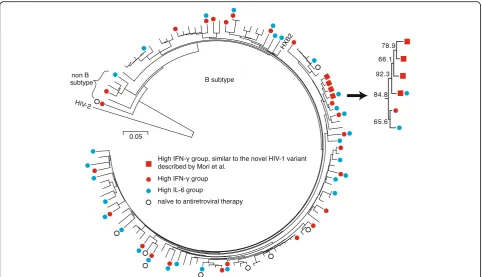
distributed in a scattered manner within B subtype and non-B subtype. The sequences from the remaining six pa-tients formed a cluster with a bootstrapping value of 84.8%. Sequences from four out of these six patients formed a cluster with a bootstrapping value of 92.3%; they exhibited similarity to the sequence previously described by Mori et al., which was a novel HIV-1 variant with rapid disease progression during primary HIV-1 infection [16]. Specifically, there was an insertion of the amino acid se-quence Q[S/N]RPE in the p6 region ofgagin addition to the amino acid sequence QNME in the C′-terminus of integrase. These observations suggested a possibility that viral factors might be involved in the maintenance of high plasma IFN-γlevels in these patients.
Discussion
[image:5.595.60.540.99.530.2]In the present study, we determined the proportion of HIV-1-infected patients with a high level of plasma IFN-γ(≥5 pg/mL) and examined their clinical character-istics. We demonstrated that the patients with a high plasma IFN-γlevel were more likely to be younger, and less likely to have dyslipidemia or to be on a protease in-hibitor. The incidence rate of comorbidities, such as diabetes and hypertension, in the high IFN-γ group was equivalent or nominally lower than that of the low IFN-γ group, although significant differences were not observed. Most of these results were not qualitatively similar to the findings reported in patients with high levels of circulating IL-6 in this and previous studies Table 2Comparison of the groups with high and low IFN-γand IL-6 levels among the patients on ART at entry
High IFN-γ Low IFN-γ P-value High IL-6 Low IL-6 P-value
N 39 149 38 150
Age (year), median [IQR] 40 [33–44] 43 [36–52] 0.0349* 45 [37–53] 42 [35–51] 0.2683
Age < 50 (n, %) 35 (90%) 101 (68%) 0.0051* 25 (66%) 111 (74%) 0.3166
Males (n, %) 39 (100%) 146 (98%) 1.000 38 (100%) 147 (98%) 1.000
Assumed route of HIV-1 infection (n, %) 0.7044 0.1995
Homosexual 34 (87%) 123 (83%) 35 (92%) 122 (81%)
Heterosexual 4 (10%) 23 (15%) 2 (5%) 25 (17%)
Others 1 (3%) 3 (2%) 1 (3%) 3 (2%)
Japanese (n, %) 38 (97%) 148 (99%) 0.3727 38 (100%) 148 (99%) 1.0000
CD4+cell count (cell/μL), median [IQR] 491 [396–659] 535 [443–736] 0.271 531 [419–711] 538[442–735] 0.5293
HIV-1-RNA level (copies/mL), median [IQR] < 20 [< 20–< 20] < 20 [< 20–< 20] 0.5856 < 20 [< 20–< 20] < 20 [< 20–< 20] 0.9208
Abacavir use (n, %) 7 (18%) 52 (35%) 0.0523 9 (24%) 50 (33%) 0.3285
Tenofovir use (n, %) 30 (77%) 92 (62%) 0.0911 28 (74%) 94 (63%) 0.2548
Protease inhibitor use (n, %) 10 (26%) 65 (44%) 0.0449* 14 (37%) 61 (41%) 0.7140
Darunavir use (n, %) 10 (26%) 51 (34%) 0.3428 9 (24%) 52 (35%) 0.2458
Atazanavir use (n, %) 0 (0%) 4 (3%) 0.5820 1 (3%) 3 (2%) 1.0000
Lopinavir use (n, %) 0 (0%) 5 (4%) 0.5854 3 (8%) 2 (1%) 0.0571
Fosamprenavir use (n, %) 0 (0%) 5 (3%) 0.5854 1 (3%) 4 (3%) 1.0000
Integrase inhibitor use (n, %) 24 (62%) 73 (49%) 0.2079 24 (63%) 73 (49%) 0.1457
Duration of ART (year), median [IQR] 3.8 [1.8–6.3] 4.4 [2.4–6.6] 0.2283 3.4 [1.8–5.9] 4.4 [2.5–6.7] 0.0438*
Frequency of ART exchange, median [IQR] 0 [0–1] 1 [0–2] 0.4936 0 [0–1] 1 [0–2] 0.0607
Comorbidities
Chronic renal disease (n, %) 3 (8%) 18 (12%) 0.5747 2 (5%) 19 (13%) 0.2572
Chronic hepatitis B (n, %) 3 (8%) 13 (9%) 1.0000 2 (5%) 14 (9%) 0.5333
Dyslipidemia (n, %) 6 (15%) 49 (33%) 0.0476* 12 (31%) 43 (29%) 0.6957
Statin use (n, %) 1 (3%) 13 (9%) 0.3072 1 (3%) 13 (9%) 0.3078
Hypertension (n, %) 3 (8%) 18 (12%) 0.5747 6 (16%) 15 (10%) 0.3850
Diabetes mellitus (n, %) 1 (3%) 12 (8%) 0.3088 6 (16%) 7 (5%) 0.0266*
Laboratory test
Serum C-reactive protein (mg/dL) 0.05 [0.02–0.10] 0.06 [0.03–0.17] 0.2224 0.10 [0.04–0.46] 0.05 [0.03–0.11] 0.0073*
[10]. Borges et al. performed an analysis of 9864 patients with virological suppression and demonstrated that the high level of plasma IL-6 was associated with multiple factors that affect inflammation, such as old age, use of protease inhibitors, comorbidities, reduced renal func-tion, and others. Some studies have also demonstrated associations between the high level of circulating IL-6 and various clinical outcomes, including death and the onset of acquired immune deficiency syndrome [9, 11,
17]. Our findings support a possible association between the high level of IFN-γ with endogenous anti-HIV re-sponse rather than with inflammation [8].
Notably, HIV-1-infected patients with a high plasma IFN-γ level had reduced CD4+ cell count recovery from year 4 on ART and onwards than patients with a low plasma IFN-γlevel. Various factors have been shown to be associated with suboptimal CD4+cell count recovery, including low nadir/baseline CD4+ cell count, old age, male gender, prolonged duration between HIV-1 tion and the initiation of ART, hepatitis C virus infec-tion, hepatitis B virus infecinfec-tion, comorbidities, injection drug use, up-regulation of surface markers of lympho-cyte activation, and gene polymorphisms of IL-10 and IL7RA [18–37]. In addition, many soluble biomarkers have been also examined for the association with
suboptimal recovery of CD4+ cell count [38, 39]. However, the nadir/baseline CD4+ cell count may be a confounding factor as it is strongly associated with suboptimal recovery of CD4+ cell count and influences the circulating level of soluble biomarkers. After control-ling for that confounding factor, only a limited number
of biomarkers, including IL-6 before ART and
interferon-inducible protein-10 after ART, were associ-ated with the suboptimal recovery of CD4+ cell count [34, 35]. In the present study, we demonstrated that there was no significant difference in CD4+ cell counts prior to and 3 years after ART between the low and high IFN-γ groups. Unexpectedly, the proportion of patients who were considered at high risk of reduced CD4+ cell count recovery, such as older patients and those with comorbidities, was lower in the high IFN-γ group than in the low IFN-γ group. Collectively, these findings suggest that a high level of plasma IFN-γ may be an independent factor associated with lower recovery of CD4+cell count.
[image:6.595.63.539.100.289.2]Our phylogenetic analysis demonstrated that HIV-1 genetic sequence in patients with a high IFN-γ level was distributed among different subtypes in a scattered manner, indicating that gene polymorphisms may be one of the causative factors of high plasma IFN-γ level. Table 3Comparison of the groups with high and low IFN-γand IL-6 levels among the patients on ART at diagnosis of HIV infection
High IFN-γ Low IFN-γ P-value High IL-6 Low IL-6 P-value
Clinical categories 0.7550 0.4122
Acute HIV infection 7 (18%) 26 (17%) 4 (11%) 29 (19%)
Chronic HIV infection, Category A/B 21 (54%) 89 (60%) 25 (66%) 85 (57%)
Category C 11 (28%) 34 (23%) 9 (24%) 36 (24%)
CD4+cell count (cell/μL), median [IQR] 265 [71–393] 253 [116–393] 0.9986 261 [107–386] 253 [104–398] 0.6920
HIV-1-RNA level (copies/mL), median [IQR] 96,750 [25,050–789,500]
105,000 [26,725–462,250]
0.9956 79,150 [25,475–373,250]
101,500 [26,100–491,500]
0.5009
Comorbidities
Chronic renal disease (n, %) 0 (0%) 3 (2%) 1.0000 1 (2%) 2 (1%) 0.5089
Chronic hepatitis B (n, %) 2 (5%) 12 (8%) 0.7391 2 (5%) 12 (8%) 0.7384
Dyslipidemia (n, %) 2 (5%) 15 (9%) 0.5327 3 (7%) 14 (9%) 1.0000
Hypertension (n, %) 0 (0%) 4 (3%) 0.5833 2 (5%) 2 (1%) 0.1949
Diabetes mellitus (n, %) 0 (0%) 5 (3%) 0.5855 3 (7%) 2 (1%) 0.0635
Abbreviations:IQR= interquartile range,HIV-1= human immunodeficiency virus 1
Table 4Spearman’s rank correlation coefficient indicating the presence or absence of the correlation between the factors related to high IFN-γlevels
Age < 50 Abacavir use Protease inhibitor use With dyslipidemia
High IFN-γ 0.199P= 0.0062* −0.1481P= 0.0425* −0.1489P= 0.0414* −0.1560P= 0.0325*
Age < 50 −0.2993P< 0.0001* 0.0181P= 0.8054 −0.2297P= 0.0015*
Abacavir use 0.0108P= 0.8827 0.3462P< 0.0001*
Protease inhibitor use 0.1924P= 0.0082*
[image:6.595.55.539.655.728.2]IFN-γ + 874 T/A gene polymorphism is located within the first intron and encompasses the binding site for the transcription factor NF-κB. Binding affinity of NF-κB for the + 874 A-allele is lower, and it results in reduced pro-duction of IFN-γ. Because it has been reported that indi-viduals with + 874 A-allele may be at a higher risk of tuberculosis [40], many studies examined the association between this polymorphism and various diseases. In par-ticular, it has been shown that the A-allele was a risk fac-tor for HIV infection [41], and that HIV-infected patients with the A-allele had a higher risk of HIV-tuberculosis co-infection [42], lower CD4+ cell
count [31, 43], and lack of response to ART [44]. Our findings were not in accordance with previous reports, which demonstrated that patients with the A-allele, asso-ciated with lower IFN-γproduction, showed a reduction in CD4+ cell count. These findings suggest that IFN-γ gene polymorphism may not be the primary factor that contributes to the high level of circulating IFN-γ.
In the phylogenetic analysis, we identified four patients that formed a cluster (red boxes in Fig.4). In addition to the similarities of their genetic sequence, they had com-mon geographical and chronological features, as all four of them were diagnosed in Osaka after 2011. Thus, these patients were likely to have been infected by the novel HIV-1 variant previously described by Mori et al. [16]. It
A
B
Fig. 2Increase in the CD4+cell count from the start of ART (baseline). (a) The increase in CD4+cell count from the baseline is expressed as the median ± interquartile range (IQR). Solid and dotted lines indicate the high and low IFN-γgroups, respectively. (b) The increase in CD4+ cell count in the high and low IL-6 groups. The total number of patients at respective time points is indicated below each graph. *P< 0.05, **P< 0.01
A
B
Fig. 3Evaluation of cutoff values for plasma IFN-γconcentration using the differences of increase in the CD4+cell count from the start of ART (baseline). (a) Cutoff values for plasma IFN-γ
[image:7.595.59.292.86.494.2] [image:7.595.308.540.88.448.2]is still unclear why the patients who were infected with this novel variant had accelerated disease progression. Further investigations of this phenomenon are required because there may be a potential common mechanism underlying the accelerated disease progression and high plasma IFN-γlevel.
There were several limitations in our study: it in-cluded a relatively small number of patients, espe-cially of those infected with novel HIV-1 variant previously described [16]. Furthermore, information on some factors that might affect circulating cyto-kines, such as consumption of tobacco and alcohol [10], were missing. In addition, the data on CD4+
cell counts were collected retrospectively, and plasma IFN-γ level was evaluated in a cross-sectional manner. Although we selected the cutoff value using earlier data [7], evaluation of the cutoff value in this study using the differences of the recovery of CD4+ cell count after 4 years of ART suggested that 5 pg/mL of IFN-γ concentration was a potential candidate for op-timal cutoff value. In addition, our study did not investigate IFN-γ-producing cells. Further studies are required to uncover the biological mechanism con-tributing to the high level of circulating IFN-γ.
Conclusions
Twenty-one percent of HIV-1-infected patients, who were either naïve to ART (CD4+ cell count > 200 cells/
μL) or had achieved viral suppression after ART for 1 year or longer, were found to have a high (> 5 pg/mL) level of plasma IFN-γ. These patients did not have a higher rate of comorbidities associated with immune activation during the course of HIV infection. However, they demonstrated reduced CD4+ cell count recovery after 4 years on ART, indicating that these patients may be influenced by persistent immune activation.
Additional file
Additional file 1:S1 File.Supplementary Methods. (DOCX 32 kb)
Abbreviations
ART:antiretroviral therapy; ELISA: enzyme-linked immunosorbent assay; IFN-γ: interferon-γ; IL-6: interleukin-6; IQR: interquartile range.
Acknowledgements
We are grateful to all study participants. We would like to thank Editage (www.editage.jp) for English language editing.
[image:8.595.57.540.87.364.2]Funding
This work was supported by a Grant-in-Aid for Clinical Research (H26-NHO (AIDS)-03) from the National Hospital Organization to DW (https:// www.hosp.go.jp). The funders had no role in study design, data collection and analysis, decision to publish, or preparation of the manuscript.
Availability of data and materials
The data used in this study were obtained under an exclusive data-sharing agreement and are not currently publicly available. All sequences are avail-able from GenBank. Accession numbers are described in the
Additional file1: Supplementary Methods section.
Authors’contributions
DW, MY, and TS designed the study. DW, TUehira, TUeji, KHirota, RM, ST, KHayashi, and MS collected the data. DW, RM, KHayashi, and MS were involved in the sample processing. DW, SS, and EM measured plasma IFN-γ and IL-6 concentrations. DW participated in data analysis and wrote the paper. SS, EM, RM, MY, and TS contributed substantially to the interpretation of results. TUehira, TUeji, KHirota, ST, KHayashi, and MS critically reviewed the manuscript and revised the manuscript for important intellectual content. All authors read and approved the final manuscript.
Ethics approval and consent to participate
The study was performed after an ethics approval H26-NHO (AIDS)-03 had been received from the Central Institutional Review Board Committee of the National Hospital Organization of Japan. The procedures were carried out in accordance with relevant guidelines and regulations. All samples were collected after acquiring written consent.
Consent for publication
Not applicable.
Competing interests
The authors declare that they have no competing interests.
Publisher’s Note
Springer Nature remains neutral with regard to jurisdictional claims in published maps and institutional affiliations.
Author details
1AIDS Medical Center, National Hospital Organization Osaka National
Hospital, 2-1-14, Hoenzaka, Chuo-ku, Osaka City, Osaka 540-0006, Japan.
2Department of Advanced Medicine for HIV Infection, Osaka University
Graduate School of Medicine, 2-2, Yamada-oka, Suita City, Osaka 565-0871, Japan.3Internal Medicine, Clinical Research Institute, National Hospital
Organization, Kyushu Medical Center, 1-8-1, Jigyohama, Chuo-ku Fukuoka City, Fukuoka 810-8563, Japan.4Department of Obstetrics and Gynecology,
National Organization Kanmon Medical Center, 1-1, Chofusotouracho, Shimonoseki City, Yamaguchi 752-8510, Japan.5Department of Clinical
Research, National Hospital Organization Shibukawa Medical Center, 383, Shiroi, Shibukawa City, Gunma 377-0280, Japan.
Received: 5 October 2018 Accepted: 20 December 2018
References
1. Alonso K, Pontiggia P, Medenica R, Rizzo S. Cytokine patterns in adults with AIDS. Immunol Investig. 1997;26:341–50.
2. Aziz N, Nishanian P, Fahey JL. Levels of cytokines and immune activation markers in plasma in human immunodeficiency virus infection: quality control procedures. Clin Diagn Lab Immunol. 1998;5:755–61.
3. French MA, King MS, Tschampa JM, da Silva BA, Landay AL. Serum immune activation markers are persistently increased in patients with HIV infection after 6 years of antiretroviral therapy despite suppression of viral replication and reconstitution of CD4+ T cells. J Infect Dis. 2009;200:1212–5. 4. Hileman CO, Kinley B, Scharen-Guivel V, Melbourne K, Szwarcberg J,
Robinson J, et al. Differential reduction in monocyte activation and vascular inflammation with integrase inhibitor-based initial antiretroviral therapy among HIV-infected individuals. J Infect Dis. 2015;212:345–54.
5. Wada NI, Jacobson LP, Margolick JB, Breen EC, Macatangay B, Penugonda S, et al. The effect of HAART-induced HIV suppression on circulating markers of inflammation and immune activation. AIDS. 2015;29:463–71. 6. Swaminathan S, Qiu J, Rupert AW, Hu Z, Higgins J, Dewar RL, et al.
Interleukin-15 (IL-15) strongly correlates with increasing HIV-1 viremia and markers of inflammation. PLoS One. 2016;11:e0167091.
7. Watanabe D, Uehira T, Yonemoto H, Bando H, Ogawa Y, Yajima K, et al. Sustained high levels of serum interferon-gamma during HIV-1 infection: a specific trend different from other cytokines. Viral Immunol. 2010;23:619–25. 8. Roff SR, Noon-Song EN, Yamamoto JK. The significance of
interferon-gamma in HIV-1 pathogenesis, therapy, and prophylaxis. Front Immunol. 2014;4:498.
9. Tenorio AR, Zheng Y, Bosch RJ, Krishnan S, Rodriguez B, Hunt PW, et al. Soluble markers of inflammation and coagulation but not T-cell activation predict non-AIDS-defining morbid events during suppressive antiretroviral treatment. J Infect Dis. 2014;210:1248–59.
10. Borges AH, O'Connor JL, Phillips AN, Ronsholt FF, Pett S, Vjecha MJ, et al. Factors associated with plasma IL-6 levels during HIV infection. J Infect Dis. 2015;212:585–95.
11. Wada NI, Bream JH, Martinez-Maza O, Macatangay B, Galvin SR, Margolick JB, et al. Inflammatory biomarkers and mortality risk among HIV-suppressed men: a multisite prospective cohort study. Clin Infect Dis. 2016;63:984–90.
12. Shoji M, Takemoto M, Kobayashi K, Shoji T, Mori S, Sagara JI, et al. Serum podocalyxin levels correlate with carotid intima media thickness, implicating its role as a novel biomarker for atherosclerosis. Sci Rep. 2018;8:245. 13. Kato H, Nangaku M, Hirakata H, Wada T, Hayashi T, Sato H, et al. Rationale
and design of oBservational clinical research in chronic kidney disease patients with renal anemia: renal proGnosis in patients with Hyporesponsive anemia to erythropoiesis-stimulating agents, darbepoetiN alfa
(BRIGHTEN trial). Clin Exp Nephrol. 2018;22:78–84.
14. Asaoka D, Nagahara A, Shimada Y, Matsumoto K, Ueyama H, Matsumoto K, et al. Risk factors for osteoporosis in Japan: is it associated with helicobacter pylori? Ther Clin Risk Manag. 2015;11:381–91.
15. Koga I, Odawara T, Matsuda M, Sugiura W, Goto M, Nakamura T, et al. Analysis of HIV-1 sequences before and after co-infecting syphilis. Microbes Infect. 2006;8:2872–9.
16. Mori H, Kojima Y, Kawahata T, Matsuura M, Uno K, Konishi M, et al. A cluster of rapid disease progressors upon primary HIV-1 infection shared a novel variant with mutations in the p6gag/pol and pol/vif genes. AIDS. 2015;29:1717–9.
17. Boulware DR, Hullsiek KH, Puronen CE, Rupert A, Baker JV, French MA, et al. Higher levels of CRP, D-dimer, IL-6, and hyaluronic acid before initiation of antiretroviral therapy (ART) are associated with increased risk of AIDS or death. J Infect Dis. 2011;203:1637–46.
18. Florence E, Lundgren J, Dreezen C, Fisher M, Kirk O, Blaxhult A, et al. Factors associated with a reduced CD4 lymphocyte count response to HAART despite full viral suppression in the EuroSIDA study. HIV Med. 2003;4:255–62.
19. Dronda F, Zamora J, Moreno S, Moreno A, Casado JL, Muriel A, et al. CD4 cell recovery during successful antiretroviral therapy in naive HIV-infected patients: the role of intravenous drug use. AIDS. 2004;18:2210–2. 20. Gutiérrez F, Padilla S, Masiá M, Iribarren JA, Moreno S, Viciana P, et al.
Patients’characteristics and clinical implications of suboptimal CD4 T-cell gains after 1 year of successful antiretroviral therapy. Curr HIV Res. 2008;6:100–7.
21. Nakanjako D, Kiragga A, Ibrahim F, Castelnuovo B, Kamya MR, Easterbrook PJ. Sub-optimal CD4 reconstitution despite viral suppression in an urban cohort on antiretroviral therapy (ART) in sub-Saharan Africa: frequency and clinical significance. AIDS Res Ther. 2008;5:23.
22. Massanella M, Negredo E, Perez-Alvarez N, Puig J, Ruiz-Hernandez R, Bofill M, et al. CD4 T-cell hyperactivation and susceptibility to cell death determine poor CD4 T-cell recovery during suppressive HAART. AIDS. 2010;24:959–68.
23. Negredo E, Massanella M, Puig J, Perez-Alvarez N, Gallego-Escuredo JM, Villarroya J, et al. Nadir CD4 T cell count as predictor and high CD4 T cell intrinsic apoptosis as final mechanism of poor CD4 T cell recovery in virologically suppressed HIV-infected patients: clinical implications. Clin Infect Dis. 2010;50:1300–8.
25. Engsig FN, Gerstoft J, Kronborg G, Larsen CS, Pedersen G, Roge B, et al. Long-term mortality in HIV patients virally suppressed for more than three years with incomplete CD4 recovery: a cohort study. BMC Infect Dis. 2010;10:318. 26. Engsig FN, Zangerle R, Katsarou O, Dabis F, Reiss P, Gill J, et al. Long-term
mortality in HIV-positive individuals virally suppressed for >3 years with incomplete CD4 recovery. Clin Infect Dis. 2014;58:1312–21.
27. Saison J, Ferry T, Demaret J, Maucort Boulch D, Venet F, Perpoint T, et al. Association between discordant immunological response to highly active anti-retroviral therapy, regulatory T cell percentage, immune cell activation and very low-level viraemia in HIV-infected patients. Clin Exp Immunol. 2014;176:401–9.
28. Marcus JL, Leyden WA, Chao CR, Xu L, Quesenberry CP Jr, Tien PC, et al. Differences in response to antiretroviral therapy by sex and hepatitis C infection status. AIDS Patient Care STDs. 2015;29:370–8.
29. Zhang F, Sun M, Sun J, Guan L, Wang J, Lu H. The risk factors for suboptimal CD4 recovery in HIV infected population: an observational and retrospective study in Shanghai, China. Biosci Trends. 2015;9:335–41. 30. Guzman-Fulgencio M, Berenguer J, Jimenez-Sousa MA, Micheloud D,
García-Álvarez M, Bellón JM, et al. IL7RA polymorphisms predict the CD4+ recovery in HIV patients on cART. Eur J Clin Investig. 2015;45:1192–9.
31. Singh S, Sharma A, Arora SK. Combination of low producer AA-genotypes in IFN-gamma and IL-10 genes makes a high risk genetic variant for HIV disease progression. Cytokine. 2016;77:135–44.
32. Collazos J, Valle-Garay E, Carton JA, Montes AH, Suarez-Zarracina T, De la Fuente B, et al. Factors associated with long-term CD4 cell recovery in HIV-infected patients on successful antiretroviral therapy. HIV Med.
2016;17:532–41.
33. Anderson M, Gaseitsiwe S, Moyo S, Thami KP, Mohammed T, Setlhare D, et al. Slow CD4+ T-cell recovery in human immunodeficiency virus/hepatitis B virus-coinfected patients initiating truvada-based combination antiretroviral therapy in Botswana. Open Forum Infect Dis. 2016;3:ofw140.
34. Stiksrud B, Lorvik KB, Kvale D, Mollnes TE, Ueland PM, Trøseid M, et al. Plasma IP-10 is increased in immunological nonresponders and associated with activated regulatory T cells and persisting low CD4 counts. J Acquir Immune Defic Syndr. 2016;73:138–48.
35. Rosado-Sánchez I, Jarrín I, Pozo-Balado MM, de Pablo-Bernal RS, Herrero-Fernández I, Alvarez-Ríos AI, et al. Higher levels of IL-6, CD4 turnover and Treg frequency are already present before cART in HIV-infected subjects with later low CD4 recovery. Antivir Res. 2017;142:76–82.
36. Gunda DW, Kilonzo SB, Kamugisha E, Rauya EZ, Mpondo BC. Prevalence and risk factors of poor immune recovery among adult HIV patients attending care and treatment Centre in northwestern Tanzania following the use of highly active antiretroviral therapy: a retrospective study. BMC Res Notes. 2017;10:197.
37. Darraj M, Shafer LA, Chan S, Kasper K, Keynan Y. Rapid CD4 decline prior to antiretroviral therapy predicts subsequent failure to reconstitute despite HIV viral suppression. J Infect Public Health. 2018;11:265–9.
38. Norris PJ, Zhang J, Worlock A, Nair SV, Anastos K, Minkoff HL, et al. Systemic cytokine levels do not predict CD4+ T-cell recovery after suppressive combination antiretroviral therapy in chronic human immunodeficiency virus infection. Open Forum Infect Dis. 2016;3:ofw025.
39. Richert Q, Trajtman A, Arroyave L, Toews J, Becker M, Kasper K, et al. Systemic inflammation before and after antiretroviral therapy initiation as a predictor of immune response among HIV-infected individuals in Manitoba. Cytokine. 2017;91:74–81.
40. Tso HW, Ip WK, Chong WP, Tam CM, Chiang AK, Lau YL. Association of interferon gamma and interleukin 10 genes with tuberculosis in Hong Kong Chinese. Genes Immun. 2005;6:358–63.
41. Sobti RC, Salih AM, Nega B, Seyed AH, Rupinder K, Vijesh K, et al. Insights into the role of IL-12B and IFN-gamma cytokine gene polymorphisms in HIV-1/AIDS infection. Folia Biol (Praha). 2010;56:110–5.
42. Gutlapalli VR, Sykam A, Tenali SP, Suneetha S, Suneetha LM. High levels of plasma interferon gamma and +874T/a gene polymorphism is associated with HIV-TB co-infection. Hum Immunol. 2016;77:1264–70.
43. Freitas FB, Lima SS, Feitosa RN, Azevedo VN, Ishak Mde O, Ishak R, et al. Polymorphisms in the IFNγ, IL-10, and TGFβgenes may be associated with HIV-1 infection. Dis Markers 2015;2015:248571.