This is a repository copy of
High-efficiency and dynamic stable electromagnetic wave
attenuation for La doped bismuth ferrite at elevated temperature and gigahertz frequency
.
White Rose Research Online URL for this paper:
http://eprints.whiterose.ac.uk/109251/
Version: Accepted Version
Article:
Li, Y., Cao, M-S., Wang, D-W. orcid.org/0000-0001-6957-2494 et al. (1 more author)
(2015) High-efficiency and dynamic stable electromagnetic wave attenuation for La doped
bismuth ferrite at elevated temperature and gigahertz frequency. RSC Advances, 5 (94).
pp. 77184-77191. ISSN 2046-2069
https://doi.org/10.1039/C5RA15458H
[email protected]
https://eprints.whiterose.ac.uk/
Reuse
Unless indicated otherwise, fulltext items are protected by copyright with all rights reserved. The copyright
exception in section 29 of the Copyright, Designs and Patents Act 1988 allows the making of a single copy
solely for the purpose of non-commercial research or private study within the limits of fair dealing. The
publisher or other rights-holder may allow further reproduction and re-use of this version - refer to the White
Rose Research Online record for this item. Where records identify the publisher as the copyright holder,
users can verify any specific terms of use on the publisher’s website.
Takedown
If you consider content in White Rose Research Online to be in breach of UK law, please notify us by
RSC Advances
This is an Accepted Manuscript, which has been through the
Royal Society of Chemistry peer review process and has been
accepted for publication.
Accepted Manuscripts are published online shortly after
acceptance, before technical editing, formatting and proof reading.
Using this free service, authors can make their results available
to the community, in citable form, before we publish the edited
article. This Accepted Manuscript will be replaced by the edited,
formatted and paginated article as soon as this is available.
You can find more information about Accepted Manuscripts in the
Information for Authors
.
RSC Advances
ARTICLE
This journal is © The Royal Society of Chemistry 20xx J. Name., 2013, 00, 1‐3 | 1
Please do not adjust margins
a.
School of Material Science and Engineering, Beijing Institute of Technology, Beijing, 10008, China. E-mail: [email protected].
b.School of Science, Minzu University of China, Beijing 10008, China. E-mail:
Electronic Supplementary Information (ESI) available. See DOI: 10.1039/x0xx00000x
Received 00th January 20xx, Accepted 00th January 20xx
DOI: 10.1039/x0xx00000x
www.rsc.org/
High‐efficiency and dynamic stable electromagnetic wave
attenuation for La doped bismuth ferrite at elevated temperature
and gigahertz frequency
Yong Li,a Mao‐sheng Cao,*a Da‐wei Wanga and Jie Yuan*b
The immense potential of electromagnetic wave attenuation materials for the applications in harsh dynamic environment has propelled much recent research and development. Here, we present the original observations on high‐temperature electromagnetic properties and attenuation behavior of Bi0.8La0.2FeO3 at 323 – 673 K. Bi0.8La0.2FeO3 exhibits high‐efficiency
and stable attenuation at dynamic temperature and frequency condition. With the increase of temperature, the attenuation capacity enhances, where the minimum reflection loss is less than ‐10 dB from 323 K to 673 K, and the best reflection loss reaches ‐54 dB at 573 K, which is 2.7 times of that of BiFeO3. With changing frequency, the effective
reflection loss (≤ ‐10 dB) almost covers 3 GHz in the full temperature range. The excellent attenuation capacity of Bi0.8La0.2FeO3 is attributed to the crystal structure and electron structure due to the substitution of La, which enhances
conductivity and natural ferromagnetic resonance, resulting in the enhancement of electromagnetic properties and improvement of electrical‐magnetic synergy at elevated temperature. This work highlights the bismuth ferrite family as promising high‐efficiency and stable electromagnetic wave attenuation materials.
Introduction
High‐efficiency electromagnetic (EM) wave attenuation materials is highly demanded to eliminate adverse EM wave effectively in healthcare, signal and data protection, and national defense security.1,2 More importantly, the good stability of EM wave attenuation in thermal environments for a long time is a decisive factor for practical applications of EM wave attenuation materials.3 Recently, various attractive materials have been developed, which show the potential in EM wave attenuation fields. Carbon nanomaterials, such as carbon nanotubes, grapheme, and their heterostructures, have attracted much attention for EM wave attenuation due to light weight and good attenuation capacity.4‐12 The carbon nanomaterials, however, are easily oxidized at high temperature. Magnetic metals and alloys exhibit good EM wave attenuation at room temperature.13‐20 Unfortunately, the electrical properties decrease with increasing temperature, resulting in the decrease of EM wave attenuation. Metallic oxide may be candidates for EM wave attenuation at high temperature.21‐28 Nonetheless, it is difficult for them to achieve high‐efficiency EM wave attenuation due to weak electrical properties. Searching for high‐efficiency EM wave attenuation materials, therefore, is still a highly challenging task, which only becomes more difficult in view of the stabilization
of attenuation at high temperature.
BiFeO3 (BFO), a fascinating multifunction material, has shown
application potential in areas as diverse as piezoelectrics,29 photovoltaics30 and energy harvesting.31 Recently, BFO nanoparticles, ceramics and composites, have been expected to exhibit high‐efficiency EM wave attenuation because of good dielectric and magnetic properties. Kang et at. have found that BFO nanoparticles have excellent EM wave attenuation which is attributed to the good EM matching.32 Wen et al. have prepared BFO ceramics by high‐pressure synthesis, improving dielectric properties and EM wave attenuation.33 The EM properties and attenuation behavior of BFO at elevated temperature, however, are rarely explored, and the EM wave attenuation capacity still needs to be improved further to meet the demand of high efficiency and stabilization. Here we demonstrate the EM properties and EM wave attenuation of Bi0.8La0.2FeO3 (BLFO) in the temperature range 323‐
673 K at X‐band (8.2‐12.4 GHz). The reflection loss (RL) and dynamic stability of BLFO increase compared with that of BFO. The minimum reflection loss is less than ‐10 dB in the full temperature range, and the best reflection loss reaches ‐54 dB at 573 K. The effective reflection loss (≤ ‐10 dB) covers nearly 3 GHz at the thickness of 2 mm. The structure, EM wave response mechanism and attenuation behavior at elevated temperature have been discussed below.
Experimental section
Sol–gel method was employed to prepare BFO and BLFO nanoparticles. Bismuth nitrate Bi(NO3)3∙5H2O, iron nitrate
Fe(NO3)3∙9H2O and neodymium nitrate La(NO3)3∙6H2O as raw
Page 1 of 7
RSC Advances
RSC
Advances
Accepted
ARTICLE JNanoscale
materials in stoichiometric proportions were dissolved in 2‐ methoxyethanol C3H8O2. Citric acid in 1:1 molar ratio with respect
to the metal nitrates was added to the solution, followed by polyethylene glycol as a dispersant. The mixture was stirred for 30 min at 50 °C to obtain the sol, and then it was kept at 80 °C for 48 h to form the dried gel. The dried gel was calcined at 300 °C for 0.5 h. The calcined powders were sintered at 500 °C for 2 h.
The structure of the samples was collected using X‐ray diffraction (XRD, Ni‐filtered Cu Kα radiation, 40 kV). Rietveld refinement of the
XRD patterns was performed by using the FullProf Program. Raman spectra were obtained using Raman spectromater (Jobin Yvon HR800). X‐ray photoelectron spectroscopy (XPS) spectra were measured on a PHI Quantera system. The morphologies were measured using scanning electron microscopy (SEM, S‐4800 system). The microstructure were determined by transmission electron microscopy (TEM, JEM‐2100 system). The DC conductivity measurements were carried out using an Keithley 2401A‐6517B multi‐meter. Magnetic properties were measured by a Lakeshore 7407 vibrating sample magnetometer. The complex permittivity and permeability was measured on an Anritsu 37269D vector network analyzer by the waveguide method in X‐band.
The calculations on density of states were performed using the CASTEP program code based on the first‐principles plane‐wave pseudo‐potential method. The generalized gradient approximation (GGA) was adopted along with the exchange‐correlation function realized by Perdow‐Burke‐Emzerhof (PBE). The plane wave cutoff energy of 500 eV, the convergence criteria for energy of 2×10‐5 eV, SCF tolerance of 2×10‐6 eV and 2×2×2 K‐point Monkhorst‐Pack grid were applied to guarantee a well‐converged structure under study. A 2a × 2b × c supercell was adopted for all the calculations. One of the O atoms was removed for BFO, and four of the Bi atoms were substituted by La atoms for BLFO.
Results and discussion
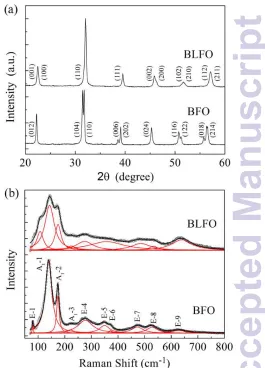
Fig. 1a shows the XRD patterns for the BFO and BLFO. It is found that the BFO crystallizes in rhombohedral perovskite structure with
R3c space group, and the lattice parameters are a = b = 5.5744 Å, c
= 13.8568 Å. The BLFO possesses pseudotetragonal structure with lattice parameters a = b = 3.9401 Å, c = 3.9611 Å, as confirmed by Rietveld refinement (Fig. S1). The similar behavior for La doped BFO has also been reported in the previous literature.34 It is known that the rhombohedral structure can be regarded as evolving from the ideal cubic perovskite structure,35 where the ferroelectric distortion of BFO is mainly attributed to the hybridization of Bi 6s and O 2p orbitals as the lone‐pair orbital of Bi 6s is stereochemically active.36 The substitution of La for Bi is believed to weaken the lone‐pair activity, leading to decrease of the distortion and a general transition from the polar rhombohedral symmetry to the pseudotetragonal structure.37 Fig. 1b shows the measured Raman scattering spectra of the BFO and BLFO at room temperature. Since Raman scattering spectra are sensitive to atomic displacements, the evolvement of Raman normal modes provides valuable information about ionic substitution. By fitting the measured spectra and decomposing the fitted curves into individual components, the positions of the peaks were obtained. For BFO, ten normal modes, including A1‐1, A1‐2, A1‐3, E‐1, E‐4, E‐5, E‐6, E‐7, E‐8 and E‐9 mode,
Fig. 1 (a) XRD patterns and (b) Raman spectra of BFO and BLFO.
are found at 140, 174, 226, 79, 273, 349, 371, 472, 522 and 626 cm‐1, respectively, which coincide well with the previous report.38 The A1‐
1, A1‐2, A1‐3, E‐1 modes are dominated by the Bi–O covalent
bonds.39 Compared with the BFO, the BLFO exhibits that E‐1 mode disappears, and the intensity of A1‐1, A1‐2 and A1‐3 weakens,
indicating that the hybridization of Bi and O is weakened due to the substitution of La for Bi.
The elemental components of the BFO and BLFO are identified by XPS. Fig. 2a shows a general XPS profile for the BFO and BLFO. The BFO is completely composed of Bi, Fe and O elements while the BLFO consists of Bi, La, Fe and O elements. No other elemental signals are detected in the spectrum. The O 1s profile in the BFO and BLFO has three components (Fig. 2b and 2c). The main peak at ~ 529.4 eV corresponds to the cation‐oxygen bonds. The further higher‐energy peaks at ~ 530.6 eV and at ~ 532.1 eV are assigned to adsorbed surface H2O as well as the presence of oxygen vacancies,
respectively.40 It is observed that the concentration of oxygen vacancies in the BLFO is lower than that of the BFO. Fig. 2d and 2e show the Fe 2p3/2 profile to determine the oxidation state of Fe. The
asymmetric Fe 2p3/2 profile has two components at ~ 710.1 eV and
~ 713.2 eV corresponding to the Fe2+ and Fe3+ chemical states, and the percentage of Fe2+ decrease significantly after La doping. It is
RSC
Advances
Accepted
[image:4.595.311.576.65.433.2]Journal Name ARTICLE
This journal is © The Royal Society of Chemistry 20xx J. Name., 2013, 00, 1‐3 | 3
Please do not adjust margins
Fig. 2 (a) X‐ray photoelectron spectroscopy of BFO and BLFO. High‐resolution XPS of O 1s core levels for (b) BFO and (c) BLFO. High‐resolution XPS of Fe 2p core levels for (d) BFO and (e) BLFO.
known that Fe2+ and oxygen vacancies appear simultaneously for charge compensation in BFO materials.41 This implies that the
concentration of oxygen vacancies decrease after doping, which is
[image:5.595.65.273.70.420.2]
coincident with the results of the density of states (Fig. S2). Fig. 3 show the TEM images of the BLFO and BFO. The BLFO and BFO have a grain size of 20 – 90 nm (Fig. 3a‐d). The SEM images of BLFO and BFO are shown in Fig. S3. The particles have the random shapes. The high‐resolution TEM (HRTEM) images of the BLFO and BFO are shown in Fig. 3e and 3f. The HRTEM image of the BLFO highlights the well‐defined interplanar spacing of 0.39 nm, which is indexed as (001) crystal plane (Fig. 3e). For BFO, the interplanar spacing is about 0.27 and 0.28 nm, corresponding to the (110) and (104) crystal plane of R3c phase BFO, respectively. The inset in Fig. 3f exhibits a corresponding selected are electron diffraction (SAED) with zone axis [‐4‐41]. The diffraction spots can be assigned to diffraction planes of the rhombohedral structure of BFO. The corresponding SAED with zone axis [‐110] for BLFO shows the (001), (110) and (111) crystal planes of the pseudotetragonal structure of BLFO (Fig. 3g). The superlattice reflection of 1/2(001) and
1
/2(111)
type is clearly observed, indicating a structural modulation in the BLFO which is probably due to cations and oxygen vacancy ordering. Fig. 3h shows the one‐dimensional diffraction profiles of the SAED patterns for BFO and BLFO using an XRD analysis package, which coincides with the XRD patterns of the powders.
The magnetization hysteresis loops of BFO and BLFO are shown in Fig. 4. It is found that the BFO possesses weak ferromagnetic behavior due to the fact that its spatially modulated spiral spin (SMSS) structure prevents the observation of the net magnetization.42 The spontaneous magnetization (Ms) of the BFO is
0.15 emu/g for the maximum magnetic field of 17.5 kOe. The ferromagnetic properties of the BLFO increase remarkably, of which
Ms reachs up to 0.85 emu/g. According to the partially enlarged
curve (the inset of Fig. 4), the remanent magnetization (Mr) and
coercive field (Hc) of the BLFO is also much higher than that of BFO.
The enhancement of the magnetization for the BLFO may be attributed to the structure and electron structure of BLFO. The structure transformation and structure ordering can suppress SMSS
[image:5.595.72.563.504.729.2]
Fig. 3 TEM images of (a, c) BLFO and (b, d) BFO. HRTEM images of (e) BLFO and (f) BFO, the inset in Fig. 3f is the SAED patterns BFO. (g) The SAED patterns of BLFO, the superlattice reflection is highlighted by blue and red circle. (h) The one‐dimensional diffraction profiles of the BFO and BLFO generated by the SAED patterns.
Page 3 of 7
RSC Advances
RSC
Advances
Accepted
Journal Name ARTICLE
[image:6.595.304.573.66.302.2]
Fig. 4 Hysteresis loops of BFO and BLFO at room temperature.
to increase magnetization. In addition, La doping weakens the hybridization of O 2p and Bi 6s orbits. The O 2p electrons in BLFO have higher probability to occupy Fe 3d orbitals than that in BFO, leading to the strengthening of the exchange interaction. Therefore, La doping can enhances the magnetization.
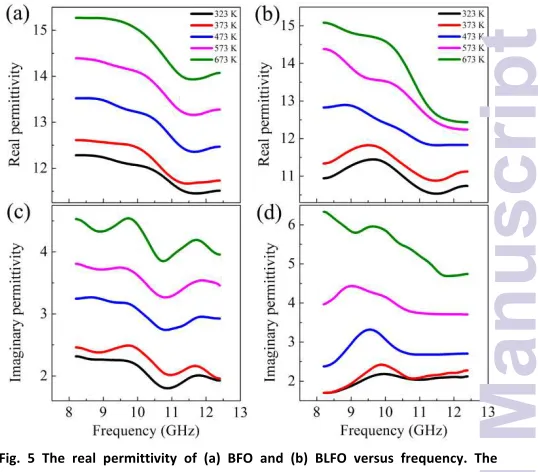
Fig. 5 shows the complex permittivity of BFO and BLFO as a function of frequency in the range of 8.2‐12.4 GHz at elevated temperatures. The observed real permittivity (ε′) of BFO and BLFO shows decreasing trend with the increase of frequency (Fig 6a and 6b), attributed to the relaxation effect.43 In addition, the ε′ of BLFO is generally lower than that of BFO at the same temperature. According to Debye theory:
1
2 2 sε
ε
ε
ε
ω τ
∞ ∞−
′
=
+
+
(1)
Where ω is the angular frequency, ε∞ the relative dielectric
permittivity at the high frequency limit, εs the static permittivity,
and τ the relaxation time. Among the influences of natural resonance, polarization, and other factors, polarization is an essential factor in real permittivity in the GHz range. Fig. S4shows the difference charge density of BFO and BLFO. For BFO and BLFO, the charge asymmetric distributions appear at Bi ion sites due to the lone pair of Bi ion. Moreover, the charge asymmetric distributions appear at Fe ion sites adjacently to oxygen vacancy in BFO, where the existence of oxygen vacancy breaks the charge balance of crystal structure. Therefore, BFO possesses intrinsic and defect dipole polarization which are caused by the lone pair of Bi ion and oxygen vacancy defect, while BLFO exhibits intrinsic dipole polarization. In addition, interfacial polarization between the particles may be formed in BFO and BLFO. Compared with the dipole polarizations, however, the interface polarization is weak due to the similar polarity and conductivity between the particles. Hence, the main contribution to permittivity is the dipole polarizations. The substitution of La reduces oxygen vacancies, leading to weakening the defect dipole polarization. Therefore, ε′ of BLFO decrease due to the substitution of La.
The imaginary permittivity (ε″) of BFO and BLFO is shown in Fig. 5c and 5d. The ε₺ of BFO and BLFO exhibits obvious dielectric
Fig. 5 The real permittivity of (a) BFO and (b) BLFO versus frequency. The imaginary permittivity of (c) BFO and (d) BLFO versus frequency.
relaxation behavior. Two relaxations peaks are observed at ~ 9.6 GHz and ~ 11.8 GHz in BFO, which are caused by the intrinsic dipole and defect dipole, respectively. Only one relaxation peak for BLFO appears. This is attributed to the weakening of the defect dipole polarization due to decrease of oxygen vacancy concentration, leading to disappearance of the corresponding relaxation peak at high frequency.
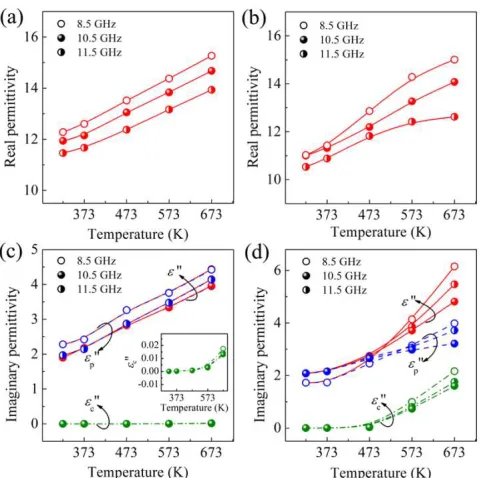
Fig. 6 shows the temperature dependence of the ε′ and ε₺ for BFO and BLFO. Both BFO and BLFO exhibit a monotonic increase in the ε′ with the increaes of temperture at the investigated frequencies. The ε′ of BLFO is smaller than that of BFO due to the weakening of the polarization from defect dipole (Fig. 6a and 6b). The ε′′ of BFO and BLFO increases with increasing temperature, and the ε′′ of BLFO is bigger than that of BFO above 473 K (Fig. 6c and 6d). The ε′′ follows the Debye theory as:
ε
ε
σ
ε
ωτ
ε ω
ω τ
∞
−
′′
=
+
+
2 2 01
!
(2)
where σ is the electrical conductivity, ε0 the vacuum permittivity.
Based on the electrical conductivity (Fig. S5), the conduction part (εc₺) and the polarization part (εp₺) of imaginary permittivity are
obtained. The εc₺ is in the magnitude of 10 ‐6
– 10‐2 for BFO (the inset of Fig. 6c), which is much smaller than the εp₺. Therefore, the
main contribution to the ε₺ of BFO is polarization rather than conduction from 323 K to 673 K. For BLFO, the εc₺ is less than 10
‐2
below 473 K. The εc₺ increases greatly above 473 K. Although the εp₺
primarily contributes to the ε₺ over the full temperature range, the
εc₺ plays important role in the increase of the ε₺ above 473 K. In
addition, compared with BFO, BLFO has smaller εp₺ at 323 – 673 K,
which is attributed to the weakening of the polarization.
Fig. 7 shows the complex permeability of BFO and BLFO at elevated temperatures. The real permeability (μ′) and imaginary permeability (μ₺) of BLFO are bigger than that of BFO. The increase
RSC
Advances
Accepted
[image:6.595.56.280.67.250.2]Journal Name ARTICLE
This journal is © The Royal Society of Chemistry 20xx J. Name., 2013, 00, 1‐3 | 5
Please do not adjust margins
Fig. 6 The real permittivity of (a) BFO and (b) BLFO versus temperature at various frequencies. The imaginary permittivity, polarization part and conduction part of imaginary permittivity of (c) BFO and (d) BLFO versus temperature at various frequencies.
of the μ' is attributed to increase of magnetization, which is proved by the increase of the Ms and Mr. The eddy current
coefficientsμ₺(μ')‐2f‐1 of BFO and BNFO change with increasing frequency, indicating that the magnetic loss is not caused by eddy current loss (Fig. S6).44 It is suggested that magnetic loss of nano‐ sized BFO and BLFO in GHz frequency originates from natural ferromagnetic resonance. The increase of the Hc and the
strengthening of the exchange interaction for BLFO reveal the enhancement of the anisotropy field intensity and exchange interaction field intensity. Therefore, La doping strengthens natural
[image:7.595.47.289.65.304.2]
Fig. 7 The real permeability of (a) BFO and (b) BLFO versus frequency. The imaginary permeability of (c) BFO and (d) BLFO versus frequency.
ferromagnetic resonance, resulting in the increase of the μ₺. Fig. 8 shows the temperature dependence of the μ' and μ₺ for BFO and BLFO. With the increase of temperature, the μ′ increases while the μ₺ decreases. BFO and BLFO possesse antiferromagnetic configuration. When temperature is raised, the structure is destroyed gradually, leading to the increase of the μ′. On the other hand, the increase of temperature weakens the damping of magnetic moment precessing, hence the μ₺ decreases.
The BLFO with good microwave electromagnetism properties as aforementioned may offers effective EM wave attenuation. Therefore, EM wave attenuation of BFO and BLFO is evaluated based on the complex permittivity and permeability. The reflection loss (RL) at a given frequency and layer thickness can be calculated as45
in
in
1
20 log
1
Z
RL
Z
−
=
+
(3)
Here the normalized input impedance Zin of the electromagnetic
attenuation layer is given by
µ
π
µ
ε
ε
=
rin r r
r
2
tanh(
f d
)
Z
j
c
(4)
where c is the light velocity, f the electromagnetic wave frequency,
d the thickness of the absorber, εr the complex permittivity, and μr
the complex permeability. The three‐dimensional (3D) plots of RL for BFO and BLFO with thickness d = 2 mm are shown in Fig. 9a and 9b, respectively. It is observed that the maximum attenuation shifts toward lower frequency and higher temperature in BFO and BLFO. The minimum (Min.) RL of BFO is ‐20.4 dB at 673 K. The Min. RL of BLFO is more than ‐54 dB at 573 K, which is almost triple that of BFO. In the frequency investigated, the effective reflection loss (RL
≤ ‐10 dB) of BLFO covers wider frequency range than that of BFO, exhibiting the good frequency stability. The widest frequency range of BLFO is 3.3 GHz. Furthermore, the reflection loss with RL ≤ ‐20 dB for BLFO covers about 0.5–1.5 GHz, and the frequency range widens markedly with increasing temperature. Fig. 9c and 9d show the 3D plots of RL for BFO and BLFO versus thickness and frequency at 573 K. The effective attenuation region (RL ≤ ‐10 dB) of BLFO is wider than that of BFO. The effective reflection loss of BLFO covers the entire X‐band at 1.80 mm.
[image:7.595.43.285.512.723.2]
Fig. 8 The real permeability of (a) BFO and (b) BLFO versus temperature at various frequencies.
Page 5 of 7
RSC Advances
RSC
Advances
Accepted
[image:7.595.303.570.573.709.2]ARTICLE JNanoscale
[image:8.595.46.277.67.231.2]
Fig. 9 The 3D plots of reflection loss versus frequency and temperature for (a) BFO and (b) BLFO. The 3D plots of reflection loss versus frequency and thickness for (c) BFO and (d) BLFO.
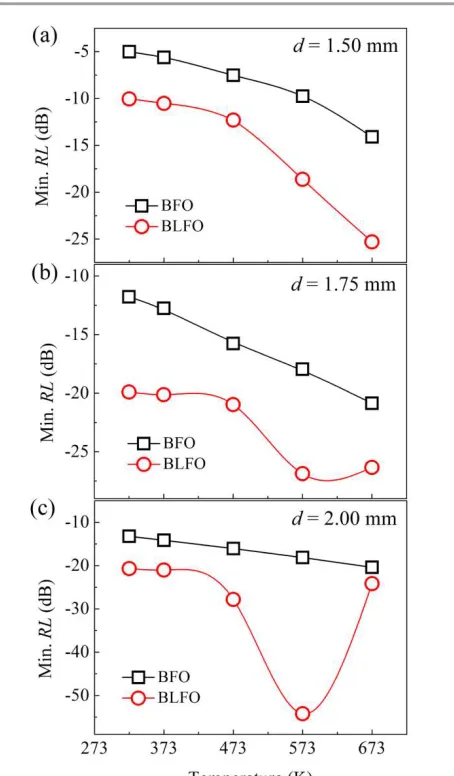
Fig. 10 shows the Min. RL of BFO and BLFO with the increase of temperature. Compared with BFO, BLFO exhibits outstanding
Fig. 10 The minimum reflection loss versus temperature at various thicknesses for BFO and BLFO.
temperature stability of attenuation. The Min. RL of BFO and BLFO decreases with increasing temperature at d = 1.50 mm and 1.75 mm(Fig 10a and 10b). The Min. RL of BLFO is less than the effective reflection loss from 323 K to 673 K at d = 1.50, which is almost double that of BFO. The Min. RL of BLFO nearly reaches ‐20 dB for all temperature at d = 1.75 mm. For d = 2.00 mm, the Min. RL of BLFO is below ‐20 dB in the full temperature range, indicating high‐ efficiency and stable attenuation (Fig 10c). EM wave attenuation are mainly associated with matching frequency, thickness of absorbers, and the complex permittivity and permeability, which are determined by their nature, shape, size and microstructure. In this work, the structural change due to the substitution of La for Bi is the important reason for BLFO to possess high‐efficiency and stable attenuation. The substitution of La increases the conductivity for BLFO at elevated temperature, which increases the electrical loss. Meanwhile, the substitution of La changes the structure and electron structure, which enhance the natural ferromagnetic resonance of BLFO, leading to the increase of magnetic loss. Moreover, the enhancement of the EM properties achieves the efficient complementarity between the permittivity and permeability at elevated temperature, which improves the electrical‐magnetic synergy. Therefore, the EM wave attenuation of BLFO increases greatly at elevated temperature.
Conclusions
In conclusion, La doped BFO demonstrates enhanced EM properties and stable EM wave attenuation at elevated temperature. The polarization primarily contributes to the ε₺ of BLFO, and the increase of the conduction plays important role in the increase of the ε₺ above 473 K. BLFO increases the μ₺ due to strengthening of natural ferromagnetic resonance. The Min. RL of BLFO reaches ‐54 dB at 573 K. The Min. RL of BLFO is less than the effective reflection loss in the full temperature range at d = 1.50 – 2.00 mm. The effective reflection loss of BLFO covers the entire X‐band at 1.80 mm at 573 K. La doping expands the applications of BFO as a new family of EM wave attenuation and provides a feasible strategy for the development of attenuation materials in communications, imaging, signal and data protection, and health detection fields.
Acknowledgements
This research was supported by the National Science Foundation of China (Grant Nos.51372282, 51402005 and 51132002).
Notes and references
1 Y. Zhang, Y. Huang, T. F. Zhang, H. C. Chang, P. S. Xiao, H. H. Chen, Z. Y. Huang and Y. S. Chen, Adv. Mater., 2015, 27, 2049. 2 H. C. Wang, N. Ma, Z. R. Yan, L. Deng, J. He, Y. L. Hou, Y. Jiang
and G. H. Yu, Nanoscale, 2015, 7, 7189.
3 B. Wen, X. X. Wang, W. Q. Cao, H. L. Shi, M. M. Lu, G. Wang, H. B. Jin, W. Z. Wang, J. Yuan and M. S. Cao, Nanoscale, 2014, 6, 5754.
4 H. Sun, R. C. Che, X. You, Y. S. Jiang, Z. B. Yang, J. Deng, L. B. Qiu and H. S. Peng, Adv. Mater., 2014, 26, 8120.
5 M. K. Han, X. W. Yin, L. Kong, M. Li, W. Y. Duan, L. T. Zhang and L. F. Cheng, J. Mater. Chem. A, 2014, 2, 16403.
RSC
Advances
Accepted
[image:8.595.58.285.319.707.2]Journal Name ARTICLE
This journal is © The Royal Society of Chemistry 20xx J. Name., 2013, 00, 1‐3 | 7
Please do not adjust margins
6 Z. J. Wang, L. N. Wu, J. G. Zhou, Z. H. Jiang and B. Z. Shen,
Nanoscale, 2014, 6, 12298.
7 Y. Chen, X. Y. Liu, X. Y. Mao, Q. X. Zhuang, Z. Xie and Z. W. Han, Nanoscale, 2014, 6, 6440.
8 X. Y. Lu, Y. Z. Wu, H. Y. Cai, X. Y. Qu, L. M. Ni, C. Teng, Y. Zhu and J. Liang, RSC Adv., 2015, 5, 541755.
9 J. Y. Fang, Z. Chen, W. Wei, Y. Li, T. Liu, Z. Liu, X. G. Yue, and Z. H. Jiang, RSC Adv., 2015, 5, 50024.
10 Z. J. Wang, L. N. Wu, J. G. Zhou, W. Cai, B. Z. Shen and Z. H. Jiang, J. Phys. Chem. C, 2013, 117, 5446.
11 J. Zhao, J. P. Lin, J. P. Xiao and H. L. Fan, RSC Adv., 2015, 5, 19345.
12 C. Y. Liu, Y. J. Xu, L. N. Wu, Z. H. Jiang, B. Z. Shen and Z. J. Wang, J. Mater. Chem. A, 2015, 3, 10566.
13 C. H. Gong, J. W. Zhang, X. F. Zhang, L. G. Yu, P. Y. Zhang, Z. S. Wu and Z. J. Zhang, J. Phys. Chem. C, 2010, 114, 10101. 14 H. L. Lv, X. H. Liang, Y. Cheng, G. B. Ji, D. M. Tang, B. S. Zhang,
H. Q. Zhang and Y. Du, RSC Adv., 2015, 5, 25936.
15 S. L. Wen, X. C. Zhao, Y. Liu, J. W. Cheng, and H. Li, RSC Adv., 2014, 4, 40456.
16 X. A. Fan, J. G. Guan, Z. Z. Li, F. Z. Mou, G. X. Tong and W. Wang, J. Mater. Chem., 2010, 20, 1676.
17 Q. H. Liu, X. H. Xu, W. X. Xia, R. C. Che, C. Chen, Q. Cao and J. G. He, Nanoscale, 2015, 7, 1736.
18 G. B. Sun, B. X. Dong, M. H. Cao, B. Q. Wei and C. W. Hu,
Chem. Mater., 2011, 23, 1587.
19 H. Wang, L. N. Wu, J. F. Jiao, J. G. Zhou, Y. J. Xu, H. Y. Zhang, Z. H. Jiang, B. Z. Shen and Z. J. Wang, J. Mater. Chem. A, 2015, 3, 6517.
20 B. Zhao, G. Shao, B. B. Fan, W. Y. Zhao and R. Zhang, RSC Adv., 2015, 5, 42587.
21 Z. H. Yang, Z. W. Li, Y. H. Yang and Z. C. J. Xu, ACS Appl. Mater. Interfaces, 2014, 6, 21911.
22 S. Hazra, B. K. Ghosh, H. R. Joshi, M. K. Patra, R. K. Jani, S. R. Vaderab and N. N. Ghosh, RSC Adv., 2014, 4, 45715.
23 X. Q. Shen, F. Z. Song, J. Xiang, M. Q. Liu, Y. W. Zhu, and Y. D. Wang, J. Am. Ceram. Soc., 2012, 95, 3863.
24 C. Y. Liang, C. Y. Liu, H, Wang, L. N. Wu, Z. H. Jiang, Y. J. Xu, B. Z. Shen and Z. J. Wang, J. Mater. Chem. A, 2014, 2, 16397. 25 D. P. Sun, Q. Zou, Y. P. Wang, Y. J. Wang, W. Jiang and F. S. Li,
Nanoscale, 2014, 6, 6557.
26 X. G Liu, N. D. Wu, C. Y. Cui, N. N. Bi, and Y. P. Sun, RSC Adv., 2015, 5, 24016.
27 J. J. Jiang, D. Li, S. J. Li, Z. H. Wang, Y. Wang, J. He, W. Liu, and Z. D. Zhang, RSC Adv., 2015, 5, 14584.
28 Z. J. Wang, L. N. Wu, J. G. Zhou, B. Z. Shen and Z. H. Jiang,
RSC Adv., 2013, 3, 3309.
29 T. Zheng and J. G. Wu, J. Mater. Chem. C, 2015, 3, 3684. 30 L. F. Fei, Y. M. Hu, X. Li, R. B. Song, L. Sun, H. T. Huang, H. S.
Gu, H. L. W. Chan and Y. Wang, ACS Appl. Mater. Interfaces, 2015, 7, 3665.
31 R. Moubah, O. Rousseau, D. Colson, A. Artemenko, M. Maglione and M. Viret, Adv. Funct. Mater., 2012, 22, 4814. 32 Y. Q. Kang, M. S. Cao, J. Yuan and X. L. Shi, Mater. Lett., 2009,
63, 1344.
33 F. S. Wen, N. Wang and F. Zhang, Solid State Commun., 2010, 150, 1888.
34 G. L. Yuan, S. W. Or and H. L. W. Chan, J. Phys. D: Appl. Phys., 2007, 40, 1196.
35 C. Ederer and N. A. Spaldin, Phys. Rev. B 2005, 71, 060401(R). 36 P. Ravindran, R. Vidya, A. Kjekshus, H. Fjellvag and O.
Eriksson, Phys. Rev. B, 2006, 74, 224412.
37 G. Catalan and J. F. Scott, Adv. Mater., 2009, 21, 2463. 38 M. K. Singh, H. M. Jang, S. Ryu and M. H. Jo. Appl. Phys. Lett.,
2006, 88, 42907.
39 G. L. Yuan, S. W. Or and H. L. W. Chan, J. Appl. Phys., 2007, 101, 064101.
40 W. B. Hu, Y. Liu, R. L. Withers, T. J. Frankcombe, L. Norén, A Snashall, M. Kitchin, P. Smith, B. Gong, H. Chen, J. Schiemer, F. Brink and J. Wong‐Leung, Nat. Mater., 2013, 12, 821. 41 A. Tamilselvan, S. Balakumar, M. Sakar, C. Nayek, P.
Murugavel and K. S. Kumar, Dalton Trans., 2014, 43,5731. 42 J. B. Li, G. H. Rao, Y. Xiao, J. K. Liang, J. Luo, G. Y. Liu and J. R.
Chen, Acta Mater., 2010, 58, 3701.
43 B. Wen, M. S. Cao, Z. L. Hou, W. L. Song, L. Zhang, M. M. Lu, H. B. Jin, X. Y. Fang, W. Z. Wang and J. Yuan, Carbon, 2013, 65, 124.
44 G. Z. Wang, Z. Gao, S. W. Tang, C. Q. Chen, F. F. Duan, S. C. Zhao, S. W. Lin, Y. H. Feng, L. Zhou and Y. Qin, ACS Nano, 2012, 6, 11009.
45 G. X. Tong, F. F. Du, L. J. Xiang, F. T. Liu, L. L. Mao and J. G. Guan, Nanoscale, 2014, 6, 778.