B
RUCE
P
ERENS
’ O
PEN
S
OURCE
S
ERIES
www.phptr.com/perens◆ Java™ Application Development on Linux® Carl Albing and Michael Schwarz
◆ C++ GUI Programming with Qt 3
Jasmin Blanchette and Mark Summerfield
◆ Managing Linux Systems with Webmin: System Administration and Module Development Jamie Cameron
◆ Understanding the Linux Virtual Memory Manager Mel Gorman
◆ PHP 5 Power Programming
Andi Gutmans, Stig Bakken, and Derick Rethans
◆ Linux® Quick Fix Notebook Peter Harrison
◆ Implementing CIFS: The Common Internet File System Christopher Hertel
◆ Open Source Security Tools: A Practical Guide to Security Applications Tony Howlett
◆ Apache Jakarta Commons: Reusable Java™ Components Will Iverson
◆ Embedded Software Development with eCos Anthony Massa
◆ Rapid Application Development with Mozilla Nigel McFarlane
◆ Subversion Version Control: Using the Subversion Version Control System in Development Projects
William Nagel
◆ Intrusion Detection with SNORT: Advanced IDS Techniques Using SNORT, Apache, MySQL, PHP, and ACID
Rafeeq Ur Rehman
◆ Cross-Platform GUI Programming with wxWidgets Julian Smart and Kevin Hock with Stefan Csomor
◆ Samba-3 by Example, Second Edition: Practical Exercises to Successful Deployment John H. Terpstra
◆ The Official Samba-3 HOWTO and Reference Guide, Second Edition John H. Terpstra and Jelmer R. Vernooij, Editors
◆ Self-Service Linux®: Mastering the Art of Problem Determination Mark Wilding and Dan Behman
Mark Wilding and Dan Behman
PRENTICE HALL
Professional Technical Reference Upper Saddle River, NJ ●Boston ●
Indianapolis●San Francisco●New York ●
Toronto ●Montreal ● London ● Munich ●
Paris ● Madrid ● Capetown ● Sydney ●
Tokyo ● Singapore ● Mexico City
was aware of a trademark claim, the designations have been printed with initial capital letters or in all capitals.
The authors and publisher have taken care in the preparation of this book, but make no expressed or implied warranty of any kind and assume no responsibility for errors or omissions. No liability is assumed for incidental or consequential damages in connection with or arising out of the use of the information or programs contained herein.
The publisher offers excellent discounts on this book when ordered in quantity for bulk purchases or special sales, which may include electronic versions and/or custom covers and content particular to your business, training goals, marketing focus, and branding interests. For more information, please contact:
U. S. Corporate and Government Sales (800) 382-3419
For sales outside the U. S., please contact:
International Sales
Visit us on the Web:www.phptr.com
Library of Congress Number: 2005927150 Copyright © 2006 Pearson Education, Inc.
This material may be distributed only subject to the terms and conditions set forth in the Open Publication License, v1.0 or later (the latest version is presently available at http:// www.opencontent.org/openpub/).
ISBN 0-13-147751-X
Text printed in the United States on recycled paper at R.R. Donnelley in Crawfordsville, Indiana.
kidding... Without Caryna’s support and understanding, I could never have written this book. Not only did she help me find time to write, she also spent countless hours
formatting the entire book for production. I would also like to dedicate this book to my two sons, Rhys and Dylan, whose boundless energy acted as inspiration
throughout the writing of this book.
Mark Wilding
Without the enduring love and patience of my wife Kim, this laborous project would have halted long ago. I dedicate this book to her,
as well as to my beautiful son Nicholas, my family, and all of the Botzangs and Mayos.
Preface
Chapter 1: Best Practices and Initial Investigation Chapter 2: strace and System Call Tracing Explained Chapter 3: The /proc Filesystem
Chapter 4: Compiling Chapter 5: The Stack
Chapter 6: The GNU Debugger (GDB)
Chapter 7: Linux System Crashes and Hangs Chapter 8: Kernel Debugging with KDB
Chapter 9: ELF: Executable and Linking Format
A: The Toolbox
B: Data Collection Script
Preface xvii
1 Best Practices and Initial Investigation 1
1.1 Introduction 1
1.2 Getting Your System(s) Ready for Effective Problem
Determination 2
1.3 The Four Phases of Investigation 3
1.3.1 Phase #1: Initial Investigation Using Your Own Skills 5
1.3.2 Phase #2: Searching the Internet Effectively 9
1.3.3 Phase #3: Begin Deeper Investigation (Good Problem
Investigation Practices) 12
1.3.4 Phase #4: Getting Help or New Ideas 21
1.4 Technical Investigation 28
1.4.1 Symptom Versus Cause 28
1.5 Troubleshooting Commercial Products 38
1.6 Conclusion 39
2 strace and System Call Tracing Explained 41
2.1 Introduction 41
2.2 What Is strace? 41
2.2.1 More Information from the Kernel Side 45
2.2.2 When to Use It 48
2.2.3 Simple Example 49
2.2.4 Same Program Built Statically 53
2.3 Important strace Options 54
2.3.1 Following Child Processes 54
2.3.2 Timing System Call Activity 55
○ ○ ○ ○ ○ ○ ○ ○ ○ ○ ○ ○ ○ ○ ○ ○ ○ ○ ○ ○ ○ ○ ○ ○ ○ ○ ○ ○ ○ ○ ○ ○ ○ ○ ○ ○ ○ ○ ○ ○ ○ ○ ○ ○ ○ ○ ○ ○ ○ ○ ○ ○ ○ ○ ○ ○ ○ ○ ○ ○ ○ ○ ○ ○ ○ ○ ○ ○ ○ ○ ○
○ ○ ○ ○ ○ ○ ○ ○ ○ ○ ○ ○ ○ ○ ○ ○ ○
○ ○ ○ ○ ○ ○
○ ○ ○ ○ ○ ○ ○ ○ ○ ○ ○ ○ ○ ○ ○ ○ ○ ○
○ ○ ○ ○ ○ ○ ○ ○ ○ ○ ○
○ ○ ○ ○ ○ ○ ○ ○ ○ ○ ○ ○ ○ ○ ○ ○ ○ ○ ○ ○ ○ ○ ○
○ ○ ○ ○ ○ ○ ○ ○ ○ ○ ○ ○ ○ ○ ○ ○ ○ ○
○ ○ ○ ○ ○ ○ ○ ○ ○ ○ ○ ○ ○ ○ ○
○ ○ ○ ○ ○ ○ ○ ○ ○ ○
○ ○ ○ ○ ○ ○ ○ ○ ○ ○ ○ ○ ○ ○ ○ ○ ○ ○ ○ ○ ○ ○ ○ ○ ○ ○ ○ ○ ○
○ ○ ○ ○ ○ ○ ○ ○ ○ ○ ○ ○ ○ ○ ○ ○ ○ ○ ○ ○ ○ ○ ○ ○ ○ ○ ○ ○ ○ ○ ○ ○ ○ ○ ○ ○ ○ ○ ○ ○ ○ ○ ○ ○ ○ ○ ○ ○ ○ ○ ○ ○ ○ ○ ○ ○ ○ ○ ○
○ ○ ○ ○ ○ ○ ○ ○ ○ ○ ○ ○ ○ ○ ○ ○ ○ ○ ○ ○ ○ ○ ○ ○
○ ○ ○ ○ ○ ○ ○ ○ ○ ○ ○ ○ ○ ○ ○ ○ ○ ○ ○ ○ ○ ○ ○
○ ○ ○ ○ ○ ○ ○ ○ ○ ○ ○ ○ ○ ○ ○
○ ○ ○ ○ ○ ○ ○ ○ ○ ○ ○ ○ ○ ○ ○ ○ ○ ○ ○ ○ ○ ○ ○ ○ ○ ○ ○ ○ ○ ○ ○ ○ ○ ○ ○
○ ○ ○ ○ ○ ○ ○ ○ ○ ○ ○ ○ ○ ○ ○ ○ ○
2.3.3 Verbose Mode 57
2.3.4 Tracing a Running Process 59
2.4 Effects and Issues of Using strace 60
2.4.1 strace and EINTR 61
2.5 Real Debugging Examples 62
2.5.1 Reducing Start Up Time by Fixing
LD_LIBRARY_PATH 62
2.5.2 The PATH Environment Variable 65
2.5.3 stracing inetd or xinetd (the Super Server) 66
2.5.4 Communication Errors 68
2.5.5 Investigating a Hang Using strace 69
2.5.6 Reverse Engineering (How the strace Tool Itself Works) 71
2.6 System Call Tracing Examples 74
2.6.1 Sample Code 75
2.6.2 The System Call Tracing Code Explained 87
2.7 Conclusion 88
3 The /proc Filesystem 89
3.1 Introduction 89
3.2 Process Information 90
3.2.1 /proc/self 90
3.2.2 /proc/<pid> in More Detail 91
3.2.3 /proc/<pid>/cmdline 107
3.2.4 /proc/<pid>/environ 107
3.2.5 /proc/<pid>/mem 107
3.2.6 /proc/<pid>/fd 108
3.2.7 /proc/<pid>/mapped base 108
3.3 Kernel Information and Manipulation 109
3.3.1 /proc/cmdline 109
3.3.2 /proc/config.gz or /proc/sys/config.gz 109
3.3.3 /proc/cpufreq 109
3.3.4 /proc/cpuinfo 110
3.3.5 /proc/devices 110
3.3.6 /proc/kcore 111
3.3.7 /proc/locks 111
3.3.8 /proc/meminfo 111
3.3.9 /proc/mm 111
3.3.10 /proc/modules 112
3.3.11 /proc/net 112
3.3.12 /proc/partitions 112
3.3.13 /proc/pci 113
3.3.14 /proc/slabinfo 113
3.4 System Information and Manipulation 113
3.4.1 /proc/sys/fs 113
3.4.2 /proc/sys/kernel 115
3.4.3 /proc/sys/vm 120
3.5 Conclusion 120
4 Compiling 121
4.1 Introduction 121
4.2 The GNU Compiler Collection 121
4.2.1 A Brief History of GCC 121
4.2.2 GCC Version Compatibility 122
4.3 Other Compilers 122
4.4 Compiling the Linux Kernel 123
4.4.1 Obtaining the Kernel Source 123
4.4.2 Architecture Specific Source 124
4.4.3 Working with Kernel Source Compile Errors 124
4.4.4 General Compilation Problems 128
4.5 Assembly Listings 133
4.5.1 Purpose of Assembly Listings 134
4.5.2 Generating Assembly Listings 135
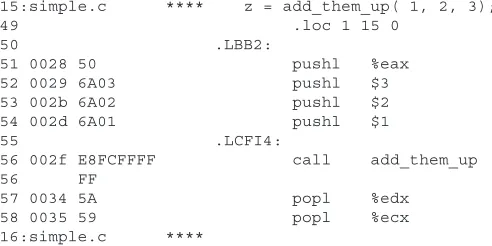
4.5.3 Reading and Understanding an Assembly Listing 136
4.6 Compiler Optimizations 140
4.7 Conclusion 149
5 The Stack 151
5.1 Introduction 151
5.2 A Real-World Analogy 152
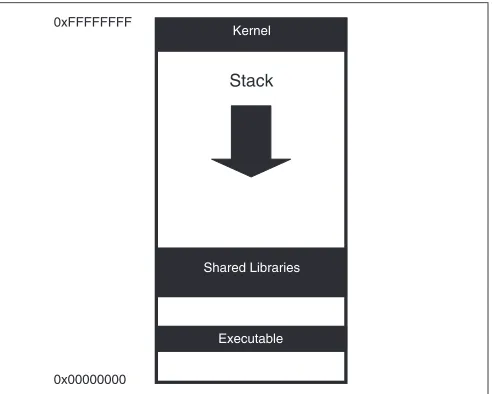
5.3 Stacks in x86 and x86-64 Architectures 153
5.4 What Is a Stack Frame? 157
5.5 How Does the Stack Work? 159
5.5.1 The BP and SP Registers 159
5.5.2 Function Calling Conventions 162
5.6 Referencing and Modifying Data on the Stack 171
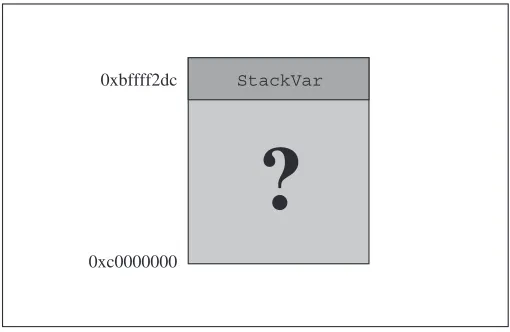
5.7 Viewing the Raw Stack in a Debugger 173
5.8 Examining the Raw Stack in Detail 176
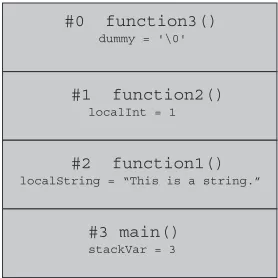
5.8.1 Homegrown Stack Traceback Function 180
5.9 Conclusion 191
6 The GNU Debugger (GDB) 193
6.1 Introduction 193
6.2 When to Use a Debugger 194
6.3 Command Line Editing 195
6.4 Controlling a Process with GDB 196
6.4.1 Running a Program Off the Command Line with GDB 197
6.4.2 Attaching to a Running Process 199
6.4.3 Use a Core File 200
6.5 Examining Data, Memory, and Registers 204
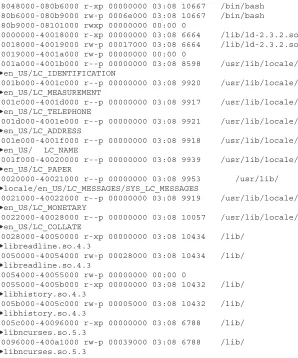
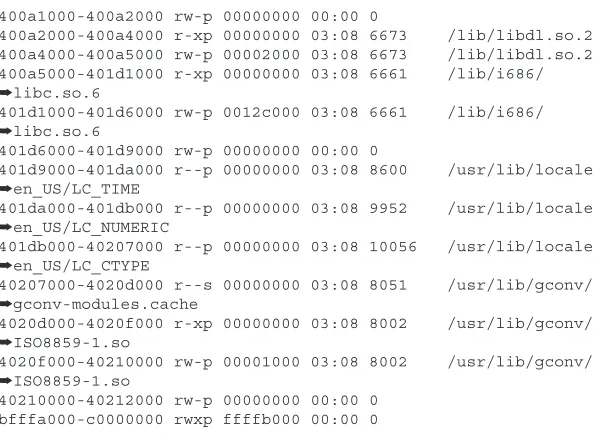
6.5.1 Memory Map 204
6.5.2 Stack 206
6.5.3 Examining Memory and Variables 210
6.5.4 Register Dump 217
6.6 Execution 220
6.6.1 The Basic Commands 221
6.6.2 Settings for Execution Control Commands 223
6.6.3 Breakpoints 228
6.6.4 Watchpoints 230
6.6.5 Display Expression on Stop 234
6.6.6 Working with Shared Libraries 235
6.7 Source Code 238
6.8 Assembly Language 240
6.9 Tips and Tricks 241
6.9.1 Attaching to a Process—Revisited 241
6.9.2 Finding the Address of Variables and Functions 244
6.9.3 Viewing Structures in Executables without Debug
Symbols 246
6.9.4 Understanding and Dealing with Endian-ness 250
6.10 Working with C++ 252
6.10.1 Global Constructors and Destructors 252
6.10.2 Inline Functions 256
6.10.3 Exceptions 257
6.11 Threads 260
6.11.1 Running Out of Stack Space 265
6.12 Data Display Debugger (DDD) 266
6.12.1 The Data Display Window 268
6.12.2 Source Code Window 272
6.12.3 Machine Language Window 273
6.12.4 GDB Console Window 274
6.13 Conclusion 274
7 Linux System Crashes and Hangs 275
7.1 Introduction 275
7.2 Gathering Information 275
7.2.1 Syslog Explained 276
7.2.2 Setting up a Serial Console 277
7.2.3 Connecting the Serial Null-Modem Cable 278
7.2.4 Enabling the Serial Console at Startup 279
7.2.5 Using SysRq Kernel Magic 281
7.2.6 Oops Reports 281
7.2.7 Adding a Manual Kernel Trap 281
7.2.8 Examining an Oops Report 284
7.2.9 Determining the Failing Line of Code 289
7.2.10 Kernel Oopses and Hardware 293
7.2.11 Setting up cscope to Index Kernel Sources 294
7.3 Conclusion 295
8 Kernel Debugging with KDB 297
8.1 Introduction 297
8.2 Enabling KDB 297
8.3 Using KDB 299
8.3.1 Activating KDB 299
8.3.2 Resuming Normal Execution 300
8.3.3 Basic Commands 300
8.4 Conclusion 305
9 ELF: Executable and Linking Format 307
9.1 Introduction 307
9.2 Concepts and Definitions 309
9.2.1 Symbol 309
9.2.2 Object Files, Shared Libraries, Executables, and Core
Files 311
9.2.3 Linking 314
9.2.4 Run Time Linking 318
9.2.5 Program Interpreter / Run Time Linker 318
9.3 ELF Header 318
9.4 Overview of Segments and Sections 324
9.5 Segments and the Program Header Table 325
9.5.1 Text and Data Segments 329
9.6 Sections and the Section Header Table 331
9.6.1 String Table Format 335
9.6.2 Symbol Table Format 335
9.6.3 Section Names and Types 338
9.7 Relocation and Position Independent Code (PIC) 362
9.7.1 PIC vs. non-PIC 363
9.7.2 Relocation and Position Independent Code 366
9.7.3 Relocation and Linking 367
9.8 Stripping an ELF Object 371
9.9 Program Interpreter 372
9.9.1 Link Map 376
9.10 Symbol Resolution 377
9.11 Use of Weak Symbols for Problem Investigations 382
9.12 Advanced Interception Using Global Offset Table 386
9.13 Source Files 390
9.14 ELF APIs 392
9.15 Other Information 392
9.16 Conclusion 392
A The Toolbox 393
A.1 Introduction 393
A.2 Process Information and Debugging 393
A.2.1 Tool: GDB 393
A.2.2 Tool: ps 393
A.2.3 Tool: strace (system call tracer) 394
A.2.4 Tool: /proc filesystem 394
A.2.5 Tool: DDD (Data Display Debugger) 394
A.2.6 Tool: lsof (List Open Files) 394
A.2.7 Tool: ltrace (library call tracer) 395
A.2.8 Tool: time 395
A.2.9 Tool: top 395
A.2.10 Tool: pstree 396
A.3 Network 396
A.3.1 Tool: traceroute 396
A.3.2 File: /etc/hosts 396
A.3.3 File: /etc/services 396
A.3.4 Tool: netstat 397
A.3.5 Tool: ping 397
A.3.6 Tool: telnet 397
A.3.7 Tool: host/nslookup 397
A.3.8 Tool: ethtool 398
A.3.9 Tool: ethereal 398
A.3.10 File: /etc/nsswitch.conf 398
A.3.11 File: /etc/resolv.conf 398
A.4 System Information 399
A.4.1 Tool: vmstat 399
A.4.2 Tool: iostat 399
A.4.3 Tool: nfsstat 399
A.4.4 Tool: sar 400
A.4.5 Tool: syslogd 400
A.4.6 Tool: dmesg 400
A.4.7 Tool: mpstat 400
A.4.8 Tool: procinfo 401
A.4.9 Tool: xosview 401
A.5 Files and Object Files 401
A.5.1 Tool: file 401
A.5.2 Tool: ldd 401
A.5.3 Tool: nm 402
A.5.4 Tool: objdump 402
A.5.5 Tool: od 402
A.5.6 Tool: stat 402
A.5.7 Tool: readelf 403
A.5.8 Tool: strings 403
A.6 Kernel 403
A.6.1 Tool: KDB 403
A.6.2 Tool: KGDB 403
A.6.3 Tool: ksymoops 404
A.7 Miscellaneous 404
A.7.1 Tool: VMWare Workstation 404
A.7.2 Tool: VNC Server 405
A.7.3 Tool: VNC Viewer 405
B Data Collection Script 407
B.1 Overview 407
B.1.1 -thorough 409
B.1.2 -perf, -hang <pid>, -trap, -error <cmd> 409
B.2 Running the Script 410
B.3 The Script Source 410
B.4 Disclaimer 419
Mark Wilding is a senior developer at IBM who currently specializes in serviceability technologies, UNIX, and Linux. With over 15 years of experience writing software, Mark has extensive expertise in operating systems, networks, C/C++ development, serviceability, quality engineering, and computer hardware.
Preface
Linux is the ultimate choice for home and business users. It is powerful, as stable as any commercial operating system, secure, and best of all, it is open source. One of the biggest deciding factors for whether to use Linux at home or for your business can be service and support. Because Linux is developed by thousands of volunteers from around the world, it is not always clear who to turn to when something goes wrong.
In the true spirit of Linux, there is a slightly different approach to support than the commercial norm. After all, Linux represents an unparalleled community of experts, it includes industry leading problem determination tools, and of course, the product itself includes the source code. These resources are in addition to the professional Linux support services that are available from companies, such as IBM, and the various Linux vendors, such as Redhat and SUSE. Making the most of these additional resources is called “self-service” and is the main topic covered by this book.
who use Linux at work, being able to quickly and effectively diagnose problems on Linux can increase their value as employees as well as their marketability. For corporate leaders deciding whether to adopt Linux as part of the corporate strategy, self-service for Linux means reduced operation costs and increased Return on Investment (ROI) for any Linux adoption strategy. Regardless of what type of Linux user you are, it is important to make the most of your Linux experience and investment.
W
HATI
S THISB
OOKA
BOUT?
In a nutshell, this book is about effectively and efficiently diagnosing problems that occur in the Linux environment. It covers good investigation practices, how to use the information and resources on the Internet, and then dives right into detail describing how to use the most important problem determination tools that Linux has to offer.
Chapter 1 is like a crash course on effective problem determination practices, which will help you to diagnose problems like an expert. It covers where and how to look for information on the Internet as well as how to start investigating common types of problems.
Chapter 2 covers strace, which is arguably the most frequently used problem determination tool in Linux. This chapter includes both practical usage information as well as details about how strace works. It also includes source code for a simple strace tool and details about how the underlying functionality works with the kernel through the ptrace interface.
Chapter 3 is about the /proc filesystem, which contains a wealth of information about the hardware, kernel, and processes that are running on the system. The purpose of this chapter is to point out and examine some of the more advanced features and tricks primarily related to problem determination and system diagnosis. For example, the chapter covers how to use the SysRq Kernel Magic hotkey with /proc/sys/kernel/sysrq.
Chapter 5 covers intimate details about the stack, one of the most important and fundamental concepts of a computer system. Besides explaining all the gory details about the structure of a stack (which is pretty much required knowledge for any Linux expert), the chapter also includes and explains source code that can be used by the readers to generate stack traces from within their own tools and applications. The code examples are not only useful to illustrate how the stack works but they can save real time and debugging effort when included as part of an application’s debugging facilities.
Chapter 6 takes an in-depth and detailed look at debugging applications with the GNU Debugger (GDB) and includes an overview of the Data Display Debugger (DDD) graphical user interface. Linux has an advantage over most other operating systems in that it includes a feature rich debugger, GDB, for free. Debuggers can be used to debug many types of problems, and given that GDB is free, it is well worth the effort to understand the basic as well as the more advanced features. This chapter covers hard-to-find details about debugging C++ applications, threaded applications, as well as numerous best practices. Have you ever spawned an xterm to attach to a process with GDB? This chapter will show you how—and why!
Chapter 7 provides a detailed overview of system crashes and hangs. With proprietary operating systems (OSs), a system crash or hang almost certainly requires you to call the OS vendor for help. However with Linux, the end user can debug a kernel problem on his or her own or at least identify key information to search for known problems. If you do need to get an expert involved, knowing what to collect will help you to get the right data quickly for a fast diagnosis. This chapter describes everything from how to attach a serial console to how to find the line of code for a kernel trap (an “oops”). For example, the chapter provides step-by-step details for how to manually add a trap in the kernel and then debug it to find the resulting line of code.
Chapter 8 covers more details about debugging the kernel or debugging with the kernel debugger, kdb. The chapter covers how to configure and enable kdb on your system as well as some practical commands that most Linux users can use without being a kernel expert. For example, this chapter shows you how to find out what a process is doing from within the kernel, which can be particularly useful if the process is hung and not killable.
for how to override functions using LD_PRELOAD and how to use the global offset table and the GDB debugger to intercept functions manually and redirect them to debug versions.
Appendix A is a toolbox that outlines the most useful tools, facilities, and files on Linux. For each tool, there is a description of when it is useful and where to get the latest copy.
Appendix B includes a production-ready data collection script that is especially useful for mission-critical systems or those who remotely support customers on Linux. The data collection script alone can save many hours or even days for debugging a remote problem.
Note: The source code used in this book can be found at http:// www.phptr.com/title/013147751X.
Note: A code continuation character, ➥, appears at the beginning of code lines that have wrapped down from the line above it.
Lastly, as we wrote this book it became clear to us that we were covering the right information. Reviewers often commented about how they were able to use the information immediately to solve real problems, not the problems that may come in the future or may have happened in the past, but real problems that people were actually struggling with when they reviewed the chapters. We also found ourselves referring to the content of the book to help solve problems as they came up. We hope you find it as useful as it has been to those who have read it thus far.
W
HOI
S THISB
OOKF
OR?
This book has useful information for any Linux user but is certainly geared more toward the Linux professional. This includes Linux power users, Linux administrators, developers who write software for Linux, and support staff who support products on Linux.
Readers who casually use Linux at home will benefit also, as long as they either have a basic understanding of Linux or are at least willing to learn more about it—the latter being most important.
This book will help such experts to quickly adapt their existing skill set and apply it effectively on Linux.
This power-packed book contains real industry experience on many topics and very hard-to-find information. Without a doubt, it is a must have for any developer, tester, support analyst, or anyone who uses Linux.
A
CKNOWLEDGMENTSAnyone who has written a book will agree that it takes an enormous amount of effort. Yes, there is a lot of work for the authors, but without the many key people behind the scenes, writing a book would be nearly impossible. We would like to thank all of the people who reviewed, supported, contributed, or otherwise made this book possible.
First, we would like to thank the reviewers for their time, patience, and valuable feedback. Besides the typos, grammatical errors, and technical omissions, in many cases the reviewers allowed us to see other vantage points, which in turn helped to make the content more well-rounded and complete. In particular, we would like to thank Richard Moore, for reviewing the technical content of many chapters; Robert Haskins, for being so thorough with his reviews and comments; Mel Gorman, for his valuable feedback on the ELF (Executable and Linking Format) chapter; Scott Dier, for his many valuable comments; Jan Kritter, for reviewing pretty much the entire book; and Joyce Coleman, Ananth Narayan, Pascale Stephenson, Ben Elliston, Hien Nguyen, Jim Keniston, as well as the IBM Linux Technology Center, for their valuable feedback. We would also like to thank the excellent engineers from SUSE for helping to answer many deep technical questions, especially Andi Kleen, Frank Balzer, and Michael Matz.
We would especially like to thank our wives and families for the support, encouragement, and giving us the time to work on this project. Without their support, this book would have never gotten past the casual conversation we had about possibly writing one many months ago. We truly appreciate the sacrifices that they have made to allow us to finish this book.
Last of all, we would like to thank the Open Source Community as a whole. The open source movement is a truly remarkable phenomenon that has and will continue to raise the bar for computing at home or for commercial environments. Our thanks to the Open Source Community is not specifically for this book but rather for their tireless dedication and technical prowess that make Linux and all open source products a reality. It is our hope that the content in this book will encourage others to adopt, use or support open source products and of course Linux. Every little bit helps.
O
THERThe history and evolution of the Linux operating system is fascinating and certainly still being written with new twists popping up all the time. Linux itself comprises only the kernel of the whole operating system. Granted, this is the single most important part, but everything else surrounding the Linux kernel is made up mostly of GNU free software. There are two major things that GNU software and the Linux kernel have in common. The first is that the source code for both is freely accessible. The second is that they have been developed and continue to be developed by many thousands of volunteers throughout the world, all connecting and sharing ideas and work through the Internet. Many refer to this collaboration of people and resources as the Open Source Community.
The Open Source Community is much like a distributed development team with skills and experience spanning many different areas of computer science. The source code that is written by the Open Source Community is available for anyone and everyone to see. Not only can this make problem determination easier, having such a large and diverse group of people looking at the code can reduce the number of defects and improve the security of the source code. Open source software is open to innovations as much as criticism, both helping to improve the quality and functionality of the software.
1
Best Practices and Initial
Investigation
1.1 I
NTRODUCTIONYour boss is screaming, your customers are screaming, you’re screaming … Whatever the situation, there is a problem, and you need to solve it. Remember those old classic MUD games? For those who don’t, a Multi-User Dungeon or MUD was the earliest incarnation of the online video game. Users played the game through a completely non-graphical text interface that described the surroundings and options available to the player and then prompted the user with what to do next.
You are alone in a dark cubicle. To the North is your boss’s office, to the West is your Team Lead’s cubicle, to the East is a window opening out to a five-floor drop, and to the South is a kitchenette containing a freshly brewed pot of coffee. You stare at your computer screen in bewilderment as the phone rings for the fifth time in as many minutes indicating that your users are unable to connect to their server.
Command>
What will you do? Will you run toward the East and dive through the open window? Will you go grab a hot cup of coffee to ensure you stay alert for the long night ahead? A common thing to do in these MUD games was to
examine your surroundings further, usually done by the look command.
Command> look
Your cubicle is a mess of papers and old coffee cups. The message waiting light on your phone is burnt out from flashing for so many months. Your email inbox is overflowing with unanswered emails. On top of the mess is the brand new book you ordered entitled “Self-Service Linux.” You need a shower.
Command> read book “Self-Service Linux”
You still need a shower.
This tongue-in-cheek MUD analogy aside, what can this book really do for you? This book includes chapters that are loaded with useful information to help you diagnose problems quickly and effectively. This first chapter covers best practices for problem determination and points to the more in-depth information found in the chapters throughout this book. The first step is to ensure that your Linux system(s) are configured for effective problem determination.
1.2 G
ETTINGY
OURS
YSTEM(
S) R
EADY FORE
FFECTIVEP
ROBLEMD
ETERMINATIONThe Linux problem determination tools and facilities are free, which begs the question: Why not install them? Without these tools, a simple problem can turn into a long and painful ordeal that can affect a business and/or your personal time. Before reading through the rest of the book, take some time to make sure the following tools are installed on your system(s). These tools are just waiting to make your life easier and/or your business more productive:
☞
strace: The strace tool traces the system calls, special functions that interact with the operating system. You can use this for many types of problems, especially those that relate to the operating system.☞
ltrace: The ltrace tool traces the functions that a process calls. This is similar to strace, but the called functions provide more detail.☞
lsof: The lsof tool lists all of the open files on the operating system (OS). When a file is open, the OS returns a numeric file descriptor to the process to use. This tool lists all of the open files on the OS with their respective process IDs and file descriptors.☞
top: This tool lists the “top” processes that are running on the system. By default it sorts by the amount of current CPU being consumed by a process.☞
traceroute/tcptraceroute: These tools can be used to trace a network route (or at least one direction of it).☞
hexdump or equivalent: This is simply a tool that can display the raw contents of a file.☞
tcpdump and/or ethereal: Used for network problems, these tools can display the packets of network traffic.☞
GDB: This is a powerful debugger that can be used to investigate some of the more difficult problems.☞
readelf: This tool can read and display information about various sections of an Executable and Linking Format (ELF) file.These tools (and many more) are listed in Appendix A, “The Toolbox,” along with information on where to find these tools. The rest of this book assumes that your systems have these basic Linux problem determination tools installed. These tools and facilities are free, and they won’t do much good sitting quietly on an installation CD (or on the Internet somewhere). In fact, this book will self-destruct in five minutes if these tools are not installed.
Now of course, just because you have a tool in your toolbox, it doesn’t mean you know how to use it in a particular situation. Imagine a toolbox with lots of very high quality tools sitting on your desk. Suddenly your boss walks into your office and asks you to fix a car engine or TV. You know you have the tools. You might even know what the tools are used for (that is, a wrench is used for loosening and tightening bolts), but could you fix that car engine? A toolbox is not a substitute for a good understanding of how and when to use the tools. Understanding how and when to use these tools is the main focus of this book.
1.3 T
HEF
OURP
HASES OFI
NVESTIGATIONGood investigation practices should balance the need to solve problems quickly, the need to build your skills, and the effective use of subject matter experts. The need to solve a problem quickly is obvious, but building your skills is important as well.
your quest to find information about red oak. You’re going to learn more about hardwood, probably the various types, relative hardness, and what each is used for. You might even get curious and spend time reading up on the other types of hardwood. This peripheral information can be very helpful in the future, especially if you often work with hardwood.
The next time you need information about hardwood, you go to the library again. You can ask the mysterious and knowledgeable person for the answer or spend some time and dig through books on your own. After a few trips to the library doing the investigation on your own, you will have learned a lot about hardwood and might not need to visit the library any more to get the answers you need. You’ve become an expert in hardwood. Of course, you’ll use your new knowledge and power for something nobler than creating difficult decisions for those walking into a library.
Likewise, every time you encounter a problem, you have a choice to make. You can immediately try to find the answer by searching the Internet or by asking an expert, or you can investigate the problem on your own. If you investigate a problem on your own, you will increase your skills from the experience regardless of whether you successfully solve the problem.
Of course, you need to make sure the skills that you would learn by finding the answer on your own will help you again in the future. For example, a physician may have little use for vast knowledge of hardwood ... although she or he may still find it interesting. For a physician that has one question about hardwood every 10 years, it may be better to just ask the expert or look for a shortcut to get the information she or he needs.
The first section of this chapter will outline a useful balance that will solve problems quickly and in many cases even faster than getting a subject matter expert involved (from here on referred to as an expert). How is this possible? Well, getting an expert usually takes time. Most experts are busy with numerous other projects and are rarely available on a minute’s notice. So why turn to them at the first sign of trouble? Not only can you investigate and resolve some problems faster on your own, you can become one of the experts of tomorrow.
There are four phases of problem investigation that, when combined, will both build your skills and solve problems quickly and effectively.
1. Initial investigation using your own skills.
2. Search for answers using the Internet or other resource. 3. Begin deeper investigation.
4. Ask a subject matter expert for help.
takes too long (that is, the problem is urgent and you need an immediate solution), move on to the next phase, which is searching for the answer using the Internet. If that doesn’t reveal a solution to the problem, don’t get an expert involved just yet. The third phase is to dive in deeper on your own. It will help to build some deep skill, and your homework will also be appreciated by an expert should you need to get one involved. Lastly, when the need arises, engage an expert to help solve the problem.
The urgency of a problem should help to guide how quickly you go through the phases. For example, if you’re supporting the New York Stock Exchange and you are trying to solve a problem that would bring it back online during the peak hours of trading, you wouldn’t spend 20 minutes surfing the Internet looking for answers. You would get an expert involved immediately.
The type of problem that occurred should also help guide how quickly you go through the phases. If you are a casual at-home Linux user, you might not benefit from a deep understanding of how Linux device drivers work, and it might not make sense to try and investigate such a complex problem on your own. It makes more sense to build deeper skills in a problem area when the type of problem aligns with your job responsibilities or personal interests.
1.3.1 Phase #1: Initial Investigation Using Your Own Skills
Basic information you should always make note of when you encounter a problem is:
☞
The exact time the problem occurred☞
Dynamic operating system information (information that can changefrequently over time)
The exact time is also important because it may be the only correlation between the problem and the system conditions at the time when the problem occurred. For example, an application often crashes or produces an error message when it is affected by low virtual memory. The symptom of an application crashing or producing an error message can seem, at first, to be completely unrelated to the current system conditions.
The dynamic OS information includes anything that can change over time without human intervention. This includes the amount of free memory, the amount of free disk space, the CPU workload, and so on. This information is important enough that you may even want to collect it any time a serious problem occurs. For example, if you don’t collect the amount of free virtual memory when a problem occurs, you might never get another chance. A few minutes or hours later, the system resources might go back to normal, eliminating any evidence that the system was ever low on memory. In fact, this is so important that distributions such as SUSE LINUX Enterprise Server continuously run sar (a tool that displays dynamic OS information) to monitor the system resources. Sar is a special tool that can collect, report, or save information about the system activity.
The dynamic OS information is also a good place to start investigating many types of problems, which are frequently caused by a lack of resources or changes to the operating system. As part of this initial investigation, you should also make a note of the following:
☞
What you were doing when the problem occurred. Were you installing software? Were you trying to start a Web server?☞
A problem description. This should include a description of what happened and a description of what was supposed to happen. In other words, how do you know there was a problem?☞
Anything that may have triggered the problem. This will be pretty problem-specific, but it’s worthwhile to think about it when the problem is still fresh in your mind.If the problem isn’t too serious, then just make a mental note of this information and continue the investigation. If the problem is very serious (has a major impact to a business), write this stuff down or put it into an investigation log (an investigation log is covered in detail later in this chapter).
If you can reproduce the problem at will, strace and ltrace may be good tools to start with. The strace and ltrace utilities can trace an application from
the command line, or they can trace a running process. The strace command
traces all of the system calls (special functions that interact with the operating
system), and ltrace traces functions that a program called. The strace tool is
probably the most useful problem investigation tool on Linux and is covered in more detail in Chapter 2, “strace and System Call Tracing Explained.”
Every now and then you’ll run into a problem that occurs once every few weeks or months. These problems usually occur on busy, complex systems, and even though they are rare, they can still have a major impact to a business and your personal time. If the problem is serious and cannot be reproduced, be sure to capture as much information as possible given that it might be your only chance. Also if the problem can’t be reproduced, you should start writing things down because you might need to refer to the information weeks or months into the future. For these types of problems, it may be worthwhile to collect a lot of information about the OS (including the software versions that are installed on it) considering that the problem could be related to something else that may change over weeks or months of time. Problems that take weeks or months to resolve can span several major changes or upgrades to the system, making it important to keep track of the original conditions under which the problem occurred.
Collecting the right OS information can involve running many OS commands, too many for someone to run when the need arises. For your convenience, this book comes with a data collection script that can gather an enormous amount of information about the operating system in a very short period of time. It will save you from having to remember each command and from having to type each command in to collect the right information.
The data collection script is particularly useful in two situations. The first situation is that you are investigating a problem on a remote customer system that you can’t log in to. The second situation is a serious problem on a local system that is critical to resolve. In both cases, the script is useful because it will usually gather all the OS information you need to investigate the problem with a single run.
The script is easy to modify, meaning that you can add commands to collect information about specific products (including yours if you have any) or applications that may be important. For a business, this script can improve the efficiency of your support organization and increase the level of customer satisfaction with your support.
Readers that are only using Linux at home may still find the script useful if they ever need to ask for help from a Linux expert. However, the script is certainly aimed more at the business Linux user. For this reason, there is more information on the data collection script in Appendix B, “Data Collection Script” (for the readers who support or use Linux in a business setting).
Do not underestimate the importance of doing an initial investigation on your own, even if the information you need to solve the problem is on the Internet. You will learn more investigating a problem on your own, and that earned knowledge and experience will be helpful for solving problems again in the future. That said, make sure the information you learn is in an area that you will find useful again. For example, improving your skills with strace is a very worthwhile exercise, but learning about a rare problem in a device driver is probably not worth it for the average Linux user. An initial investigation will also help you to better understand the problem, which can be helpful when trying to find the right information on the Internet. Of course, if the problem is urgent, use the appropriate resources to find the right solution as soon as possible.
1.3.1.1 Did Anything Change Recently? Everything is working as
expected and then suddenly, a problem occurs. The first question that people usually ask is “Did anything change recently?” The fact of the matter is that something either changed or something triggered the problem. If something changed and you can figure out what it was, you might have solved the problem and avoided a lengthy investigation.
In general, it is very important to keep changes to a production environment to a minimum. When changes are necessary, be sure to notify the system users of any changes in advance so that any resulting impact will be easier for them to diagnose. Likewise, if you are a user of a system, look to your system administrator to give you a heads up when changes are made to the system. Here are some examples of changes that can cause problems:
☞
A recent upgrade or change in the kernel version and/or system libraries☞
Changes to kernel parameters or tunable values can cause changes to behavior of the operating system, which can in turn cause problems for software that runs on the system.☞
Hardware changes. Disks can fail causing a major outage or possibly just aslowdown in the case of a RAID. If more memory is added to the system and applications start to fail, it could be the result of bad memory. For example, gcc is one of the tools that tend to crash with bad memory.
☞
Changes in workload (that is, more users suddenly going to a particularWeb site) may push the system close to the limit of its resources. Increases in workload can consume the last bit of memory, causing problems for any software that could be running on the system.
One of the best ways to detect changes to the system is to periodically run a script or tool that collects important information about the system and the software that runs on it. When a difficult problem occurs, you might want to start with a quick comparison of the changes that were recently made on the system — if nothing else, to rule them out as candidates to investigate further. Using information about changes to the system requires a bit of work up front. If you don’t save historical information about the operating environment, you won’t be able to compare it to the current information when something goes wrong. There are some useful tools such as tripwire that can help to keep a history of good, known configuration states.
Another best practice is to track any changes to configuration files in a revision control system such as CVS. This will ensure that you can “go back” to a stable point in the system’s past. For example, if the system were running smoothly three weeks ago but is unstable now, it might make sense to go back to the configuration three weeks prior to see if the problems are due to any configuration changes.
1.3.2 Phase #2: Searching the Internet Effectively
There are three good reasons to move to this phase of investigation. The first is that your boss and/or customer needs immediate resolution of a problem. The second reason is that your patience has run out, and the problem is going in a direction that will take a long time to investigate. The third is that the type of problem is such that investigating it on your own is not going to build useful skills for the future.
the identical problem already solved. Most problems can be solved by searching the Internet using an engine such as Google, by reading frequently asked question (FAQ) documents, HOW-TO documents, mailing-list archives, USENET archives, or other forums.
1.3.2.1 Google When searching, pick out unique keywords that describe the problem you’re seeing. Your keywords should contain the application name or “kernel” + unique keywords from actual output + function name where problem occurs (if known). For example, keywords consisting of “kernel Oops sock_poll” will yield many results in Google.
There is so much information about Linux on the Internet that search engine giant Google has created a special search specifically for Linux. This is a great starting place to search for the information you want
-http://www.google.com/linux.
There are also some types of problems that can affect a Linux user but are not specific to Linux. In this case, it might be better to search using the main Google page instead. For example, FreeBSD shares many of the same design issues and makes use of GNU software as well, so there are times when documentation specific to FreeBSD will help with a Linux related problem.
1.3.2.2 USENET USENET is comprised of thousands of newsgroups or discussion groups on just about every imaginable topic. USENET has been around since the beginning of the Internet and is one of the original services that molded the Internet into what it is today. There are many ways of reading USENET newsgroups. One of them is by connecting a software program called a news reader to a USENET news server. More recently, Google provided Google Groups for users who prefer to use a Web browser. Google Groups is a searchable archive of most USENET newsgroups dating back to their infancies. The search
page is found at http://groups.google.com or off of the main page for Google.
Google Groups can also be used to post a question to USENET, as can most news readers.
1.3.2.3 Linux Web Resources There are several Web sites that store searchable Linux documentation. One of the more popular and comprehensive
documentation sites is The Linux Documentation Project: http://tldp.org.
The Linux Documentation Project is run by a group of volunteers who provide many valuable types of information about Linux including FAQs and HOW-TO guides.
There are also many excellent articles on a wide range of topics available on other Web sites as well. Two of the more popular sites for articles are:
☞
Linux Weekly News – http://lwn.netThe first of these sites has useful Linux articles that can help you get a better understanding of the Linux environment and operating system. The second Web site is for learning more about the Linux kernel, not necessarily for fixing problems.
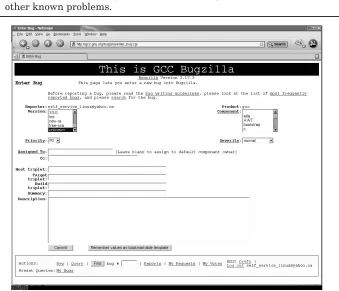
1.3.2.4 Bugzilla Databases Inspired and created by the Mozilla project, Bugzilla databases have become the most widely used bug tracking database systems for all kinds of GNU software projects such as the GNU Compiler Collection (GCC). Bugzilla is also used by some distribution companies to track bugs in the various releases of their GNU/Linux products.
Most Bugzilla databases are publicly available and can, at a minimum, be searched through an extensive Web-based query interface. For example,
GCC’s Bugzilla can be found at http://gcc.gnu.org/bugzilla, and a search can
be performed without even creating an account. This can be useful if you think you’ve encountered a real software bug and want to search to see if anyone else has found and reported the problem. If a match is found to your query, you can examine and even track all the progress made on the bug.
If you’re sure you’ve encountered a real software bug, and searching does not indicate that it is a known issue, do not hesitate to open a new bug report in the proper Bugzilla database. Open source software is community-based, and reporting bugs is a large part of what makes the open source movement work. Refer to investigation Phase 4 for more information on opening a bug reports.
1.3.2.5 Mailing Lists Mailing lists are related closely to USENET newsgroups and in some cases are used to provide a more user friendly front-end to the lesser known and less understood USENET interfaces. The advantage of mailing lists is that interested parties explicitly subscribe to specific lists. When a posting is made to a mailing list, everyone subscribed to that list will receive an email. There are usually settings available to the subscriber to minimize the impact on their inboxes such as getting a daily or weekly digest of mailing list posts.
The most popular Linux related mailing list is the Linux Kernel Mailing List (lkml). This is where most of the Linux pioneers and gurus such as Linux Torvalds, Alan Cox, and Andrew Morton “hang out.” A quick Google search will tell you how you can subscribe to this list, but that would probably be a bad idea due to the high amount of traffic. To avoid the need to subscribe and deal with the high traffic, there are many Web sites that provide fancy interfaces
and searchable archives of the lkml. The main one is http://lkml.org.
There are also sites that provide summaries of discussions going on in
the lkml. A popular one is at Linux Weekly News (lwn.net) at http://lwn.net/
As with USENET, you are free to post questions or messages to mailing lists, though some require you to become a subscriber first.
1.3.3 Phase #3: Begin Deeper Investigation (Good Problem Investigation Practices)
If you get to this phase, you’ve exhausted your attempt to find the information using the Internet. With any luck you’ve picked up some good pointers from the Internet that will help you get a jump start on a more thorough investigation.
Because this is turning out to be a difficult problem, it is worth noting that difficult problems need to be treated in a special way. They can take days, weeks, or even months to resolve and tend to require much data and effort. Collecting and tracking certain information now may seem unimportant, but three weeks from now you may look back in despair wishing you had. You might get so deep into the investigation that you forget how you got there. Also if you need to transfer the problem to another person (be it a subject matter expert or a peer), they will need to know what you’ve done and where you left off.
It usually takes many years to become an expert at diagnosing complex problems. That expertise includes technical skills as well as best practices. The technical skills are what take a long time to learn and require experience and a lot of knowledge. The best practices, however, can be learned in just a few minutes. Here are six best practices that will help when diagnosing complex problems:
1. Collect relevant information when the problem occurs.
2. Keep a log of what you’ve done and what you think the problem might be.
3. Be detailed and avoid qualitative information. 4. Challenge assumptions until they are proven. 5. Narrow the scope of the problem.
6. Work to prove or disprove theories about the problem.
1.3.3.1 Best Practices for Complex Investigations
1.3.3.1.1 Collect the Relevant Information When the Problem Occurs Earlier in this chapter we discussed how changes can cause certain types of problems. We also discussed how changes can remove evidence for why a problem occurred in the first place (for example, changes to the amount of free memory can hide the fact that it was once low). In the former situation, it is important to collect information because it can be compared to information that was collected at a previous time to see if any changes caused the problem. In the latter situation, it is important to collect information before the changes on the system wipe out any important evidence. The longer it takes to resolve a problem, the better the chance that something important will change during the investigation. In either situation, data collection is very important for complex problems.
Even reproducible problems can be affected by a changing system. A problem that occurs one day can stop occurring the next day because of an unknown change to the system. If you’re lucky, the problem will never occur again, but that’s not always the case.
Consider a problem that occurred many years ago where application trap occurred in one xterm (a type of terminal window) window but not in another. Both xterm windows were on the same system and were identical in every way (well, so it seemed at first) but still the problem occurred only in one. Even the list of environment variables was the same except for the expected differences such as PWD (present working directory). After logging out and back in, the problem could not be reproduced. A few days later the problem came back again, only in one xterm. After a very complex investigation, it turned out that an environment variable PWD was the difference that caused the problem to occur. This isn’t as simple as it sounds. The contents of the PWD environment variable was not the cause of the problem, although the difference in size of PWD variables between the two xterms forced the stack (a special memory segment) to slightly move up or down in the address space. Sure enough, changing PWD to another value made the problem disappear or recur depending on the length. This small difference caused the different behavior for the application in the two xterms. In one xterm, a memory corruption in the application landed without issue on an inert part of the stack, causing no side-effect. In the other xterm, the memory corruption landed on a pointer on the stack (the long description of the problem is beyond the scope of this chapter). The pointer was dereferenced by the application, and the trap occurred. This is a very rare problem but is a good example of how small and seemingly unrelated changes or differences can affect a problem.
For quick reference, here is the list:
☞
The exact time the problem occurred☞
Dynamic operating system information☞
What you were doing when the problem occurred☞
A problem description☞
Anything that may have triggered the problem☞
Any evidence that may be relevantThe more serious and complex the problem is, the more you’ll want to start writing things down. With a complex problem, other people may need to get involved, and the investigation may get complex enough that you’ll start to forget some of the information and theories you’re using. The data collector included with this book can make your life easier whenever you need to collect information about the OS.
1.3.3.1.2 Use an Investigation Log Even if you only ever have one
complex, critical problem to work on at a time, it is still important to keep track of what you’ve done. This doesn’t mean well written, grammatically correct explanations of everything you’ve done, but it does mean enough detail to be useful to you at a later date. Assuming that you’re like most people, you won’t have the luxury of working on a single problem at a time, which makes this even more important. When you’re investigating 10 problems at once, it sometimes gets difficult to keep track of what has been done for each of them. You also stand a good chance of hitting a similar problem again in the future and may want to use some of the information from the first investigation.
Further, if you ever need to get someone else involved in the investigation, an investigation log can prevent a great deal of unnecessary work. You don’t want others unknowingly spending precious time re-doing your hard earned steps and finding the same results. An investigation log can also point others to what you have done so that they can make sure your conclusions are correct up to a certain point in the investigation.
The following example shows a very structured and well laid out investigation log. With some experience, you’ll find the format that works best for you. As you read through it, it should be obvious how useful an investigation log is. If you had to take over this problem investigation right now, it should be clear what has been done and where the investigator left off.
Time of occurrence: Sun Sep 5 21:23:58 EDT 2004
Problem description: Product Y failed to start when run from a cron job.
Symptom:
ProdY: Could not create communication semaphore: 1176688244 (EEXIST)
What might have caused the problem: The error message seems to indicate that the semaphore already existed and could not be recreated.
Theory #1: Product Y may have crashed abruptly, leaving one or more IPC
resources. On restart, the product may have tried to recreate a semaphore that it already created from a previous run.
Needed to prove/disprove:
☞ The ownership of the semaphore resource at the time of the error is the same as the user that ran product Y.
☞ That there was a previous crash for product Y that would have left the IPC resources allocated.
Proof: Unfortunately, there was no information collected at the time of the error, so we will never truly know the owner of the semaphore at the time of the error. There is no sign of a trap, and product Y always leaves a debug file when it traps. This is an unlikely theory that is good given we don’t have the information required to make progress on it.
Theory #2: Product X may have been running at the time, and there may
have been an IPC (Inter Process Communication) key collision with product Y.
Needed to prove/disprove:
☞ Check whether product X and product Y can use the same IPC key.
☞ Confirm that both product X and product Y were actually running at the time.
Proof: Started product X and then tried to start product Y. Ran “strace” on product X and got the following semget:
Ran “strace” on product Y and got the following semget:
ion 730% strace -o productY.strace prodY ion 731% egrep “sem|shm” productY.strace
semget(1176688244, 1, IPC_CREAT|IPC_EXCL|0x1f7|0666) = EEXIST
The IPC keys are identical, and product Y tries to create the semaphore but fails. The error message from product Y is identical to the original error message in the problem description here.
Notes: productX.strace and productY.strace are under the data directory.
Assumption: I still don’t know whether product X was running at the time when product Y failed to start, but given these results, it is very likely. IPC collisions are rare, and we know that product X and product Y cannot run at the same time the way they are currently configured.
Note: A semaphore is a special type of inter-process communication mechanism that provides a synchronization mechanism between processes (and/or threads). The type of semaphore used here requires a unique “key” so that multiple processes can use the same semaphore. A semaphore can exist without any processes using it, and some applications expect and rely on creating a semaphore before they can run properly. The semget() in the strace that follows is a system call (a special type of
OS function) that, as the name suggests, gets a semaphore.
Notice how detailed the proofs are. Even the commands used to capture the original strace output are included to eliminate any human error. When entering a proof, be sure to ask yourself, “Would someone else need any more proof than this?” This level of detail is often required for complex problems so that others will see the proof and agree with it.
The amount of detail in your investigation log should depend on how critical the problem is and how close you are to solving it. If you’re completely lost on a very critical problem, you should include more detail than if you are almost done with the investigation. The high level of detail is very useful for complex problems given that every piece of data could be invaluable later on in the investigation.
If you don’t have a good problem tracking system, here is a possible directory structure that can help keep things organized:
The problem identifier is for tracking purposes. Use whatever is appropriate for you (even if it is 1, 2, 3, 4, and so on). The inv.txt is the investigation log, containing the various theories and proofs. The data directory is for any data files that have been collected. Having one data directory helps keep things organized and it also makes it easy to refer to data files from your investigation log. The src directory is for any source code or scripts that you write to help investigate the problem.
The problem directory is what you would show someone when referring to the problem you are investigating. The investigation log would contain the flow of the investigation with the detailed proofs and should be enough to get someone up to speed quickly.
You may also want to save the problem directory for the future or better yet, put the investigation directories somewhere where others can search through them as well. After all, you worked hard for the information in your investigation log; don’t be too quick to delete it. You never know when you’ll hit a similar (or the same) problem again. The investigation log can also be used to help educate more junior people about investigation techniques.
1.3.3.1.3 Be Detailed (Avoid Qualitative Information) Be very detailed in your investigation log or any time when discussing the problem. If you prove a theory using an error record from an error log file, include the error record and the name of the error log file as proof in the investigation log. Avoid qualitative proofs such as, “Found an error log that showed that the suspect product was running at the time.” If you transfer a problem to another person, that person will want to see the actual error record to ensure that your assumption was correct. Also if the problem lasts long enough, you may actually start to second-guess yourself as well (which is actually a good thing) and may appreciate that quantitative proof (a proof with real data to back it up).
Another example of a qualitative proof is a relative term or description. Descriptions like “the file was very large” and “the CPU workload was high” will mean different things to different people. You need to include details for
how large the file was (using the output of the ls command if possible) and
how high the CPU workload was (using uptime or top). This will remove any
uncertainty that others (or you) have about your theories and proofs for the investigation.
error log file or the output from an actual command might be all the evidence you need to agree with a statement. Or you might find that the statement is based on an incorrect assumption.
1.3.3.1.4 Challenge Assumptions There is nothing like spending a week
diagnosing a problem based on an assumption that was incorrect. Consider an example where a problem has been identified and a fix has been provided ... yet the problem happens again. There are two main possibilities here. The first is that the fix didn’t address the problem. The second is that the fix is good, but you didn’t actually get it onto the system (for the statistically inclined reader: yes there is a chance that the fix is bad and it didn’t get on the system, but the chances are very slim). For critical problems, people have a tendency to jump to conclusions out of desperation to solve a problem quickly. If the group you’re working with starts complaining about the bad fix, you should encourage them to challenge both possibilities. Challenge the assumption that the fix actually got onto the system. (Was it even built into the executable or library that was supposed to contain the fix?)
1.3.3.1.5 Narrow Down the Scope of the Problem Solution (that is, a complete IT solution) -level problem determination is difficult enough, but to make matters worse, each application or product in a solution usually requires a different set of skills and knowledge. Even following the trail of evidence can require deep skills for each application, which might mean getting a few experts involved. This is why it is so important to try and narrow down the scope of the problem for a solution level problem as quickly as possible.
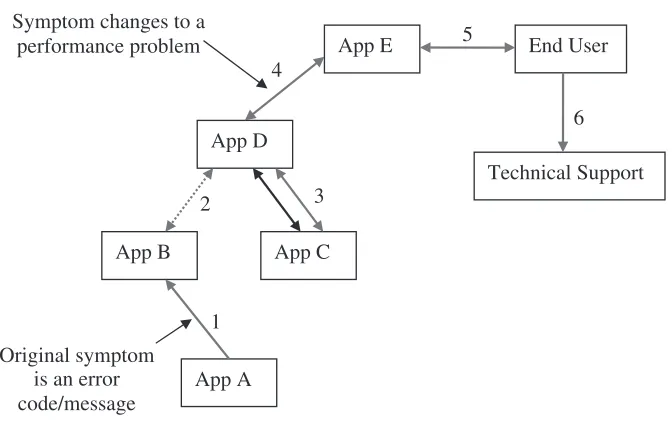
Today’s complex heterogeneous solutions can make simple problems very difficult to diagnose. Computer systems and the software that runs on them are integrated through networks and other mechanism(s) to work together to provide a solution. A simple problem, even one that has a clear error message, can become difficult given that the effect of the problem can ripple throughout a solution, causing seemingly unrelated symptoms. Consider the example in Figure 1.1.
Fig. 1.1Ripple effect of an error in a solution.
If this seems overly complex, it is actually an oversimplification of real IT solutions where hundreds or even thousands of systems can be connected together. The challenge for the investigator is to follow the trail of evidence back to the original error.
It is particularly important to challenge assumptions when working on a solution-level problem. You need to find out whether each symptom is related to a local system or whether the symptom is related to a change or error condition in another part of a solution.
Lastly, everyone working on an IT solution should be aware of the basic architecture of the solution. This will help the team narrow the scope of any problems that occur. Knowing the basic architecture will help people to theorize where a problem may be coming from and eventually identify the source.
1.3.3.2 Create a Reproducible Test Case Assuming you know how the
problem occurs (note that the word here is how, not why), it will help others if you can create a test case and/or environment that can reproduce the problem at will. A test case is a term used to refer to a tool or a small set of commands that, when run, can cause a problem to occur.
A successful test case can greatly reduce the time to resolution for a problem. If you’re investigating a problem on your own, you can run and rerun the test case to cause the problem to occur many times in a row, learning from the symptoms and using different investigation techniques to better understand the problem.
If you need to ask an expert for help, you will also get much more help if you include a reproducible test case. In many cases, an expert will know how to investigate a problem but not how to reproduce it. Having a reproducible test case is especially important if you are asking a stranger for help over the Internet. In this case, the person helping you will probably be doing so on his or her own time and will be more willing to help out if you make it as easy as you can.
1.3.3.3 Work to Prove and/or Disprove Theories This is part of any
good problem investigation. The investigator will do his best to think of possible avenues of investigation and to prove or disprove them. The real art here is to identify theories that are easy to prove or disprove or that will dramatically narrow the scope of a problem.
Even nonsolution level problems (such as an application that fails when run from the command line) can be easier to diagnose if they are narrowed in scope with the right theory. Consider an application that is failing to start with an obscure error message. One theory could be that the application is unable to allocate memory. This theory is much smaller in scope and easier to investigate because it does not require intimate knowledge about the application. Because the theory is not application-specific, there are more people who understand how to investigate it. If you need to get an expert involved, you only need someone who understands how to investigate whether an application is unable to allocate memory. That expert may know nothing about the application itself (and might not need to).
1.3.3.4 The Source Code If you are familiar with reading C source code,