RESEARCH NOTE
Objectively-measured physical activity
patterns and longitudinal weight category
status in a rural setting
Ian Cook
*Abstract
Objectives: To investigate the relationship between longitudinal weight-change and objectively-measured physi-cal activity (PA) in a rural African setting in 143 adults (≥ 30 years), using data from two cross-sectional surveys, separated by approximately 10 years. Participants were categorised into three weight-change groups (Weight-loss: ≥ 25 kg m−2
→ < 25 kg m−2; Weight-gain: < 25 kg m−2
→≥ 25 kg m−2; Weight-stability: remained < 25 kg m−2
or ≥ 25 kg m−2). Daily ambulation and activity energy expenditure (AEE), measured in the 2005–2007 health survey,
was examined across the change groups. Using the daily AEE data, the proportion of those in the weight-change groups, meeting or not meeting two PA guidelines (150- and 420 min week−1), was examined.
Results: Weight-change was found in 18.2% of the sample. There was no significant overall body mass change (+ 1.2 kg, p = 0.1616). However, there was significant change in body mass in the weight-gain (+ 15.2 kg) and weight-loss (− 10.8 kg) groups (p ≤ 0.0011). Nearly 90% of those who gained weight met the 150 min week−1 guideline. A
significantly greater proportion of the weight-stable group (< 25 kg m−2) met the 420 min week−1 guideline (p < 0.05).
Ambulatory level was high irrespective of weight group, although the weight-stable group (< 25 kg m−2) approached
15,000 steps day−1. There was an inconsistent and weak association between PA and weight-change in this group. Keywords: Body composition, Anthropometry accelerometer, Movement monitor, Measurement
© The Author(s) 2019. This article is distributed under the terms of the Creative Commons Attribution 4.0 International License (http://creativecommons.org/licenses/by/4.0/), which permits unrestricted use, distribution, and reproduction in any medium, provided you give appropriate credit to the original author(s) and the source, provide a link to the Creative Commons license, and indicate if changes were made. The Creative Commons Public Domain Dedication waiver (http://creativecommons.org/ publicdomain/zero/1.0/) applies to the data made available in this article, unless otherwise stated.
Introduction
The inclusion of objective measures of physical activity (PA) in population surveillance and longitudinal stud-ies, is now a ubiquitous feature of Physical Activity Epi-demiology literature, particularly from industrialized settings [1, 2]. Within the South African setting, particu-larly rural settings, longitudinal studies which include PA measures are relatively recent developments, and have generally addressed body composition and metabolic variables [3–9]. Not surprisingly, there is a paucity of longitudinal analyses, especially in rural African settings, which have used objective measures of PA [9]. Interest-ingly, the causal role of PA in weight-change has been
challenged, suggesting the importance of other environ-mental factors [9, 10]. Indeed, sugar-sweetened beverage intake, but not PA, is significantly related to weight gain in low-income, urban and rural South African settings [8]. Similarly, body mass index is associated with socio-economic status, but not PA, in a rural African sample [11], and a recent longitudinal analysis found significant direct effects of socio-economic status on weight-change [3]. Moreover, longitudinal analyses suggest that meeting public health PA guidelines [12] does not translate into an improved weight status [4, 13]. Therefore, the objec-tive of this study was to relate an objecobjec-tive measure of PA to longitudinal weight-change and stability collected in a rural African setting during two cross-sectional sur-veys, separated by approximately 10 years [14, 15]. More specifically, the analysis probes whether those partici-pants meeting public health PA guidelines are more likely
Open Access
*Correspondence: [email protected]
to present with an attenuation of weight gain through weight loss or stability.
Main text Methods
All adults who had sex, age and body mass index (BMI) data across two surveys conducted in the Dikgale Health and Demographic Surveillance System site (DHDSS) [16] in 1997 [14] and 2005–2007 [15], were included in the analysis (male: n = 15; female: n = 128, ≥ 30 years in 1997). Only the 2005–2007 survey included an objective measure of PA. The methodology behind these cross-sectional survey data is described in detail elsewhere [14, 15].
Using body mass (kg) and stature (m), BMI (kg m−2) was calculated and classified; under-weight
(UW, < 18.5 kg m−2), normal weight (NW, 18.5–
24.9 kg m−2), over-weight (OW, 25–29.9 kg m−2), obese
(OB, 30–34.9 kg m−2) and severely obese (≥ 35 kg m−2)
[17]. In addition, three weight-change categories were constructed based on BMI changes over the approxi-mately 10-year period (1997 to 2005–2007); weight-loss, -gain or -stability. Due to sample size constraints, BMI change categories were grouped. UW (N = 8) did not differ significantly from NW (N = 37) for age or average steps day−1 (p > 0.9) and were collapsed into one group.
The weight-change categories were defined as follows:
• Weight-loss: OW/OB → UW/NW (≥ 25 kg m−2→
< 25 kg m−2).
• Weight-gain: UW/NW → OW/OB (< 25 kg m−2→
≥ 25 kg m−2).
• Weight stability: UW/NW → UW/NW (< 25 kg m−2)
and OW/OB → OW/OB (≥ 25 kg m−2).
With regard to the 2005–2007 survey data, 7-day accel-erometry-based pedometry data were collected using electronic pedometers (NL-2000, New Lifestyles Inc., Kansas City, MO, USA) [15]. Step-based PA public health indices were defined as: sedentary: < 5000 steps day−1,
low-somewhat active: 5000–9999 steps day−1, active:
10,000–12,499 steps day−1, very active: ≥ 12,500
steps day−1 [18]. A pedometry-based approach was
used to estimate the degree to which participants met energy expenditure-based PA public health guidelines [19]. Using daily (kcal kg−1 day−1) and total weekly
AEE (kcal kg−1 week−1) the following categories were
determined:
• ≥ 7.5 kcal kg−1 week−1, ≥ 1.5 kcal kg−1 day−1
for ≥ 5 days week−1.
• ≥ 21 kcal kg−1 week−1, ≥ 3 kcal kg−1 day−1 for
7 days week−1.
For the purposes of this analysis a 150- and 420 min week−1 standard were used, which equates
to ≥ 7.5 kcal kg−1 week−1 and ≥ 21 kcal kg−1 week−1,
respectively [12, 20].
Descriptive statistics comprised means (one standard deviation) and proportions.
Relationships between categorical variables and differ-ences across multiple group proportions were examined through Fisher’s exact test and z tests with correction for multiple comparisons (Bonferroni).
For continuous data, independent and one sample t
tests examined differences between the sexes and com-bined data, respectively. One-way Analysis of Variance examined differences across weight-change categories, with post hoc multiple comparison analyses (Sidak’s t
test) assessing group differences.
To examine average daily step totals across weight-change categories, a Univariate General Linear Model was constructed, adjusting for 2005–2007 survey age. Post hoc multiple comparison analyses (Sidak’s t test) assessed group differences.
Two linear regression models were examined for BMI delta (BMI 2005–2007 survey minus BMI 1997 sur-vey, kg m−2)—Model 1: age, sex and average daily steps;
Model 2: age, sex and average daily AEE. Age and PA var-iables were obtained from the 2005–2007 survey.
Data were analysed using appropriate statistical soft-ware (IBM SPSS Statistics: Release 25 IBM Corporation, Armonk NY, 2017 and GraphPad Prism: version 8.12, GraphPad Software, La Jolla CA, 2019). Significance for all inferential statistics was set at p < 0.05.
Results
There were significant sex-differences in BMI (p ≤ 0.0014), but not age (p ≥ 0.0783) for both sur-veys (Table 1). Proportionally, significantly fewer females were classified as UW/NW (2005–2007 survey,
respectively (significant difference between groups and change between survey periods, p ≤ 0.0011). There was no significant difference in body mass change between the weight-stable groups or for the change between survey periods (UW/NW: − 0.8 kg, OW/OB: + 1.3 kg, p ≥ 0.2320). The overall mean body mass change
between the two survey periods was not significant (+ 1.2 kg, p = 0.1616).
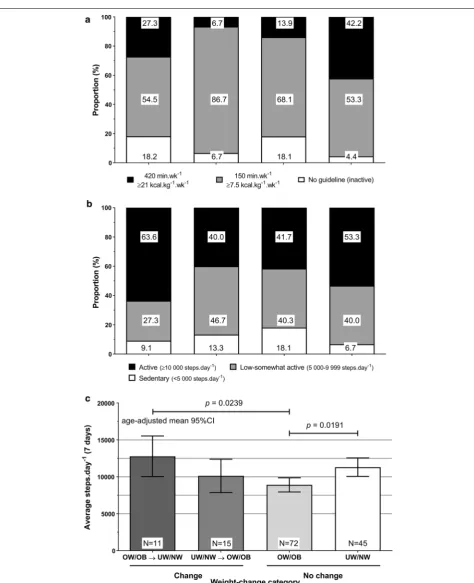
Compared to other weight-change groups, sig-nificantly more weight-stable UW/NW achieved the 420 min week−1 guideline (p < 0.05, Fig. 1a), despite
the mean age of 65.2 years. There was no significant
Table 1 Descriptive statistics of male and female participants over two survey periods
Raw values reported as %(n) except amean(sd); †significant difference: male vs. female p < 0.05; ‡continuous variables: independent t test; categorical variables: Fisher’s
exact test; UW/NW: (< 25 kg m−2), OW/OB: (≥ 25 kg m−2)
BMI body mass index
Male (n = 15) Female (n = 128) All (n = 143) p-value‡
Age (years)a
1997 survey 57.1 (16.4) 50.6 (13.0) 51.3 (13.5) 0.0783
2005–2007 survey 65.9 (16.4) 59.5 (13.1) 60.2 (13.6) 0.0828
Age distribution (2005–2007 survey) (years)
35–44 20.0 (3) 14.8 (19) 15.4 (22) 0.0319
45–54 6.7 (1) 24.2 (31) 22.4 (32)
55–64 6.7 (1) 28.1 (36) 25.9 (37)
65+ 66.7 (10) 32.8 (42)† 36.4 (52)
Body mass change (kg)a + 0.9 (4.1) + 1.2 (10.3) + 1.2 (9.9) 0.9013
BMI (kg m−2)a
1997 survey 23.7 (4.1) 28.1 (6.3)† 27.6 (6.3) 0.0014
2005–2007 survey 23.5 (4.2) 28.3 (6.5)† 27.8 (6.5) 0.0006
BMI distribution 1997 survey
Normal/underweight (< 25 kg m−2) 60.0 (9) 39.8 (51) 42.0 (60) 0.1723
Overweight (25–29.9 kg m−2) 33.3 (5) 25.0 (32) 25.9 (37)
Obese (30–34.9 kg m−2) 6.7 (1) 19.5 (25) 18.2 (26)
Severe obesity (≥ 35 kg m−2) 0.0 (0) 15.6 (20) 14.0 (20)
2005–2007 survey
Normal/underweight (< 25 kg m−2) 66.7 (10) 35.9 (46)† 39.2 (56) 0.0686
Overweight (25–29.9 kg m−2) 26.7 (4) 25.8 (33) 25.9 (37)
Obese (30–34.9 kg m−2) 6.7 (1) 21.1 (27) 19.6 (28)
Severe obesity (≥ 35 kg m−2) 0.0 (0) 17.2 (22) 15.4 (22)
BMI change distribution (1997 to 2005–2007 survey)
OW/OB → UW/NW 6.7 (1) 7.8 (10) 7.7 (11) 0.0764
UW/NW → OW/OB 0.0 (0) 11.7 (15) 10.5 (15)
OW/OB no change 33.3 (5) 52.3 (67) 50.3 (72)
UW/NW no change 60.0 (9) 28.1 (36)† 31.5 (45)
Ambulation (2005–2007 survey)a
Average steps per day 10,753 (5411) 10,013 (4343) 10,091 (4451) 0.5442 Step distribution (2005–2007 survey)
Sedentary (< 5000 steps day−1) 13.3 (2) 13.3 (17) 13.3 (19) 0.6272
Low-somewhat active (5000–9999 steps day−1) 26.7 (4) 41.5 (53) 39.9 (57)
Active (10,000–12,499 steps day−1) 20.0 (3) 18.8 (24) 18.9 (27)
Highly active (≥ 12,500 steps day−1) 40.0 (6) 26.6 (34) 28.0 (40)
Meeting physical activity guidelines (2005–2007 survey)
No guidelines 6.7 (1) 13.3 (17) 12.6 (18) 0.6041
150 min week−1 60.0 (9) 64.8 (83) 64.3 (92)
[image:3.595.60.536.102.596.2]association between weight-change category and step-based PA guidelines (p = 0.5466, Fig. 1b). The weight-stable UW/NW group were significantly older than the weight-stable OW/OB group (65.2 years vs. 58.3 years, respectively, p = 0.0413). Hence, ambulation levels across weight-change category were adjusted for age (Fig. 1c). Weight loss (OW/OB → UW/NW) was associated with significantly higher ambulation level than remaining OW/OB (p = 0.0239), approaching levels of up to 15,000 steps day−1 (Fig. 1c). There was no significant
differ-ence between the change categories (OW/OB → UW/ NW: 12,776 steps day−1; UW/NW → OW/OB: 10,130
steps day−1). Daily average ambulation was significantly
higher in weight-stable UW/NW group compared to the weight-stable OW/OB group (11,307 steps day−1 vs 8912
steps day−1, respectively, p = 0.0191) (Fig. 1c).
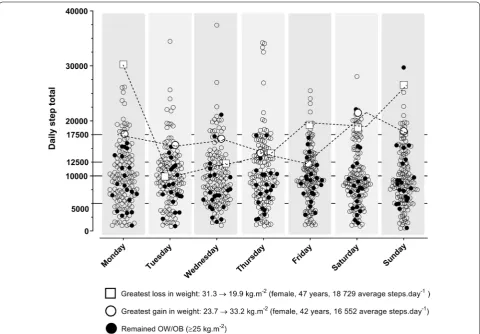
There was substantial individual variation in daily ambulation levels with values ranging from < 5000 steps day−1 to over 20,000 steps day−1 (Fig. 2). In
con-trast, there was surprising homogeneity in daily ambu-lation levels across two levels of extreme weight gain
and weight loss; both these cases averaged above 15,000 steps day−1. Of note the high ambulation levels achieved
in those who remained OW/OB, with one female achiev-ing 29,697 steps day−1 (age = 47.6 years; 2005–2007
sur-vey BMI = 36.3 kg m−2) (Fig. 2).
Neither linear regression models for predicting BMI change were significant (Model 1: R2= 0.0299, p = 0.2368;
Model 2: R2= 0.0526, p = 0.0568). For Model 1, none
of the predictors were significant (p > 0.06). Only aver-age daily AEE was significant in Model 2 (β coeffi-cient =− 0.3600, p = 0.0253).
Discussion
This analysis is novel in that, as far as the author is aware, this is the first longitudinal analysis of weight-change in association with an objective measure of PA, from a rural South African setting.
The main finding of this analysis was that there was no consistent, significant pattern of high sedentary and physical inactivity prevalence in those who remained overweight-obese or moved from underweight-normal
[image:5.595.58.539.364.698.2]weight to obese, and high PA levels in those who remained normal weight or lost weight. In fact, irrespec-tive of the weight-change status, ambulatory PA was high. However, there was a tendency for the weight loss group (OW/OB → UW/NW) and the UW/NW weight-stable group to accrue higher average daily ambulation within the 420 min week−1 and ≥ 10,000 steps day−1 PA
guidelines, with a low proportion in the 150 min week−1
guideline. The low sample size might have obscured more definitive and significant patterns. Moreover, although significantly more females were included in the analysis compared with those not included (p ≤ 0.0006), the mean age, BMI, education status and ambulation were not sig-nificantly different (p ≥ 0.1179) in those who were used for analysis compared to those not, providing some miti-gating evidence for the low sample size and convenience sampling.
Interestingly, very similar proportions of those not meeting any energy expenditure-based PA guide-lines were seen between quite disparate groups (OW/ OB → UW/NW and remained OW/OB: ≈ 18%; UW/ NW → OW/OB and remained UW/NW: ≈ 5%). Moreo-ver, more than 80% of any weight-change group adhered to a PA guideline, whether energy expenditure-based or step-based. Previous cross-sectional analyses of the 2005–2007 survey data, have shown that irrespective of increased BMI levels, the ambulation levels and the prevalence of meeting PA guidelines are high [15, 19, 21]. Adult DHDSS residents are active because of daily subsistence and active travel demands, rarely because of sport and recreation, especially amongst females [15, 19].
Meeting PA guidelines, especially 150 min week−1
(5 days week−1, moderate-to-vigorous intensity), was not
associated with weight loss or being weight-stable. Nearly 90% of those who gained weight met the 150 min week−1
guideline. These findings are in agreement with Dickie et al. [4] who found that in a group of 57 urban African women, body mass increased over a period of 5.5 years, whether classified as physically active (150 min week−1)
or physically inactive using a self-report measure. The overall body mass increase was + 7.3 kg [4], which is sixfold higher than the 10 year body mass change in the current rural African sample. However, those meeting PA guidelines were metabolically healthier than those classi-fied as physically inactive [4].
Similarly, in a prospective cohort study (mean follow-up 13.1 years), Lee et al. [13] showed that weight gain was the same in those meeting or not meeting PA guide-lines (150 min week−1). The overall mean weight gain was
2.6 kg, which is more than two-fold compared to the cur-rent sample. Weight stability was evident only in women attaining 420 min week−1 of moderate-to-vigorous PA
[13]. In the current analysis, only the weight-stable UW/
NW group showed a significantly greater prevalence of meeting 420 min week−1 PA guidelines (p < 0.05). The PA
guideline of 420 min week−1 [20] addresses issues around
weight loss and prevention of weight gain after weight loss [22], unlike the PA guideline of 150 min week−1 [12]
which addresses risk reduction for mortality and morbid-ity, and metabolic health [4, 5, 23].
In contrast, an increase in BMI over a 10 year period in 430 urban African women, was significantly, inversely (p = 0.02) related to vigorous PA (assessed using a self-report measure). The overall increase in body mass was 5.17 kg [6]. In a more recent analysis, this group has shown the relationship between moderate-to-vigorous PA (150 min week−1) and changes in BMI to be part of
a complex interaction, with significant direct and indi-rect effects via socio-economic status. Change in moder-ate-to-vigorous PA was directly and inversely related to socio-economic status [3].
The generally high levels of PA coupled with high lev-els of obesity highlighted in the current analysis, are in agreement with the assertion that higher levels of PA do not necessarily attenuate weight gain [9]. In a 2-year prospective cohort (1943 adults of African origin), which included 8-day accelerometry, neither meeting PA guide-lines (150 min week−1) nor sedentary time were
associ-ated with weight gain, suggesting the likelihood that nutritional factors might be of greater importance [9, 10].
In conclusion, this report presents longitudinal weight-change data, incorporating an objective measure of PA, from a rural African setting, which suggests that meeting public health PA guidelines is not tightly associated with weight-change or stability.
Limitations
Due to the small sample size and cross-sectional, conven-ience sampling in this study, the results cannot be read-ily generalized to the rural populations from whence the participants were recruited, nor can causality be shown.
Abbreviations
AEE: activity energy expenditure; BMI: body mass index; DHDSS: Dikgale Health and Demographic Surveillance System Site; NW: normal weight; OB: obese; OW: over-weight; PA: physical activity; UW: under-weight.
Acknowledgements
The author would like to thank Professor Marianne Alberts for access to the 1997 survey data, and the communities, participants and field workers of the Dikgale Demographic and Health Surveillance System Site.
Authors’ contributions
Funding
The Research Development and Administration Division of the University of Limpopo (Turfloop Campus), The Norwegian Universities Committee for Development Research and Education, and the Thuthuka and Institutional Research Development Programmes of the National Research Foundation of South Africa supported the initial studies on which this manuscript is based [14, 15]. The funding agencies did not contribute to the design of the study, data collection, analysis and interpretation of data, or in the writing the manuscript.
Availability of data and materials
The data analysed during the current study are not publicly available due to the original consent and ethics approval not containing approval from the participants for data sharing. Reasonable requests would be considered in consultation with the University of Limpopo Ethics Committee and the vari-ous community leaders.
Ethics approval and consent to participate
Ethics approval for the initial data collection [14, 15] was obtained from the then University of the North [14] and the current University of Limpopo [15] Research Ethics Committees (SREC 2006/459). The participants recruited into the original studies were informed about the study objectives, expected out-comes, benefits and the risks associated with it. Written informed consent was obtained from the participants prior to interviews and measurements.
Consent for publication
Not applicable.
Competing interests
The author declares no competing interests.
Received: 30 July 2019 Accepted: 18 September 2019
References
1. Dishman RK, Heath GW, I-Min L. Physical activity epidemiology. 2nd ed. Champaign: Human Kinetics; 2013.
2. Shephard RJ, Tudor-Locke C. The objective monitoring of physical activity: contributions of accelerometry to epidemiology, exercise science and rehabilitation. Switzerland: Springer International Publishing; 2016. 3. Gradidge PJL, Norris SA, Munthali R, Crowther NJ. Influence of
socioeco-nomic status on changes in body size and physical activity in ageing black South African women. Eur Rev Aging Phys Act. 2018;15:6. 4. Dickie K, Micklesfield LK, Chantler S, Lambert EV, Goedecke JH. Meeting
physical activity guidelines is associated with reduced risk for cardiovas-cular disease in black South African women; a 5.5-year follow-up study. BMC Public Health. 2014;14:498.
5. Lear SA, Hu W, Rangarajan S, Gasevic D, Leong D, Iqbal R, et al. The effect of physical activity on mortality and cardiovascular disease in 130,000 people from 17 high-income, middle-income, and low-income countries: the PURE study. Lancet. 2017;390:2643–54.
6. Gradidge PJL, Norris SA, Micklesfield LK, Crowther NJ. The role of lifestyle and psycho-social factors in predicting changes in body composition in black South African women. PLoS ONE. 2015;10:e0132914.
7. Malambo P, Kengne AP, Lambert EV, De Villiers A, Puoane T. Prevalence and socio-demographic correlates of physical activity levels among
South African adults in Cape Town and Mount Frere communities in 2008–2009. Arch Public Health. 2016;74:54.
8. Okop KJ, Lambert EV, Alaba O, Levitt NS, Luke A, Dugas L, et al. Sugar-sweetened beverage intake and relative weight gain among South African adults living in resource-poor communities: longitudinal data from the STOP-SA study. Int J Obes. 2019;43:603–14.
9. Dugas LR, Kliethermes S, Plange-Rhule J, Tong L, Bovet P, Forrester TE, et al. Accelerometer-measured physical activity is not associated with 2-year weight change in African-origin adults from five diverse popula-tions. PeerJ. 2017;5:e2902.
10. Luke A, Cooper RS. Physical activity does not influence obesity risk: time to clarify the public health message. Int J Epidemiol. 2014;42:1831–6. 11. Mashinya F, Alberts M, Cook I, Ntuli S. Determinants of body mass index
by gender in the Dikgale Health and Demographic Surveillance System site, South Africa. Glob Health Action. 2018;11:1537613.
12. U.S. Department of Health and Human Services. Physical activity guide-lines for Americans. 2nd ed. Washington, DC: U.S. Department of Health and Human Services; 2018.
13. Lee IM, Djousse L, Sesso HD, Wang L, Buring JE. Physical activity and weight gain prevention. JAMA. 2010;303:1173–9.
14. Alberts M, Urdal P, Steyn K, Stensvold I, Tverdal A, Nel JH, et al. Prevalence of cardiovascular diseases and associated risk factors in a rural black population of South Africa. Eur J Cardiovasc Prev Rehabil. 2005;12:347–54. 15. Cook I, Alberts M, Brits JS, Choma S, Mkhonto SS. Descriptive
epidemiol-ogy of ambulatory activity in rural, black South Africans. Med Sci Sports Exerc. 2010;42:1261–8.
16. Alberts M, Dikotope SA, Choma SR, Masemola ML, Modjadji SE, Mashinya F, et al. Health & Demographic Surveillance System Profile: the Dikgale Health and Demographic Surveillance System. Int J Epidemiol. 2015;44:1565–71.
17. National Institutes of Health. Clinical guidelines on the identification, evaluation, and treatment of overweight and obesity in adults-the evidence report. Obes Res. 1998;6:51S–209S.
18. Tudor-Locke C, Craig C, Brown WJ, Clemes SA, De Cocker K, Giles-Corti B, et al. How many steps/day are enough? For adults. Int J Behav Nutr Phys Act. 2011;8:79.
19. Cook I, Alberts M, Lambert E. Compliance with physical activity guide-lines in rural, black South Africans in the Limpopo Province: an energy expenditure approach. Br J Sports Med. 2011;45:619–25.
20. Institute of Medicine. Dietary reference intake for energy, carbohydrate, fiber, fat, fatty acids, cholesterol, protein and amino acids. Food and Nutri-tion Board. Washington, DC: NaNutri-tional Academy Press; 2002.
21. Cook I. Do low levels of physical activity in female adolescents cause overweight and obesity? Objectively measured physical activity levels of periurban and rural adolescents. S Afr Med J. 2015;105:659–63. 22. Brooks GA, Butte NF, Rand WM, Flatt JP, Caballero B. Chronicle of the
Institute of Medicine physical activity recommendation: how a physical activity recommendation came to be among dietary recommendations. Am J Clin Nutr. 2004;79:921S–930.
23. Schoenborn CA, Stommel M. Adherence to the 2008 adult physical activ-ity guidelines and mortalactiv-ity risk. Am J Prev Med. 2011;40:514–21.
Publisher’s Note