Original Research Article
Distribution of different cerebral lesions showing restriction on
diffusion weighted imaging cases
Shailesh Kumar Singh
1, Kusum Lata
2*, Neera Kohli
3INTRODUCTION
Diffusion imaging makes use of the variability of “Brownian motion of water molecules in brain tissue. Brownian motion refers to the random movement of molecules. Water molecules are in constant motion, and the rate of movement or diffusion depends on the kinetic energy of the molecules and is temperature dependent. In biological tissues, diffusion is not truly random because
tissue has structure. Cell membranes, vascular structures, and axon cylinders, for example, limit or restrict the amount of diffusion. Also, chemical interactions of water and macromolecules affect diffusion properties. Therefore, in the brain, water diffusion is referred to as “apparent diffusion.”1 Diffusion weighted imaging has
now become a routine technique in the magnetic resonance protocols for the evaluation of stroke patients. In 1986, the intravoxel incoherent motion and diffusion
ABSTRACT
Background: Diffusion Weighted Images (DWI) is conventionally used to identify acute ischemic lesions. It has now become a routine technique in the magnetic resonance protocols for the evaluation of stroke patients. The objective of the present study was to find the distribution of different cerebral lesions showing restriction on DWI and influence of ADC on them.
Methods: This was single blinded prospective study. Evaluating the magnetic resonance imaging was blinded for the clinical data of the patient. This study was done at M.R.I. unit of Department of Radio Diagnosis, C.S.M. Medical University, Lucknow, during a period of one year from August 2008 to July 2009.Total 93 subjects with restricted diffusion with age range of (6 to 95 years) were found. Data were analyzed using statistical software package, STATA 9.2 and the difference was considered to be significant if ‘p’ value was found to be <0.05.
Results: Ninety-three cases of diffusion restriction were seen of which 55 of infarcts (37 male and 18 female) with age range of 6 to 95 years. 10 cystic lesions which were showing restriction on DWI with low ADC value were found. Total 12 cases of encephalitis were found showing restriction on DWI. Most of the cases of encephalitis were found to have ADC value between 400 to 800 x 10-6 mm2/s that 75% of total encephalitis cases. Fluid-attenuated inversion
recovery was superior to T2 sequencing in showing cortical lesions.
Conclusions: MRI with DWI and ADC values are helpful in the earlier diagnosis of the encephalitis, infarcts and helpful in better differentiation of infarcts, abscesses and encephalitis in comparison to MRI without DWI and ADC value.
Keywords: Abscess, Diffusion weighted images, Infarct, Magnetic resonance imaging
1Department of Radiodiagnosis, 2Department of Obstetrics and Gynaecology, Integral Institute of Medical Sciences
and Research, Lucknow, Utter Pradesh, India
3Department of Radiodiagnosis, KGMU, Lucknow, Utter Pradesh, India
Received: 04 February 2019
Accepted: 11 February 2019
*Correspondence:
Dr. Kusum Lata,
E-mail: [email protected]
Copyright: © the author(s), publisher and licensee Medip Academy. This is an open-access article distributed under the terms of the Creative Commons Attribution Non-Commercial License, which permits unrestricted non-commercial use, distribution, and reproduction in any medium, provided the original work is properly cited.
Imaging was introduced by Le Bihan.2,3 The usual pattern
of magnetic resonance appearances corresponding to the different stages of intracerebral hemorrhage is well known. The generalized model for the appearance of ICH on MR images attributes the various signal intensity patterns of evolving ICH to the oxygenation state of hemoglobin and the integrity of the red blood cells.4,5
Despite the frequent use of conventional MR imaging to evaluate the appearance and underlying biophysical basis of evolving ICH over the past few years, diffusion-weighted MR imaging has only recently been recognized as a valuable investigative resource.6-11 DWI is a
relatively new technique which, by using additional strong diffusion-sensitizing gradients, is extremely sensitive to changes in the microscopic motion of water protons. It has proved valuable in the study of the natural history of ischemic stroke and is now a promising technique for the early detection of cerebral infarction in routine clinical practice.12-15
The aim of this study is to find the distribution of different cerebral lesions showing restriction on DWI and influence of ADC on them.
METHODS
This was single blinded prospective study. Radiologist evaluating the Magnetic resonance imaging was blinded for the clinical data of the patient. This study was done at M.R.I. unit of Department of Radio diagnosis, C.S.M. Medical University, Lucknow during a period of one year from August 2008 to July 2009.The study comprised of subjects which were showing intra-cerebral lesions with restriction on DWI in MRI study. Total 93 subjects with restricted diffusion with age range of (6 to 95 years) were found.
Inclusion criteria
All patients referred to Department of Radio Diagnosis for MRI Brain showing restriction on DWI.
Exclusion criteria
• Uncooperative patients.
• Patients with claustrophobia.
• Patients with pacemaker / cochlear implants in situ.
Diffusion weighted magnetic resonance imaging
Conventional T2 Weighted MRI was performed on Signa Excite 1.5 T Gemsow (GE) MR Scanner installed in the
department of Radiodiagnosis, C.S.M. Medical
University, and Lucknow. A standard head coil with standard restraints was used to fix the subject's head. In addition to axial DW images, conventional fluid-attenuated inversion recovery (FLAIR) T1-, T2-, and proton density-weighted images were obtained. All imaging studies were completed without any adverse effect or complication. DWI was performed with a
spin-echo spin-echo-planar imaging sequence having a repetition time of 4000ms, an echo time of 103ms, and a gradient strength of 25mT/m covering 19 slices 5mm thick (interslice gap 1.5 mm, field of view 230x230 mm2, and
matrix size 96x128 interpolated to 256x256). Diffusion was measured in 3 orthogonal directions (x, y, and z) with 2 b values. (degree of diffusion weighting expressed by the b value). The total acquisition time of the DW images was 20 seconds. ADC map were obtained by spin echo T2 Echo Planar Imaging sequences made sensitized to random diffusion of water molecules using “pulsed magnetic gradient”.
Data analysis
DW images were transferred to a separate workstation for data analysis. First, the images in the 3 orthogonal directions were co registered. The natural logarithms of the images were averaged to form a rotationally invariant resultant image. With a linear least-squares regression on a pixel- by-pixel basis, the resultant image and the natural logarithm of the reference T2-weighted image (b=0) were fitted to the b values, where the slope of the fitted line was ADCav. The calculations were performed with a commercially available software program (Functool). Range of ADC values in different brain lesions shall be measured and its Distribution in different cerebral lesions shall be determined. ADC values in normal appearing white matter on conventional MR1 were measured.
Region of interest analysis
While drawing the regions of interest (ROIs) on the trace images or on the ADCav maps, we simultaneously located the lesion on the conventional images to avoid mistakes. The ischemic stroke ROIs were drawn on the trace images, where the acute, 24-hour-old, and I-week-old lesions could easily be identified and were subsequently transferred to the equivalent ADCav maps. ROIs were drawn directly to the ADCav maps. The normal white matter ROls were the frontal and occipital white matter from both hemispheres. Contamination of the normal white matter ROls with the regions of leukoaraiosis was carefully avoided. In each KOI, the surface area was measured, and the mean, SD, and range of minimum and maximum values have been noted.
Statistical analysis
RESULTS
Table 1 shows that out total 93 cases of diffusion restriction, 55 of infarcts with age range of 6 to 95 years. Most of the infarct cases were seen in more than 40 years of age (80%) 12 of encephalitis with age range of 3 to 55 years. Encephalitis cases were seen in young age group less than 30 year of age (93%). 10 of abscesses with age range of 12 to 52 years, 5 of bleed with age range of 26 to 75 years, 8 of GBM with age range of 32 to 56 years and 3 of ADEM with age range of 1.5 to 28 years. All the cases of ADEM were below 30 years of age. All the GBM cases were of age more than 30 year of age. 60%
cases of infarcts were seen in between 40 to 70 years of age. 58% cases of encephalitis were seen below 10 years of age. All the cases of GBM, ADEM were male. 80% cases of bleed were seen in male. Infarct was more common in male (Table 1).
In Table 2 illustrates that the gradual onset was seen in GBM and abscess approaching 100%. Acute onset was seen infarct and most of the cases of encephalitis. Headache was most common complain of the GBM and abscess and seen the 100% cases of abscess and 87% cases of glioblastoma.
Table 1: Age-sex distribution with MRI Diagnosis.
Variables Abscess ADEM Bleed Encephalitis GBM Infarct
No. % No. % No. % No. % No. % No. %
Age group
<10 0 0.00 1 33.33 0 0.00 7 58.33 0 0 2 3.64
11-20 4 40.00 1 33.33 0 0.00 1 8.33 0 0 0 0.00
21-30 3 30.00 1 33.33 1 20.00 3 25.00 0 0 4 7.27
31-40 0 0.00 0 0.00 1 20.00 0 0.00 3 37.5 6 10.91
41-50 1 10.00 0 0.00 0 0.00 0 0.00 2 25 10 18.18
51-60 2 20.00 0 0.00 1 20.00 1 8.33 3 37.5 12 21.82
61-70 0 0.00 0 0.00 0 0.00 0 0.00 0 0 12 21.82
71-80 0 0.00 0 0.00 2 40.00 0 0.00 0 0 7 12.73
>80 0 0.00 0 0.00 0 0.00 0 0.00 0 0 2 3.64
Gender
Female 4 40.0 0 0.0 1 20.0 5 41.67 0 0.0 18 32.73
Male 6 60.0 3 100.0 4 80.0 7 58.33 8 100.0 37 67.27
Total 10 3 5 12 8 55
Table 2:Distribution of associated variables with MRI diagnosis.
Variables Abscess ADEM Bleed Encephalitis GBM Infarct
No. % No. % No. % No. % No. % No. %
Onset
Acute 1 10.00 2 66.67 5 100.00 8 66.67 u 0 46 83.64
Gradual 9 90.00 1 33.33 0 0.00 4 33.33 8 100 9 16.36
Headache
Absent 0 0.00 2 66.67 2 40.00 7 58.33 1 12.5 50 90.91
Present 10 100.00 1 33.33 3 60.00 5 41.67 7 87.5 5 9.09
Vomiting
Absent 2 20.00 2 66 4 80.00 7 58.33 3 37.5 48 87.27
Present 8 80.00 1 33.33 1 20.00 5 41.67 5 62.5 7 12.73
Seizure
Absent 4 40.00 0 0.00 5 100.00 6 50.00 5 62.5 55 100.00
Present 6 60.00 3 100.00 0 0.00 6 50.00 3 37.5 0 0.00
Weakness
Absent 3 30.00 2 66.67 0 0.00 4 33.33 6 75.00 0 0.00
Present 7 70.00 1 33.33 5 100.00 8 66.67 2 25.00 55 100.00
Fever
Absent 1 10.00 0 0.00 5 100.00 1 8.33 8 100.00 55 100.00
Vomiting was seen in 80% of abscess and 62.55 of glioblastoma.50% of abscesses, 37.5% of GBM and 100% of ADEM cases had presented with seizure. Weakness was seen in 100% cases of infarcts, bleed and 70% cases of abscess. 100% of ADEM, 91.67% of encephalitis and 90 % of abscess cases had presented with fever in my study. None of the cases of infarct, GBM and bleed had fever (Table 2).
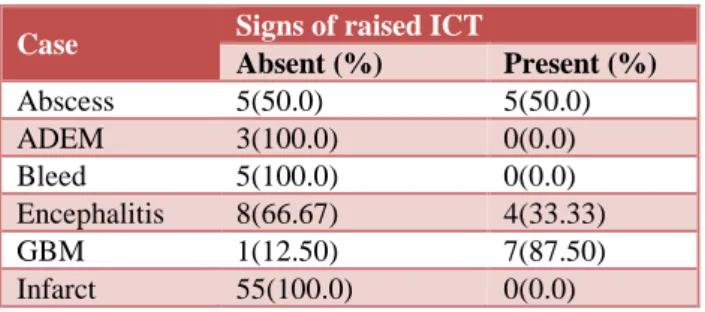
Table 3: Distribution of signs raised ICT with MR diagnosis.
Case Signs of raised ICT
Absent (%) Present (%)
Abscess 5(50.0) 5(50.0)
ADEM 3(100.0) 0(0.0)
Bleed 5(100.0) 0(0.0)
Encephalitis 8(66.67) 4(33.33)
GBM 1(12.50) 7(87.50)
Infarct 55(100.0) 0(0.0)
Table 3 depicts that the distribution of signs raised ICT with MR diagnosis. Total 16 cases out of total 93 diffusion restricting lesions presented with signs of raised intracranial tension of which 7 of GBM, 5 of abscess and 4 of encephalitis. Thus, majority of cases shows GBM i.e., 87.50% followed by 50% of abscess and 33.33% of encephalitis cases had presented with signs of intracranial tension in a study (Table 3).
Table 4: Distribution of ADC with MR diagnosis.
Case Range ofADC value × 10
-6 mm2/s
200-399 400-599 600-799 >800
Abscess 0(0.0) 3(30.0) 5(50.0) 2(20.0)
ADEM 0(0.0) 2(66.67) 0(0.0) 1(33.33)
Bleed 1(20) 2(40) 2(40) 0(0.0)
Encephalitis 0(0.0) 4(33.33) 5(41.67) 3(25.0)
GBM 0(0.0) 3(37.50) 4(50.0) 1(12.5)
Infarct 7(12.73) 37(67.27) 11(20.0) 0(0.0)
Table 4 shows that distribution of ADC with MR diagnosis. 50% cases of abscess have range 600-799, 30% cases of abscess have range 400-599, 20% cases of abscess have range of above 800. None of the abscess cases belongs to range of ADC value 200-399. Most of the Encephalitis cases in between 400 to 799. None of the cases of infarct and bleed in the range of above 800. Majority of infract cases were belongs to range 400-599, followed by range of ADC 600-799. None of the cases of encephalitis and GBM were in the range of 200-399 (Table 4).
DISCUSSION
In present study total 93 cases of diffusion restriction was seen of which 55 of infarcts (37 male and 18 female) with age range of 6 to 95 years. Total 62 cases of 93 diffusion
restricting lesions presented with acute onset of illness, 31 cases with headache, Total 27 cases presented with vomiting. 18, 78 and 23 cases endure seizure weakness and fever respectively. Ten cases of abscesses were found which were showing restriction on diffusion weighted imaging. In consistent result described by Snow JB et al, in his book DW. has been found to be very useful in the MR, diagnosis of other lesions besides brain ischemia like intracranial and extracranial abscesses.16
Additionally, Mishra et al, done his study concluded that demonstration of restricted diffusion on DWI with reduced ADC was highly suggestive of brain abscess; however, in the absence of restriction, MR spectroscopy was mandatory to distinguish brain abscesses from cystic tumors.17 Lesions appearing hyperintense on DWI with
the ADC values of lower than 0.9±0.13 x10mm/s (mean ±SD) were considered as brain abscess by Reddy et al, and also reported that diffusion-weighted imaging has high sensitivity and specificity for the differentiation of brain abscess from other non-abscess intracranial cystic lesions.18 Similar study was also performed by Guzman et
al, in a consecutive series of 16 patients harboring surgically verified purulent brain processes and determination of their study was that diffusion-weighted MR imaging can be used to identify infectious brain lesions and can help to differentiate between brain abscess and cystic brain tumor, thus making it a strong additional imaging modality in the early diagnosis of central nervous system purulent brain processes.19 In
present study the lesions not showing restriction on diffusion weighted imaging were not included however, 10 cystic lesions which were showing restriction on DWI with low ADC value were found. Thus, present study is showing agreement with above both studies. Total 12 cases of encephalitis were found showing restriction on DWI. Most of the cases of encephalitis were found to have ADC value between 400 to 800 x 10-6 mm2/s that
75% of total encephalitis cases. In addition, Hatipoglu et al, has done retrospective study and concluded that, there were no need for contrast media to be administered at any disease stage.20 Fluid-attenuated inversion recovery is
superior to T2 sequencing in showing cortical lesions at all disease stages. In present study Fluid-attenuated inversion recovery is superior to T2 sequencing in showing cortical lesions. Showing agreement with present study.
CONCLUSION
It concluded that fever and headache was found to be most common symptoms of the abscess. MRI with DWI and ADC values are helpful in the earlier diagnosis of the encephalitis, infarcts and helpful in better differentiation of infarcts, abscesses and encephalitis in comparison to MRI without DWI and ADC value.
Funding: No funding sources Conflict of interest: None declared
REFERENCES
1. Bykowski J, Shellinger PD, Warach S. Diffusion and perfusion MRI in Edelman, Hesselink, Zlatkin and crues eds .Clinical magnetic resonance imaging. Saunders; Elsevier, 3rd edition Philadelphia, 2006;(2):1538-70.
2. Le Bihan D, Breton E, Lallemand D, et al, MR
imaging of intravoxel incoherent motions:
application to diffusion and perfusion in neurologic disorders. Radiol. 1986;61(2):401-7.
3. Le Bihan D Intra-voxel incoherent motion imaging using steady state free precession. Magn Reson Med. 1988;7:497-505.
4. Gomori JM, Grossman RI, Goldberg HI,
Zimmerman RA, Bilaniuk LT. Intracranial
hematomas: imaging by high-field MR. Radiol. 1985;157:87-93.
5. Bradley WG. MR appearance of hemorrhage in the
brain. Radiol. 1993;189:15-26.
6. Ebisu T, Tanaka C, Umeda M, Kitamura M,
Fukunaga M, Aoki I, et al. Hemorrhagic and nonhemorrhagic stroke: diagnosis with
diffusion-weighted and T2-weighted echo-planar MR
imaging. Radiol. 1997 Jun;203(3):823-8.
7. Schellinger PD, Jansen O, Fiebach JB, Hacke W, Sartor K. A standardized MRI stroke protocol: comparison with CT in hyperacute intracerebral hemorrhage. Stroke. 1999;30:765-8.
8. Felber S, Auer A, Wolf C, Schocke M, Golaszewski S, Amort B. MRI characteristics of spontaneous intracerebral hemorrhage. Der Radiologe. 1999 Oct;39(10):838-46.
9. Atlas SW, DuBois P, Singer MB, Lu D. Diffusion
measurements in intracranial hematomas:
implications for MR imaging of acute stroke. Am J Neuroradiol. 2000;21:1190-4.
10. Carhuapoma JR, Wang PY, Beauchamp NJ, Keyl PM, Hanley DF, Barker PB. Diffusion weighted MRI and proton MR spectroscopic imaging in the
study of secondary neuronal injury after
intracerebral hemorrhage. Stroke. 2000;31(3):726-32.
11. Wiesmann M, Mayer TE, Yousry I, Hamann GF,
Bruckmann H. Detection of hyperacute
parenchymal hemorrhage of the brain using echo-planar T2* -weighted and diffusion-weighted MRI Eur Radiol. 2001;11:849-53.
12. Moseley ME, Cohen Y, Mintorovitch J, Chileuitt L, Shimizu H, Kucharczyk J, et al. Early detection of
regional cerebral ischemia in cats: comparison of diffusion‐and T2‐weighted MRI and spectroscopy. Magnetic Resonance Med. 1990 May;14(2):330-46. 13. Chien D, Kwong KK, Gress DR, Buonanno FS, Buxton RB, Rosen BR. MR diffusion imaging of cerebral infarction in humans. Am J Neuroradiol. 1992 Jul 1;13(4):1097-102.
14. Sorensen AG, Buonanno FS, Gonzalez RG,
Schwamm LH, Lev MH, Huang-Hellinger FR, et al. Hyperacute stroke: evaluation with combined
multisection diffusion-weighted and
hemodynamically weighted echo-planar MR
imaging. Radiol. 1996 May;199(2):391-401. 15. Marks MP, de Crespigny A, Lentz D, Enzmann DR,
Albers GW, Moseley ME. Acute and chronic stroke:
navigated spin-echo diffusion-weighted MR
imaging. Radiol. 1996 May;199(2):403-8.
16. James B. Snow and Ashley Wackym, Ballenger's Otorhinolaryngology: Head and Neck Surgery Otorhinolaryngology: Head and Neck Surgery. 17 edition. PMPH USA, Ltd; 2009;(1):536-90.
17. Mishra AM, Gupta RK, Jaggi RS, Reddy JS, Jha DK, Husain N, et al. Role of diffusion-weighted imaging and in vivo proton magnetic resonance spectroscopy in the differential diagnosis of ring-enhancing intracranial cystic mass lesions. J
Computer Assisted Tomography. 2004 Jul
1;28(4):540-7.
18. Reddy JS, Mishra AM, Behari S, Husain M, Gupta V, Rastogi M, et al. The role of diffusion-weighted imaging in the differential diagnosis of intracranial cystic mass lesions: a report of 147 lesions. Surg Neurol. 2006 Sep 1;66(3):246-50.
19. Guzman R, Barth A, Karl-Olof Lovblad, El-Koussy M, Weis J, Schroth G, Seiler J. Use of
diffusion-weighted magnetic resonance imaging in
differentiating purulent brain processes from cystic brain tumors. Neurosurg. 2002;97(5):110 -7. 20. Hatipoglu HG, Sakman B, Yuksel E, magnetic
resonance and diffusion weighted imaging findings of herpes simplex encephalitis. Neuroradiol. 2000;42:184-91.