4-1953
Radiations from selenium 75
Erling N. JensenIowa State College L. Jackson Laslett Iowa State College Don S. Martin Jr. Iowa State College Francis J. Hughes Iowa State College William W. Pratt Iowa State College
Follow this and additional works at:http://lib.dr.iastate.edu/ameslab_iscreports
Part of theAtomic, Molecular and Optical Physics Commons,Nuclear Commons,Quantum Physics Commons, and theRadiochemistry Commons
This Report is brought to you for free and open access by the Ames Laboratory at Iowa State University Digital Repository. It has been accepted for inclusion in Ames Laboratory ISC Technical Reports by an authorized administrator of Iowa State University Digital Repository. For more information, please [email protected].
Recommended Citation
Jensen, Erling N.; Laslett, L. Jackson; Martin, Don S. Jr.; Hughes, Francis J.; and Pratt, William W., "Radiations from selenium 75" (1953).Ames Laboratory ISC Technical Reports. 46.
Abstract
The radiations from 125 day Se-75 have been examined by means of a thin lens spectrometer and absorption-coincidence techniques. Se-75 was found to decay to As-75 by orbital electron capture. The energies of ten transitions (0.0666, 0.0766, 0.0983, 0.1241, 0.1384, 0.2032, 0.2688, 0.2814, 0.3078, and0.4050 Mev) were observed in the photoelectron and internal conversion spectra determined with the spectrometer. A decay scheme is proposed on the basis of the absorption-coincidence and spectrometer data. The multiple order of the 98.3 kev transition is discussed.
Keywords
Atomic Research, Physics, Chemistry, Brookhaven National Laboratory
Disciplines
Atomic, Molecular and Optical Physics | Chemistry | Nuclear | Physics | Quantum Physics | Radiochemistry
sc.
AL
rsc.-:J-.5
2.
r.:==
UNITED STATES ATOMIC ENERGY COMMISSIONISC-252
j
RADIATIONS FROM SELENIUM 75 By
Erling N. Jensen L. Jackson Laslett DonS. Martin, Jr. Francis J. Hughes William W. Pratt
April 1953
[TIS Issuance Date] Iowa State College
C CCC, 1- 2
Reports 0~ ·ce, ~IC
File
No.
/0-.L'f-f/0
In the interest of economy, this report has been reproduced direct from copy as submitted to the Technical Information Service. Since nontechnical and nonessential prefatory material
has been deleted, the first page of the report is page 5.
Work performed under Contract No. W-7405-eng-82.
ISC-252
RADIATIONS FROM SELENIUM 75
Erling N. Jensen, L. Jackson Laslett, DonS. Martin, Jr.,
*
Francis J. Hughes, and William W. Pratt
Institute for Atomic Research and Departments of
Ph~sics a~d Chemistry, Iowa State College, Ames, Iowa
Abstract
75
The radiations from 125 day Se haye been examined by means of
a
thin lens spectrometer a?d absorption-coincidence techniques.se7~ was found to deca~ ·to As 5 by orbital electron capture. ThA energies of ten transitions (0.0666, 0.0766, 0.0983 , 0.1241 , 0.138 4 0.2032 , 0.2688, 0.2814 , 0.3078, ana 0.4050 Mev) were observed in the pnotoelectron and internal conversion spectra determined with the spectrometer. A decay scheme is proposed on the basis of the absorption-coincidence and spectrometer data. The multiple order of the 98.3 kev transition is di~cussed.
I. INTRODUCTION
A number of investigators (1-8) have examined the radiations
from 125 day Se75. From lead absorption measurements Burgus et al.(2), report two gamma-rays having energies of 0.18 and 0.335 Mev; Fried-lander et al. (3), found a single gamma-ray having an energy of 0.4 Mev; Cowart et al. (5), report two gamma-rays with energies of 0.22 and 0.43 Mev; and Gest and Glendenin (6) found two gamma-rays .
having energies of 0.18 and 0.35 Mev. The three latter groups found X-rays corresponding to the K lines from arsenic, indicating that Se7~ decays to As75 by OPbi~al electron capture.
Ter-Pogossian et al. (7), examined the photoelectron spectra of se75, as obtained from lead and uranium radiators, in a 180° spectrometer. They report six, and possibly seven, gamma-rays with energies 0.076, 0.099
(?),
0.123, 0.137, 0.267, 0.283 and 0.405 Mev. They did not obtain an internal conversion spectrum. Cork et al. (8), have examined the internal conversion spectrum of se75 in spectro-meters using photographic detection techniques. They report elevengamma-rays with energies 0.0247, 0.0662,
0.0808, 0.0968,
0.1212,0.1362, 0.1988, 0.2652~ 0.28019 0.3050, and 0.4019 Mev. They did
not obtain a phot-oelectron spectrum. ·
DeBened~tti and McGowan (9) made a search for a metastable
state in As7~, by means of delayed coincidences, and obtained a
negative result in the range 10-o to lo-3 sec.
Reports (10) have been made at various times on the decay
and transit.ion ene~gies of se75, as determined with a thin lens
spectrometer. Nearly all of the transition energies so determined
have been communicated privately to other workers and have
sub-sequently b·e.en cited in several publications (7; il~·l2). It is
the purpose of this paper to present directly the evidenQe obtained
here ·for the transition energies and decay scheme of se7?.
The radioactive se75 used in this investigation was produced
by neutron bombardment of the metal in the Oak Ridge pile. The
radiations were examined with a thin lens spectrometer (13)
modi-fied to incorporate ring focusing (14). The spectrometer was
cali-brated by means of the F conversion line of Th B and the annihilation
radiation from zn65. All transition energies were calculated from the maximum counting rate of the respective lines, with corrections
applied for the earth's magnetic field, the surface density of the
source of electrons, and the resolution of the spectrometer (13).
II. INTERNAL CONVERSION SPECTRUM
The source was mounted on 0.00025 inch aluminum which in turn
was fastened to a Lucite holder. The surface density of the source
was about
5
mg/cm2. Such a thick source is of no great disadvantagein determining transition energies, since a correction can be made
to take into account the surface density. There is a distinct
advantage in that the counting rates are greatly increased, which
enables the weaker transitions to be detected more readily.
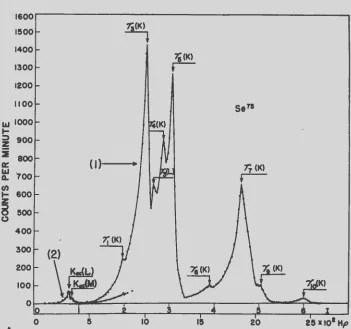
The internal conversion spectrum of se75 is shown in Fig. 1.
Curve 1 was obtained with a Geiger counte2 having a Formvar window
with a surface density of about 0.3 mg/cm . Curve 2 was obtained
from the same source as that used for curve 1, but was determined
286 days (2.3 half-lives) later than curve 1 and with a Geiger
counter h~ving a window of Formvar with a eurrace density of about
27 ~ g/cm . Thifl window was su.pJmrted between metal grids containing
holes O.O!~o inch in diameter and spaced 0.048 inch from center to center. The counter mixture was 33 per cent alcohol and 67 per cent
argon, maintained at a pressure of 1.8 ern of mercury. For the curves
shown in Fig. 1 the resolution of the spectromete~ was 2.1 per cent
1600
1~00 7i(K)
I
1400
7&!K)
1300
r
-1200
1100 sers
I&J 1000 ~ ;:::) 900
~ 2 800
a: (I) 77 (K)
I&J
7oo
Q.
..--U)
~ z
~
0
300
200
100
0 ~ 10 I~ 20 2~ XI01 Hp
Fig. l. Internal conversion spectrum of Se75. Curves (l) and (2) were obtained with different counters. Curve (2) was deter-mined from the same source as curve (1), but was obtained 2.3 half-lives later.
Curve l of Fig. l was redetermined 87 days later and, within experimental error, the intensities of all conversion electrons were found to have decreased by the same factor, indicating that the internal conversion lines shown in Fig. l are from the same activity.
It is apparent from Fig. l that no beta-rays are observed in the decay of Se75. Furthermore the peaks labelled K a {L) and K a {M) are presumably attributable to Auger electrons. The cor-rected electron energy of K a {L) is calculated to be 9.03 kev. The addition of the L binding energy of arsenic gives a value of 10.56
±
0.10 kev. This is in good agreement with the K a 1 andK a 2 values of 10.54 and 10.51 kev respectively for the As X-rays (15). It thus appears that the spectral lines designated K a (L) and
K a (M) may be attributed to Auger electrons ejected from arsenic, following orbital electron capture in Se75 and possible subsequent
[image:7.591.126.477.97.426.2]R. H. Stokes
(16)
has measured the X-rays emitted from the decay of Se75 by means of a Cauchois bent crystal spectrograph and finds that the X-rays of As are present and that the X-rays of Se are not observed. Our data on the Auger electrons are thus in agreement with the findings of Stokes.The lines shown in Fig. 1 can be ascribed to eight nuclear transitions. The energies of these transitions, as determined from the data given in Fig. 1, are included in Table 1 and desig-nated as conversions in As. The probable error in the energies is estimated to be less than one per cent.
III. PHOTOELECTRON SPECTRUM
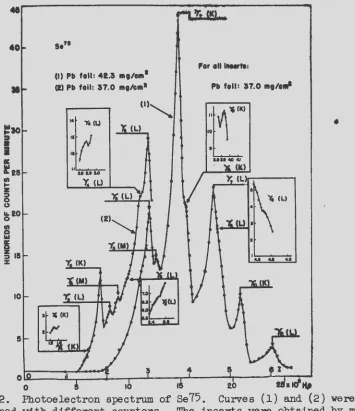
The photoelectron spectrum of Se75, as obtained from lead foils, is shown in Fig. 2. The radioactive source was placed in a Lucite holder and covered with.an aluminum cap of sufficient
(I) Pb toll: 42.3 mg/cm1
(2) Pb foil: 37.0 mg/cm1
:1
7
.. L
u 1.1 a.o'Y.!U
(I)~
'Y. (L)
For all IIIHrtl:
:tf~'
•
UU4104J
(K)
I
" 4.1 4.1
1 20 xl0'141
Fig. 2. Photoelectron spectrum of Se75. Curves (1) and (2) were
obtained with different counters. The inserts were obtained by more detailed examination of the regions indicated and with somewhat
[image:8.593.120.475.304.715.2]Transition
1
2
3
4
5
6
7
8
9
10
Table I
Transition Energies of Se75
Conversion Energy Relative
Shell Mev Weight
As(K) 0.0666 2
Pb~L) 0.0765 3
Pb M) 0.0768 3
As~K) 0.0987 10
As L) 0.0968 3
A·n
0.1239 5Pb K 0.1216 3
Pb L 0.1271 3
ATl
0.1384 10Pb K 0.1366 10
Pb L~ 0.1399 10
Pb M 0.1397 3
As (K) 0.2032 3
Astl
0.2688 10Pb K 0.2677 10
Pb L) 0.2700 10
Pb (K) 0.2814 5
As(K) 0.3078 3
Ast
0.4052 5Pb K~ 0.4029 10
Pb L 0.4070 10
Average Energy
Mev
0.0666
0.0766
0.0983
0.1241
0.1384
0.2032
0.2688
0.2814
0.3078
[image:9.589.64.543.98.747.2]thickness (0.031 inch) to absorb the internal conversion electrons.
The lead foils were fastened to the aluminum caps. Curves-1 and
2 of Fig. 2 were obtained with a spectrometer resolution of 2.3 per
cent (half-width), while all t~e inserts were obtained With a
reso-lution of 2.1 per cent. Curves 1 and 2 were determined with Geiger
counters having mica windows of surface densities
3.8
and 1.0 mg/cm~respectively.
The lines shown in Fig. 2 can be ascribed to six gamma-rays,
of which four are also included in the internal conversion spectrum
of Fig. 1. The energies of the gamma-rays, as determined from the
data given in Fig. 2, are listed in Table I as conversions in lead.
IV. ENERGIES OF NUCLEAR TRANSITIONS
T~e average energies of the ten transitions listed in Table I
are in good ag~eement with those given by Ter-Pogossian et al.
(7).
In only one case is the percentage difference greater than the
estimated probable error of one per cent. Transitions l; 6 and 9
are in addition to those reported by Ter-Pogossian et al.
(7).
Thesetransitions are very weak and were observed only in the internal
conversion spectrum, which was not obtained by Ter-Pogossian et al.
(7).
The average energies of the transitions listed in Table I are
also in fairly good agreement with those given by Cork et al.
(8),
although for six of the transitions the discrepancies are greater
than the estimated probable error of one per cent. In one case,
transition 2, the difference is
5.4
per cent. Cork et al.(8),
report a transition having an energy of 0.0247 Mev, which is in
addi-tion to those given in Table I. We did not observe this transition.
The internal conversion electrons from the K shell for a 0.0247 Mev
transition would appear at a current value of
0.93
amp on curve 2of Fig. l. This is at a slightly larger current value than the peak
labelled K~ (M) which has·a value of
0.85
amp. There is noindica-tion of a peak at
0.93
amp. Since Cork et al.(8)
observed onlythe L and M electrons of this transition it is possible that the
lines labelled Koc... (L) and K ()(... (M) in curve 2 in Fig. l are due to
the radiation which they have a~cribed to a transition of energy
0.0247 Mev. However, since sef~ decays by orbital electron
cap-ture, presumably the Auger electrons should be observed. The peaks
which we ascribe to Auger electrons, in curve 2 of Fig. 1, are in
excellent agreement with the characteristic X~ray energies of As.
An additional gamma-ray, having an energy of 0.0103 Mev, has
been reported by Stokes (16$17). This gamrr~~ay, however, was
apparently from an impurity present in the uriginal samQ5es, since
the gamma-ray was not observed in a second sample of set from which
the impurities had been removed (18). Radioactive 1mpurit.ies of Sb
and Te were detected in the sample of se·rs from which Stokesv
V. INTENSITIES OF GAMMA-RAYS AND INTERNAL CONVERSION ELECTRONS
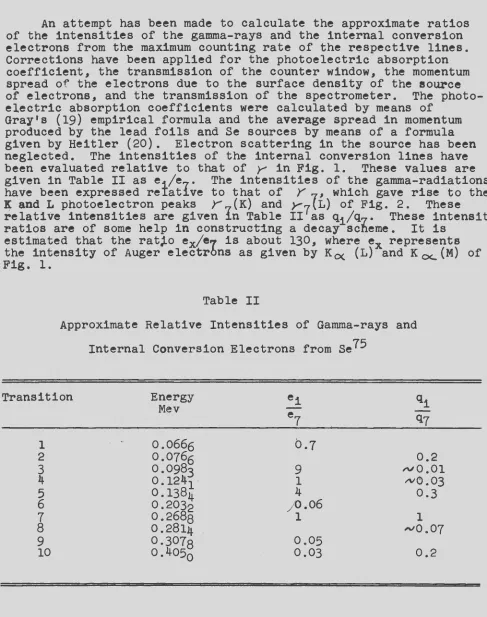
An attempt has been made to calculate the approximate ratios of the intensities of the gamma-rays and the internal conversion electrons from the maximum counting rate of the respective lines. Corrections have been applied for the photoelectric absorption coefficient, the transmission of the counter window, the momentum spread of the electrons due to the surface density of the source of electrons, and the transmission of the spectrometer. The photo-e~ectric absorption coefficients were calculated by means of
Gray's (19) empirical formula and the average spread in momentum produced by the lead foils and Se sources by means of a formula given by Heitler (20). Electron scattering in the source has been neglected. The intensities of the internal conversion lines have been evaluated relative to that of y in Fig. 1. These values are given in Table II as ei/ei. The intensities of the gamma-radiations have been expressed reiat ve to that of
Y
7 , which gave rise to the~ and L photoelectron peaks Y (K) and y ~L) of Fig. 2. These
relative intensities are given In Table II7as qi/q7 . These intensity
ratios are of some help in constru·cting a decay sc.heme. It is estimated that the rat~o ex/e7 is about 130, where ex represents the intensity of Auger elect·rons as given by Kcx (L) and K ex... (M) of Fig. 1.
Table II
Approximate Relative Intensities of Gamma-rays and
Internal Conversion Electrons from Se75
Transition Energy ei qi
Mev
-e7
-
q71 0.0666 b.7
2 0.0766 0.2
3 0.0983 9 ..vO .01
4 0.1241 · 1 .-vC) .03
5 0.1384 4 0.3
6 0.2032 )0.06
7 0.2688 1 l
8 0.2814 ..v0.07
9 0.3078 0.05
[image:11.595.60.547.85.702.2]VI. COINCIDENCE COUNTING MEASUREMENTS
Coincide?ce counting experiments were performed on several
samples of Se
5
using the counter arrangements and circuitsdes-cribed previously (21). The selenium was precipitate~ as the
element in a small drop on a thin mica sheet, 2 mg/cm thick.
After evaporation of the solution the mica sheet was mounted with
the sample spot directly in front of a 3 mm hole in either a brass
or lead plate which could be inserted between the two end-window
Geiger counters. Samples we~e counted without absorber, with a
paraffin a~sorber (148 mg/cm )~ and with an aluminum absorber
(225 mg/cm ). Counts obtained through the aluminum absorber were
due to gamma-rays, counts through paraffin minus counts through
aluminum were taken as the As-K X-ray component, and counts with
no absorber minus counts through paraffin gave the conversion
electron contribution.
In agreement with DeBenedetti and McGowan
(9)
no delayedcoincidences were found in the region of 0. 3-10 ,u sec. Coincidence
counts were obtained with several permutations of absorbers before
the two counters. The usual subtractions for ~ccidental
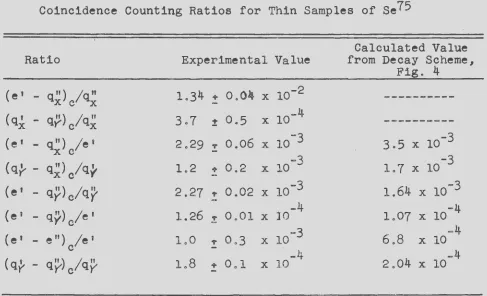
coinci-dence counts and backgroums were applied to the data. These results
taken in conjunction with the spectrometer data, permit some
con-clusions regarding the decay scheme. Experimental values of the
ratio of coincidence counting rates to the rates of individual
counters are given in Table III.
Table III
Coincidence Counting Ratios for Thin Samples of Se75
Ratio
(e' - q") /q"
XC X
(q~
-
qY,)c/q~( e ' -
q")/e '
X C ( q~ - q~) c/q-}
(e' -
qy)c/q(
(e' - q)l)c/e'
(e' - e") /e' c (qv -
qp
c/q)/Experimental Value
1.34
3.7
2.29
1.2
2.27
+ 0.04 X 10⁻²
:!: 0.5 X 10-
4
"l' 0.06 X 10-
3
+ 0.2 X 10⁻³
"' 0.02 X 10⁻³
1.26 :t 0.01
1.0 "l' 0.3
1.8 "r 0.1
-4
X 10X 10-3
-4
X 10Calculated Value from Decay Scheme,
Fig.
4
3.5
X 10-3
1.7 X 10-
3
1.64
X 10-3
1.07 X 10-
4
-4
6.8
X 10-4
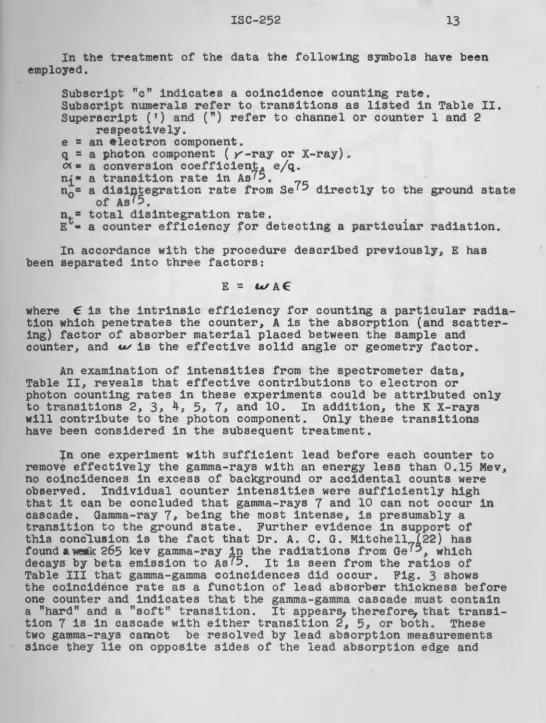
[image:12.597.42.529.417.713.2]In the treatment of the data the following symbols have been employed.
Subscript "c" indicates a coincidence counting rate.
Subscript numerals refer to transitions as listed in Table II. Superscript (')and (n) refer to channel or counter 1 and 2
respectively.
e
=
an e·lectron component.q
=
a photon component ( y -ray or X-ray) •ex= a conversion coefficient.; e/q.
ni= a transition rate in As7J.
n
=
a disintegration rate from se75 directly to the ground state0 of As15.
n
=
total disintegration rate.Et• a counter efficiency for detecting a particuiar radiation.
In accordance with the procedure descr•ibed previously, E has been separated into three factors:
E
=
tc/AEwhere € is the intrinsic efficiency for counting a particular
radia-tion which penetrates the counter, A is the absorption (and
scatter-ing) factor of absorber material placed between the sample and
counter, and ~is the effective solid angle or geometry factor.
An examination of intensities from the spectrometer data,
Table II, reveals that effective contributions to electron or
photon counting rates in these experiments could be attributed only
to transitions 2,
3,
4,
5, 7, and 10. In addition, the K X-rayswill contribute to the photon component. Only these transitions
have been considered in the subsequent treatment.
+n one experiment with sufficient lead before each counter to
remove effectively the gamma-rays with an energy less than 0.15 Mev,
no coincidences in excess of background or accidental counts were
observed. Individual counter intensities were sufficiently high
that it can be concluded that gamma-rays 7 and 10 can not occur in
cascade. Gamma-ray 7, being the most intense, is presumably a
transition to the ground state. Further evidence in support of
this conclusion is the fact that Dr. A. C. G. Mitchell7 (22) has
found a
weak
265 kev gamma-ray in the radiations from Ge 5, whichdecays by beta emission to As75. It is seen from the ratios of
Table III that gamma~gamma coincidences did occur. Fig. 3 shows
the coincid~nce rate as a function of lead absorber thickness before
one counter and indicates that the gamma-gamma cascade must contain
a "hard" and a "soft" transition. It appears, therefore, that
transi-tion 7 is in cascade with either transition 2, 53 or both. These
two gamma-rays cannot be resolved by lead absorption measurements
[image:13.568.7.554.22.746.2]I
2000
1000
500
200
100
Fig. 3. Absorption curve for gamma-gamma coincidences with 225
mg Al/cm2 in front of one counter and 225 mg Al/cm2 plus varying
lead absorbers in front of the other counter. 0
=
y - y coincidencerate and 0
=
y -ray count for second counter. The gamma-reycomponents were obtained from the extended lead absorption curve
by the usual subtraction method.
(
have approximately equal absorption coefficients. Cascade of
transitions 7 and 5 appears .likely because their energies add
within the accuracy of the measurement of the energy of
transi-tion 10.
The ratio, (e' - qx)c/q&, is very much less than w' and
indicates that conversion electrons can accompany only a few per
cent of the disintegrations, which is in agreement with the large
ratio of ex/e7 given in section V. The very low (e' - e")c/e•
ratio requires that at least one of the transitions in cascade
[image:14.560.9.547.24.742.2]VII. DECAY SCHEME
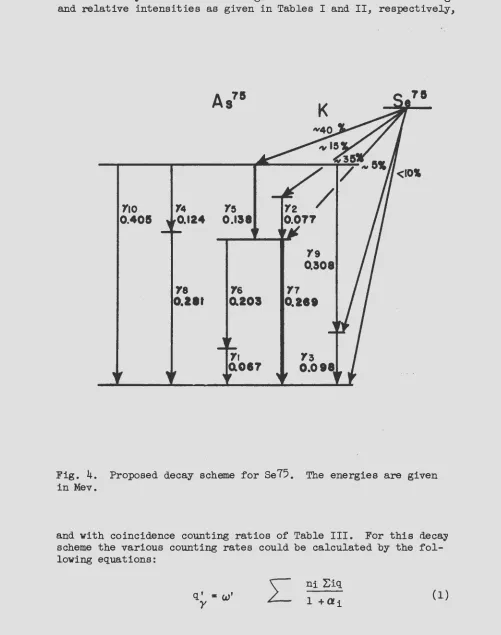
The decay scheme shown in Fig.
4
is consistent with the energies and relative intensities as given in Tables I and II, respectively,•,
110 14 1~
0.405 0.124 0.1!8
19 0.308
78 16 11
O~llt 0.201 0.111
Fig.
4.
Proposed decay scheme for Se75. The energies are given in Mev.and with coincidence counting ratios of Table III. For this decay scheme the various counting rates could be calculated by the fol-lowing equations:
q' ""w'
[image:15.591.47.548.97.732.2]q"
=
X
w"
€
~q
(1
I:
*
represents a summation of transitions in arsenic to theground state. This disintegration rate nt
=
L
*
~.,.
n0 •t '
L
ni O.iAie ·e 1
=
W 11 + 0( i
Coincidence rates are given by the following equations. Since
~ 1
<:<(
1 except for transition3,
a number of small terms canbe omitted for simplicity.
(2)
(3)
I i
•
"E"
[2
n5 ·Ase·D!5 2 n7 Afe 0(7 2 r3 A3e ~ 3I w
w
xq( e' q~)~
=
+
...
+1 + 0(
X 1 .,. 0( 5 1 + 0( 7 1 + Cl( 3
2. n4 A4e
: 4]
(4)1 + 0(,
w'
u.;" E~g"
( q I
=
niE
iqL
- qY,.) c
X
1 + 0\ X i 1 .,. 0( i (5)
w'
w"
(e' - e")
=
t..v'c..v"
c
2
6z
9e:
2 9 _ ...£2g_EzQ.
+[ n ( f . I II . . .. II\ ) n5 ( E fq
E
§q +E~q E.!{q~(
6
)
(1 +0(7)(1 +0(5)
J
( 1 + 0( 7 ) ( 1 + Of 2)
[ n2 ex 2 ex. 7(AfeA2e +. A2eA7e)
(1 + 0(2)(1 +0( 7)
,.y ( 1 11 I 11
)J
n5 ~ 5 ~ 7 A7eA5e + A5eA7e
(1 + ~5)(1 + ~ 7)
[ n5 ( 0{
5A~e
E
7q + 0<7A7e E Sq)(1 +0(5)(1 + ~7) t
n2 ( 0( 2A2e
E
7
q + 0( 7Af eE
2q)
J
(1 +0(2)(1 +0(7)
(8)
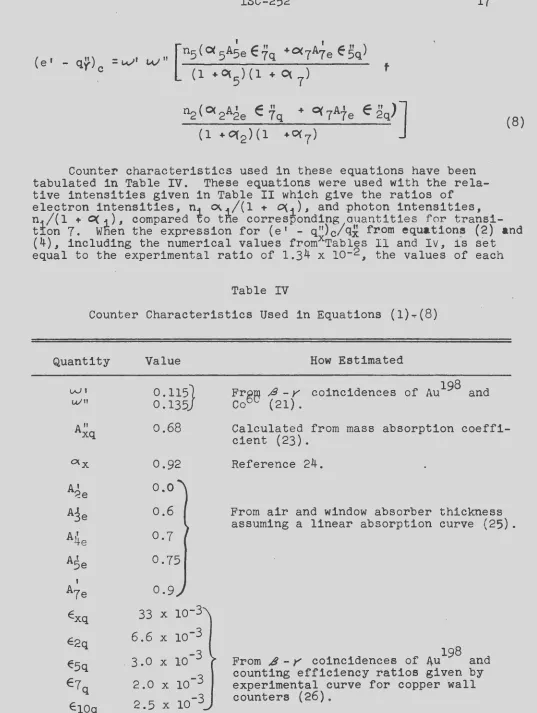
Counter characteristics used in these equations have been tabulated in Table IV. These equations were used with the rela-tive intensities given in Table II which give the ratios of electron inten-sities, n ex /(1 .,. O(i), and photon intensities,
ni/(1 +
~i),
comparedto
t~e
corresponding quantities fortransi-t:Ion 7. When the expression for (e1 - q")c/q~ fr.om equation~ (2) and
(4), including the numerical values fromxTables I I and IV, is set equal to the experimental ratio of 1.34 x 10⁻², the values of each
Table IV
Counter Characteristics Used in Equations (1)~(8)
Quantity
wr
u,/11
A II.
xq
O(x
A' 2e
A3e Alj_e A_5e
'
A7e Exq E2q Esq E7q E10q Value0.115
J
0.135 0.68 0.92 0.0 0.6 0.7 0.75 0.933 x lo-3
6.6 X 10⁻³
. 3.0 X 10⁻³
2.0 X 10⁻³
2.5 X 10⁻³
How Estimated
From .,8-y coincidences of Au 198 and CobU (21).
Calculated from mass absorption
coeffi-cient (23).
Reference 24.
From air and window absorber thickness assuming a linear absorption curve (25).
198
[image:17.591.29.566.33.746.2]electron component9 ni 0<1/nt(l ~ ~~) 9 can be calculated.
Like-wise a similar treatment using the ratio for (q* ~ q~)c/q~ was used
to give values for n /nt(l ~~1). From these two sets of data the
intensity and eonver~ion coefficient for each of the transitions
were calculated and included in Table V. Transitions
3,
7a and 10to the ground state account for more than 95 per cent of the
disin-tegrations. It was concluded that only a few per cent of the
orbital electron captures~ at most9 can lead directly to the ground
state. With these results the remaining six coincidence counting
ratios were calculated and appear in Table III. Support of the decay scheme shown in Fig.
4
1s demonstrated by the satisfactoryagreement between the calculated and observed values in every case.
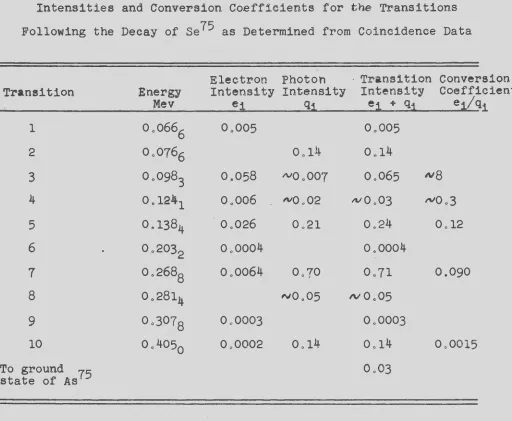
Table V
Intensities and Conversion CDefficients for the Transitions
Following the Decay of se75 as Determined from Coincidence Data
Electron Photon · Transition conversion Transition Snergy Intensity Intensity Intensity Coefficient
Mev ei
q1
e1
+ q1 ei/qi1 0.0666 0.005 0.005
2 0.0766 0.14 0.14
3 0.0983 0.058 IVQ .007 0.065 N8
4 0.1241 0.006 NQ.02 NO .03 1'10.3
5 0.1384 0.026 0.21 0.24 0.12
6 0.2032 0.0004 0.0004
7 0.2688 0.0064 0.70 0.71 0.090
8 0.2814 N0.05 IV 0.05
9 0.3078 0.0003 0.0003
10 0.4050 0.0002 0.14 0.14 0.0015
To ground
[image:18.593.34.546.247.668.2]Similar computations were carrie-d out for the alternative decay scheme in which transition 2 terminated in the groundstate
and was not in cascade with other transitions. For this case
the _I'atio (q~~ q~) /q(' was 8.3 x l0-5_,~~isagreeing seriously
with the experimentgl value of 1.8 x 10 .
Assuming that none of the orbital electron captures lead directly
to tqe ground state9 as is indicated by the coincidence data_, it is
posstble to determine the conversion electron and photon intensities,
the tfansition intensities9 and the conversion coefficients from
the decay scheme shown in Fig.
4
9 the relative intensities givenin Table II, the ratio of Aue;er electrons to conversion electrons
in transition
7
(i.e.9 ex/e7 ) and the fluorescent yield for arsenicX-r.ays (which is about 0.52) (24). These calculations make use of
two equations~ of which one gives the X~ray transition rate and the
second ·gives the disintegration rate. The transition intensities
(ei • qi) Obtained _in this way are- in good agreement with those given
in Table V. The conversion coefficients, 0(1 , calculated by this
method are, however, approximately one~half of those given in Table
V. Tpis discrepancy is primarily due to the difference in the
electron intensities, ei. The ratio ex!e7 was not used in calculat~
ing the vaLues given in Table V.
The intensity of transition 3 is appreciably greater than that
of transition 9 and therefore require~ that there be decay by
orbital electron cagture to the energy level 0.0983 Mev above the
ground state of As750 Similarly, there must also be decay by
orbital e_;te.ctron c1gture to the energy level 0.269 Mev above the
ground state_of As • .
Cork et al., have proposed a decay scheme which in many ways is similar _to the one shown in Fig. 4. Two possible objections to
their decay scheme might be mentioned, however. They have
transi-tion
3
precede and decay through the parallel transitions 9 andthe 24.7 kev disintegration. As can be seen from Table II and lligs. 1 and 2s transition 3 is many times more intense than 9. As mentioneq previously we have not found any evidence for the
e~istence or the 24.7 kev gamma-ray or its internal conversion
e~ectrons. We would infer thats if it exists, it must be very
weak. Hence, it appears improbable that transition 3 precedes 9.
Cork et al., (8) also propose chat the parallel transitions 1 and
2 preceded and decay through 6. Our data, shown in Table II9
indicate that e1 is considerably larger than e6 and that q2 is also
considerably larger than Q6 and hence it seems improbable that
transitions 1 and 2 in parallel can precede and decay through 6.
VIII. DISCUSSION
There appears to be a real discrepancy between the K/L ratio
and the apparently large internal conversion coefftcient for
is consistent with the K/L ratio» internal conversion coefficient,
, lif€time of the excited &tate~ and the nuclear shell model. Most of the available evidence indicates magnetic· dipole radiation. The
evidence for this conclusion is given in the following discussion.
From the data shown in Fig. 1, a value of 11 is founu for the
K/L ratio of transition 3, for which the energy is 98.3 kev. The experimental cuTves of Goldhaber and Sunyar (27) indicate a K/L
ratio of about 8 for both magnetic dipole and quadrupole radiation
for Z ~ 33 and E
=
98.3 kevp and a K/L ratio of about 4.3 and 3.0for electric quadrupole and octupole radiation, respective·ly. Hence
the K/L ratios although app~eciably larger than the values given by
the experirnental:curves of Goldhaber and Sunyar (27), indicates rn~gnetic dipole or quadry£ole radiation wi~h lifetimes of the
excited state of 3 x 10~ sec and 1 x 10~ se~respectively.
These lifetimes are estimated from the formula of Weisskopf (28),
taking into account the internal conversion coefficients as
deterlllined from the tables of Hebb and Nelson (29) and the curves given by Axel6and Goodrich (30). The latter lifetime· is in the
region of 10- to 10-3 sec, within which DeBenedetti and McGowan (9)
did not observe any delayed coincidences. Also9 Feenberg and
Hammack (31) and Nordheim (32) have pointed out that "islands of isomerism" exist for odd nuclei with 39 ~ (N or z) ~49 and for 63 ~ (N or Z) ~ 81.9 where N and Z are r~;3pectively the number of neutrons a~d protons in the nucleus. As"f':>s with 33 pr0tons and
even N9 does not fit into either one of these "islande". This
would seem ·to indicate that transition 3 is magnetic dipole
radia-tion.
The spin of the ground state of As75 has been determined
experime~tally and found to be 3/2 units (33). The magnetic
moment (33) _pf As75 is 1.4 nuclear magnetons, which indicates a
P3/2 level
(34).
M.G. Mayer (35) suggests that the level order for odd nucl~i with 28 ~(N or z)~50 is p~/2' f~;2, P1; 2 and g9/2• If the ~8.3 kev transition is to the grouno stat~ of p3·;2 , asindicated in'Fig. 4, then, on the basis of the nuclear ~fiell model,
the first exeited state is fs/2· This would give a spin change of
one unit witp no change in parity and hence magnetic dipole radia-tion. This ~s in agreement with the K/L ratio.
j
The assignment of magnetic dipole radiation to transition 3
is inconsistent. with the large internal conversion coefficient of
4 to 89 which 1~ obtained from the data presented in this paper.
From the curveslgiven by Axel and Goodrich ·(30)~ the relativistic
K shell interna~ conversion coefficient for transition 3 is 0.07 for
magnetic dipole. ~adiation. It should be stated that the internal
conversion coefficient for transition 3 as calculated from our data is a very approximate value9 since9 as can be seen in Fig. 2, the
photoelectrons due to gamma-ray 3 had a very low intensity. This
low intensity indicates.\) however, that the internal conversion
If one alternatively assumed magnetic octupole radiation for
transition
3,
the re~ativistic K shell internal conversion coefficient (30) would be about 5.7 and the K/L--ratio given by the experimental curves of Goldhaber and Sunyar (27) would be approximately 6.00 The K/L ratio is appreciably smaller than the experimental value of 11.The lifetime (28,29,30) of the excited state expected for this radia-tion is ab.out 3.5 min. This lifetime-is inconsistent with the
nuclear shell model. · We have looked for ._ relatively long-lived
metast~ble state in ~s75 by making a rapid (5 min.) ·chemi~&l ~ep•ra~
tion of As from se75. About on~ per eent of the total se·r, activity was observed in the separated As fraction, but this .small ictivity could not·be distinguished from .. the radiations of Se.f5 on the basis of half-life; and absorption curves. . .. '
It should also be noted that the L and M electron lir\eS of
transition 2 were observed in the photoelectron spectrum of Fig. 2. but no internal conversion lines were observed in Fig. 1. This perhaps indicates that the internal conversion coefficient.of transition 2 is small.
1.
3.
4.
5.
6.
7.
8.
9.
LITERATURE CITED
Kent, Cork, and Wadey, Phys. Rev. 61, 389 (1942).
Burgus, Edwards~, Gest, Stanley
4
and Williams, Plutonium Project Report CN-2839, p. 9 (June, 19 5); cited b¥ G. T. Seaborg and I.Pearlman, Revs. Modern Phys. 20D 585 (1948).
Friedlander, Seren, and TurkelJ) Phys. Rev. 72, 23, 888 (1947).
H. H. Hopkins, Jr. and B. B. Cunningham, Phys. Rev. 73, 1406
(1948).
Cowart, Pool, McGown, and Woodward, Phys. Rev. 73, 1454 (1948).
H. Gest and L. E. Glendenin, NNES 9, paper 327 (1951).
Ter-Pogossian, Robinson, and Cook, Phys. Rev. 75, 995 (1949).
Cork, Rutledge, Branyan, Stoddard, and Le Blanc, Phys. Rev. 79, 889 (1950).
S. DeBenedetti and F. K. McGowan, Phys. Rev. 74, 728 (1948).
10. Jensen, Laslett and Pratt, AECD-1836 (1948); E. N. Jensen~
AECD-2399 (1948); Progress Report in Physics, Iowa State College,
ISC-46 (1949).
11. G. T. Seaborg and I.P.earlman, Revs. Modern Phys. 20, 585 (1948).
12. Nuclear Data, NBS Circular 499 (1950).
13. Jensen, Laslett, and Pratt, Phys. Rev. 75, 458 (1949).
14. Pratt, Boley, and Nichols, Rev. Sci. Instr. 22, 92 (1951);
Keller, Koeni~sberg, and Paskin, Rev. Sci. Instr. 21, 713
(1950).
---15. Compton and Allison, X~Rays in Theory and Experiment (D. Van
Nostrand Company, Inc., New York, 1935~second edition, p. 78~.
19. R. H. Stokes, AECD-1843 (1948).
17. Progress Report in Physics, Iowa State College, ISC-46 (1949).
18. R. H. Stokes, private communication.
20. W. Heitler, The Quantum Theory of Radiation (Oxford University
Press, New York,
1944),
second eaition, p. 219.21. Martin, Jensen, Hughes, and Nichols, Phys. Rev. 82, 579 (1951).
22. Private communication.
23. A. H. Compton and S. K. Allison, X-Rays in Theory and Experiment
(D. Van Nostrand Company, Inc., New York~l935), second edition,
p. 800.
24. Ibid., p. 488.
25. L. E. Glendenin, Nucleonics, 2, No. 1, 12 (1948).
26. H. Saurer, Helv. Phys. Acta, 23, No. 4, 381 (1950).
27. M. Goldhaber and A. W. Sunyar, Phys. Rev.
83,
906 (1951).28. V. F. Weisskopf, Phys. Rev.
83,
1073 (1951).29. M. H. Hebb and E. Nelson, Phys. Rev. 58, 486 (1940).
30. P. Axel and R. F. Goodrich, Internal Conversion Data, distributed privately.
31. E. Feenberg and K. C. Hammack, Phys. Rev. 75, 1877 (1949).
32. L.
w.
Nordheim, Phys. Rev. 75, 1894 ( 1949) 033. J. E. Mack, Revs. Modern Phys. 22, 64 (1950).
34. See, for example,
(1949). Fig. la of L. W. Nordheim, Phys. Rev. 75, 1894
35. M. G. Mayer, Phys. Rev. 78, 16 (1950). Also see Mayer, Moszkowski,