This is a repository copy of Does risk explain persistence in private equity performance?. White Rose Research Online URL for this paper:
http://eprints.whiterose.ac.uk/147571/ Version: Accepted Version
Article:
Buchner, A, Mohamed, A and Schwienbacher, A (2016) Does risk explain persistence in private equity performance? Journal of Corporate Finance, 39. pp. 18-35. ISSN 0929-1199 https://doi.org/10.1016/j.jcorpfin.2016.05.003
© 2016 Elsevier B.V. Licensed under the Creative Commons
Attribution-NonCommercial-NoDerivatives 4.0 International License (http://creativecommons.org/licenses/by-nc-nd/4.0/).
[email protected] https://eprints.whiterose.ac.uk/ Reuse
This article is distributed under the terms of the Creative Commons Attribution-NonCommercial-NoDerivs (CC BY-NC-ND) licence. This licence only allows you to download this work and share it with others as long as you credit the authors, but you can’t change the article in any way or use it commercially. More
information and the full terms of the licence here: https://creativecommons.org/licenses/
Takedown
If you consider content in White Rose Research Online to be in breach of UK law, please notify us by
1
Does Risk Explain Persistence in Private Equity Performance?
*Axel Buchner University of Passau
Abdulkadir Mohamed Cranfield School of Management
Armin Schwienbacher
Université Lille SKEMA Business School
This version: May 13, 2016
_____________________________________________________________________________________
* Contact details of authors: Axel Buchner, University of Passau, Department of Business and Economics,
University of Passau, 94030 Passau, Germany, email: [email protected], phone: +49
8515093245; Abdulkadir Mohamed, Cranfield School of Management, College Road, Cranfield MK43 0AL,
United Kingdom, email: [email protected]; phone: +44 1234 751122; Armin
Schwienbacher, SKEMA Business School, Lille Campus, Avenue Willy Brandt, 59777 Euralille, France,
email: [email protected]. We are indebted to Douglas Cumming and Jay Ritter for their
2
Does Risk Explain Persistence in Private Equity Performance?
Abstract
In this paper, we investigate whether fund-specific risk helps explain performance persistence in
private equity funds, using detailed deal-level cash flow information at both the fund and deal
levels. We further extend existing findings to international evidence on buyout and venture
capital (VC) by testing the impact of various risk measures. We find that risk is an important
driver of performance persistence and helps explain such persistence. We also find persistence
in risk in private equity, in particular persistence in downside volatility for both buyout and VC
funds. Finally, we document that fund performance is more strongly affected by fund managers
able to minimize downside losses than selecting outperforming portfolio companies. This effect
is strongest for buyout but, to a weaker extent, also holds for VC. Our results are further robust
to controlling for legal factors at the country level.
Keywords: private equity; performance; venture capital; buyout; risk; persistence
3
1. INTRODUCTION
Since Kaplan and Schoar (2005) seminal article on fund performance persistence in US private
equity (PE), several follow-up studies have investigated drivers of this persistence. For example,
Harris, Jenkinson, Kaplan and Stucke (2014) find that performance persistence has largely
disappeared in the buyout but not venture capital (VC) segment. In contrast, Korteweg and
Sorensen (2014) find greater long-term persistence in buyout than in VC due to larger
differences in skills among buyout fund managers. Cumming Dai, Hass and Schweizer (2012)
even document performance persistence in the hedge fund industry, and that the level of
persistence is affected by regulation. The question whether there is persistence in fund
performance is important because it implies that some fund managers consistently outperform
their peers over a longer period and, thus, that past performance is a good predictor of future
performance.
This study contributes to this debate by examining whether fund-level risk can explain
the observed persistence in performance of funds. Performance persistence might simply occur
because fund managers consistently take on more risk than other fund managers, leading to
persistence in risk. Fund managers who take high levels of risk would have persistently higher
returns than their counterparts. Previous studies have not investigated this issue because of a
lack of accurate deal-level data. However, Kaplan and Schoar (2005) recognized that risk might
help explain persistence, but they could not investigate it further beyond examining potential
differences across subsamples of fund asset classes to capture differences in risk between
4
strong cash flow pattern over time in the 10-year life cycle of private equity funds. This pattern
occurs because cash flows are lower at the beginning and increase significantly toward the end.
In contrast, we make use of deal-level cash flows, which allow us to calculate the volatility of the
internal rates of return (IRRs) of the different deals to measure risk at the fund level. This
approach helps us investigate the following research questions: do differences in risk explain
the fund performance persistence puzzle in private equity? Moreover, in addition to
performance persistence, can we observe persistence in risk over follow-up funds? More
generally, is fund performance driven by managers able to consistently "minimize extreme
losses" (i.e., downside volatility) or "select outperforming deals" (i.e., generate upside
volatility)? Both effects affect performance, but in different ways. We investigate these research
questions for VC and buyout funds located both in the United States and internationally.
In this paper, we use detailed deal-level and fund-level cash flow data coming from the
Center for Private Equity Research (CEPRES) database. Our international sample covers 18,256
unique investments in portfolio companies done by 769 VC and buyout funds during the 1980
2009 period. Slightly more than half the investments are realized (i.e., divested). Although
portfolio companies are anonymized, the database enables linking portfolio companies to funds
and funds to management firms. Previous versions of the data have been used by Franzoni,
Nowak and Phalippou (2012) for buyout and Cumming, Schmidt, and Walz (2010), Cumming and
Walz (2010) and Krohmer, Lauterbach, and Calanog (2009) for VC. In contrast, our sample
covers a larger time span and both types of private equity (VC and buyout). Moreover, we make
5
Our primary measure of risk is intra-fund volatility, which represents the standard
deviation of IRRs of the different portfolio companies in which a fund has invested over its
lifetime. This volatility is essentially a proxy for total investment risk of a fund. Using total risk
seems somewhat unconventional given that standard asset pricing theory suggests that only
systematic risk is priced in equilibrium. However, in contrast to this conventional view, the
article from Ewens, Jones and Rhodes-Kropf (2013) provides evidence that idiosyncratic risk is
also a priced factor for private equity fund investments. Ewens, Jones and Rhodes-Kropf (2013)
develop a theoretical model to analyze the role of idiosyncratic risk for the pricing of private
equity investments. Their model predicts a positive relationship between the investment
returns of funds and the ex- E ,
strong correlation between realized total risk and fund returns. Based on this previous empirical
evidence, it seems reasonable to use total risk as the appropriate measure of investment risk for
private equity funds in this paper.
We further consider upward and downward intra-fund volatility to examine the impact
of upside and downside risk on fund performance. This extension is motivated by the fact that
private equity investments typically involve highly skewed investment returns that deviate
substantially from a normal distribution. In this case, downside volatility is a more plausible
measure of risk than variance because investors worry about under-performance rather than
over-performance, as Markowitz (1991) suggests. Consistent with existing studies, we use the
Public Market Equivalent (PME) ratio as our main measure of fund performance. PME uses a
market index of similar risk to scale a fund's market value and thus is a risk-adjusted
6
Sorensen and Jagannathan (2015) and Korteweg and Nagel (2015) shows that the PME is a
risk-adjusted performance measure that can be derived under the assumption that investors have
logarithmic utility functions. As a risk-adjusted measure of performance the PME should not be
correlated with any measure of systematic or total fund risk. However, if PME is highly
correlated with our measures of total risk (below, we will show that this is the case), then it is
reasonable to include further controls for risk when using the PME to assess performance
persistence. Our results, however, also hold for IRR, which is a measure of absolute returns. In
other words, we examine the impact of total risk on fund performance, which is an appropriate
measure for studying persistence in performance and risk.
We find that total fund risk is an important driver of performance in the US, even for
risk-adjusted performance. We find no persistence in non-US funds. Total risk explains away the
previously documented performance persistence for the US, especially for buyout funds. For US
VC funds, performance persistence remains, while total fund risk is also a significant driver.
Next, we find strong persistence in risk, consistent with the view that performance persistence
goes hand in hand with persistence in risk. This finding offers an alternative and complementary
explanation for performance persistence to the traditional one based on expertise. This
relationship is again strongest for US funds. When evaluating downside and upside risk
separately, we find that the impact of downside risk persistence is strongest for both buyout
and VC funds, since upside volatility is generally not persistent after controlling for fund size.
Prompted by these findings, we next investigate whether fund performance is driven by
a strategy of "minimizing extreme losses" or "generating outperforming ventures", an issue that
7
reasons: either because they are able to minimize total losses, notably by selecting targets that
do not appear too risky, or because they are able to select the most promising firms in the
industry and thereby ensure that at least one investment generates a very high return. In the
first case, performance is high because downside risk is minimized; in the second case,
performance is high because the fund has a "star" included in its portfolio (leading to higher
upward volatility). Our analysis indicates that managing downside risk has the greatest impact
on fund performance. Consistent with our intuition, this finding is strongest for buyout funds,
for which target companies are more mature and typically require corporate restructuring. For
VC funds, the impact of upside risk is more important than for buyout funds, because VC
investments are prone to more upside gains owing to the highly innovative and
high-growth-oriented firms in which VC funds invest.
Finally, we extend our analysis by examining the impact of legal conditions and
fund-level (managerial style) characteristics. Following extant literature (including La Porta,
Lopez-de-Silanes, Shleifer and Vishny, 1998, Cumming and Knill, 2012, Cao, Cumming, Qian and Wang,
2015, Cumming and Dai, 2010, Cumming, Dai, Hass, and Schweizer, 2012, and Cumming, Siegel
and Wright, 2007), we find no evidence that our results are driven by these additional factors. In
fact, we find no evidence that the broad measures of "law & finance" traditionally used in the
literature affect persistence.
Our study contributes to the literature on fund performance in private equity.1 To the best of our knowledge, the only study that directly links fund performance to deal-level
1
8
characteristics is that by Braun, Jenkinson and Stoff (2013). However, they are unable to relate
portfolio companies to specific funds so that they construct "synthetic funds" by bundling a
series of sequential investments. In contrast with their approach, we are able to allocate every
portfolio company investment to a specific fund, for which we also have detailed fund
information. Thus, we have extensive information on management firms, funds and portfolio
companies and can relate each company to a fund and each fund to a management firm. This
allows us to construct precise measures of risk and extend our understanding using new
information. Franzoni, Nowak and Phalippou (2012) examine a driver of abnormal returns (the
"alpha") in private equity and find that it is explained by its liquidity risk premium. This result
suggests that risk specific to private equity helps explain differences in returns between private
and public equity. However, these authors do not examine persistence over time.
Marquez, Nanda and Yavuz (2014) offer a theoretical contribution into this literature by
developing a model to explain why performance persistence is in equilibrium. They argue that
top-performing fund managers may voluntarily limit fund size and fees to generate more value
in the selected portfolio companies than other fund managers. As a result, funds of
top-performing managers become over-subscribed but also show persistence in performance.
The remainder of the paper is structured as follows: the next section describes the data,
defines our risk measures used and presents our sample. Section 3 analyzes drivers of fund
performance and the impact of risk on performance persistence. We further examine
persistence in risk. Section 4 concludes.
9
2.1. Data Description
We use data from the CEPRES database, which is unique in that it provides detailed information
and cash flow data at deal and fund levels; other databases tend to provide data for private
equity at either the fund level or the investment level only. CEPRES data are described in detail
in Franzoni, Nowak and Phalippou (2012). Several studies have used the database, including
Cumming, Schmidt and Walz (2010), Cumming and Walz (2010), Franzoni, Nowak and Phalippou
(2012), and Krohmer, Lauterbach and Calanog (2009).
Through its special data collection method (based on the so-called Private Equity
Analyzer), CEPRES effectively anonymizes all information related to investments to meet the
confidentiality requirements of the VC and PE firms that provide data to CEPRES. This means
that third parties are not able to identify individual portfolio companies, funds or management
firms. This is crucial and eliminates the incentives for management firms to overstate the results
they report to CEPRES. Lack of anonymity in other databases may result in overstating, partial
reporting and back-filling of information, amounting to positive self-reporting biases. We have
details on 392 buyout funds that invested in 6,702 deals, 3,729 of which are fully realized deals.
We also observe 377 VC funds that invested in 11,554 deals, 6,005 of which are fully realized
deals. Our sample covers deals made during the period from January 1980 to the end of 2008,
for which we have cash flow data until December 2009. All our variables are defined in
Appendix Table 1.
Figure 1 depicts the number of buyout and VC funds by vintage year. It shows that our
10
during the 1980s and early 1990s compared with later years. Just before the dot.com bubble,
the number of VC and buyout funds had almost doubled, as compared with the 1980 1998
period, and continued to increase during the bubble (especially VC funds). During the
post-bubble period, the number of funds established again declined significantly, but not as much as
the number of funds established in the 1980s and early 1990s. Since the financial crises, only a
few new VC and buyout funds have been raised, possibly because of unfavorable exit markets
and lack of capital supply from capital-constrained institutional investors.
[Please insert Figure 1 about here]
Table 1 reports for our sample the distribution of VC and buyout deals by investment
year from 1980 through 2009. The sample is divided into buyout and VC funds and by US and
non-US funds. The table shows that in the early 1980s, the number of deals was lower than that
in the 1990s and 2000s. This is true for the buyout and VC deals and for deals done by US and
non-US funds. For the US buyout, the number of deals realized was higher in the 1980s and
1990s than those in the 2000s. The pattern is consistent for non-US buyout funds. For the VC
funds, there were more realized deals in the 1980s and 1990s than in the 2000s in terms of
numbers and proportions, consistent with the need for a longer investment period of several
years in VC before an exit is possible. These results are not limited to US VC funds, but also
non-US VC funds. Although the number of investments has increased in the 2000s, the rate of
11
shows, VC deals are more than twice the number of buyout deals, while for the US subsample,
the VC deals are approximately three times the number of buyout deals.
[Please insert Table 1 about here]
2.2. Definition of Risk Measures
To analyze whether differences in risk explain performance persistence, we construct several
measures of risk for our sample of private equity funds. The first measure of risk is the
Intra-Fund Volatility of IRRs. For a fund that has invested in N portfolio companies with returns, as
measured by the IRR, given by IRR1, IRR2, IRRN, this risk measure is calculated by
,
)
(
1
1
1 2
N i iIRR
IRR
N
where IRR is the mean rate of return of all the N investments made by the fund. This measure
corresponds to the standard deviation of IRRs of individual investments made by the fund. It
proxies for the variability or dispersion of the investment returns of a fund around the mean
value. Thus, funds that take on high levels of investment risk, on average, display higher levels
of intra-fund volatility than funds that take on low levels of risk.
The intra-fund volatility presented previously is only a valid measure of risk a fund takes
when returns are adequately captured by a normal distribution. The reason is that the
intra-fund volatility does not distinguish between variations below and above the mean. To account
for the fact that private equity returns are typically highly skewed, we use two additional
12
volatility introduced previously that allow distinguishing between the different degrees of
upside and downside variations in returns. The formal definition of Intra-Fund Downside
Volatility of IRRs is2
N i iD
IRR
Tar
N
1 2)
0
;
(min(
1
.The formal definition of the Intra-Fund Upside Volatility of IRRs is
N i iU
IRR
Tar
N
1 2)
0
;
(max(
1
.In both equations, "Tar" denotes the return target. Similar to Ang, Chen and Xing (2006), we use
a target return of zero in all the following calculations.
2.3. Summary Statistics of Sample
Table 2 reports the descriptive statistics of different risk measures for the full sample, buyout
and VC funds. We also report statistics for two related measures of return distribution: Loss
Rate and Intra-Fund Skewness of IRRs. Loss Rate refers to the percentage of investments of a
fund that lead to complete loss and thus generate an IRR of 100%.
The mean (median) loss rate of funds is 8.46% (3.85%) for the full sample (all quartiles
combined), while for buyout and VC separately, these values are 6.06% (0.00%) and 14.82%
(13.04%), respectively. As expected, the probability of total loss is greater for VC than for
buyout funds. The intra-fund volatility is high for the full sample of funds with mean (median) of
2
13
101.22% (58.18%), while the value for buyout is 92.20% (57.99%) and for VC is 123.1% (69.76%).
As indicated by the next two measures, the high intra-fund volatility is driven by the upside
rather than the downside volatility. This observation is true for the buyout and VC funds. For
example, the intra-fund downside volatility is 27.50% for the full sample compared with 97.21%
for the intra-fund upside volatility. For the buyout, the downside volatility is 22.38% compared
with 94.00% for the upside volatility. Similarly, for the VC, the downside volatility is 40.21% and
the upside is 111.15%. The funds are positively skewed, especially for the VC funds, with a
skewness of 1.62, compared with 0.89 for the buyout and 1.12 for the full sample.
Table 2 also shows how the risk measures differ between the first and fourth quartile
funds. Fund quartiles are calculated by sorting data based on the IRRs of funds. The mean loss
rate is high for the first quartile and slightly lower for the fourth quartile. The mean of intra-fund
volatility for the first quartile is lower than the fourth quartile and consistent for the full sample,
buyout and VC funds. We observe the same for the upside volatility, while for the downside
volatility, the mean is high for the first quartile and low for the fourth quartile. In other words,
funds with a low performance show, on average, a higher downside risk. In terms of skewness,
the intra-funds IRR are highly positively skewed in the fourth quartile and less positively skewed
in the first quartile. This is consistent for the full sample, buyout and VC funds. These statistics
indicate that high fund performance is mainly driven by a few deals. The excessive skewness of
the intra-fund IRRs justifies our choice of using robust regressions in our multivariate analysis.
14
3. ANALYSIS
3.1. Performance of VC and Buyout Investments
We measure the performance of VC and buyout investments using IRR and investment multiple
and Public Market Equivalent (PME). These measures of performance are widely used in the
literature (see Harris, Jenkinson, Kaplan and Stucke, 2014; Harris, Jenkinson and Kaplan, 2014).
Our measure of IRR is gross of fees, which include carried interest. We use all realized deals of a
fund to estimate the IRR using cash flow from initial investments to the exit. The investment
multiple compares the sum of all investments in portfolios companies with the sum of all cash
outflows and the residual value of the investments. On the other hand, The PME can be viewed
as a market-adjusted multiple of invested capital. Table 3 shows the mean and median IRR,
multiple and PME in each investment year, based on deal-level data. The table further reports
averages for the 1980s, 1990s and 2000s. The results are reported separately for buyout and VC
deals. The table shows significant variations in the IRR, multiple and PME for buyout deals
across investment years. For all years, the average IRR is 19.8% and multiple and PME are 2.644
and 1.842 respectively. Buyout deals before the financial crisis seem to have negative IRR, and
low multiple and PME on average. The average IRR was low in the 1980s but significantly higher
in the 1990s and 2000s. However, for the multiple the mean is quantitatively similar across all
the investment years (mean multiple for 1980 2008 is 2.644). The PME has been higher in the
2000s as compared to the periods between 1980s and 1990s.
15
For the VC investments, the performance patterns are different from the buyout
segment. The average IRR across all investment years is 23.6%, multiple is 2.703 and PME is
1.942. VC deals had exceptionally high IRRs of more than 70% on average during 1998 and 1999.
This could be due to the dot.com bubble during that period. Over the same period, buyout
funds generated an average IRR of 5.2% in 1998 and 5.6% in 1999. The average IRR was low in
the 1980s, rather high in the 1990s, and again negative in the 2000s. Furthermore, the average
investment multiple and PME are lower in the 2000s than in the 1980s and 1990s.
Table 3 shows the IRRs and multiples for US and non-US funds, and Table 4 reports
statistics of IRRs and investment multiples for deals carried out by US based funds only. We
again separate the sample by fund type. For buyout deals, the average IRR in the 1980s was
16.9% compared with 26.2% in the 1990s and 14.4% in the 2000s. The corresponding median
IRR was 20.3%, 23.0% and 19.7%, respectively. The fact that the median IRRs are higher than the
means suggests that the IRRs are skewed to the left. The returns during the Internet bubble are
negative, but after the bubble, the returns are positive. In addition, the multiples were high in
the 1980s and 1990s but low in the 2000s. For VC deals, the average IRR is 24.3%, while in the
1990s, it was approximately 57.5% compared with 23.6%. During the dot.com bubble in 1999,
VC deals significantly outperformed the buyout deals in absolute terms. However, post-2000 the
VC returns have been low and have persisted until the end of 2009. The fact that VC returns
have been low on average is consistent with Harris, Jenkinson and Kaplan (2014) findings. Taken
16
2000, while in the 1990s, the IRRs of VC deals were higher than those of buyout deals. This
evidence is consistent in the US and non-US subsamples.
[Please insert Table 4 about here]
Table 5 shows summary statistics in terms of fund sequence number included in our
sample. Panel A shows statistics for the sample that also includes first funds. Panel B shows the
same statistics but with follow-up funds only; i.e., only the sample of funds that are included in
our analysis of performance and risk persistence. Measured by fund sequence number, the
table indicates that our sample includes a large range of follow-up funds, some of which are
managed by PE firms that have already raised a large number of other funds before. Comparing
the sample size between the two panels (392 in Panel A versus 288 in Panel B), we can see that
even in Panel A, the average PE firm is quite experienced, since we lose a rather limited number
of observations when restricting the sample of follow-up funds. Panel B indicates that the
average fund in our restricted sample is almost the 6th (exact mean is 5.85) fund of the PE firm
(with median of 4th). Also, 59.19% of the funds in Panel B have a fund sequence number higher
than three.
[Please insert Table 5 about here]
17
In this section, we examine whether there is persistence in fund performance. The first step
enables us to confirm existing findings. In the second step, we investigate whether fund risk
explains the relationship between previous and current fund performance (i.e., performance
persistence).
We examine the performance persistence using PME.3 We measure PME using the approach adopted by Kaplan and Schoar (2005) and Harris, Jenkinson, Kaplan and Stucke (2014),
which compares an investment in a private equity fund with an equivalent investment in the
relevant public stock market index. The PME can be viewed as a market-adjusted multiple of
invested capital. For example, a PME of 1.5 indicates that at the end of the fund s life, investors
ended up with 50% more than they would have obtained if they had invested in the public
market. We use the S&P 500 Index to proxy for the public market for US funds and main
national indices for all non-US funds. In accordance with the literature, we examine
performance persistence for buyout and VC separately.
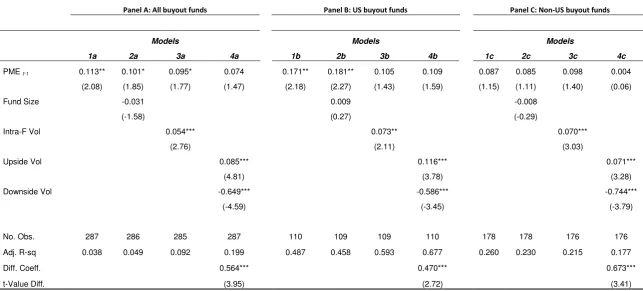
Table 6 shows our multivariate results for buyout funds, based on different subsamples:
all buyout funds (Panel A), US buyout funds (Panel B) and non-US buyout funds (Panel C). Model
1a (Panel A) shows persistence in PME over time, and it is statistically significant at the 5% level.
When we control for fund size (Model 2a), persistence in PME remains significant, though at the
10% level. Given that fund volatility may influence PME, in Models 3a and 4a we examine
whether performance persistence remains significant after controlling for intra-fund volatility,
our measure of risk. Thus, these two regressions directly test our prediction on performance
persistence. As expected, persistence in PME is largely explained by fund volatility. In Model 4a,
3
18
we split the intra-fund volatility into upside and downside volatility. We find that performance
persistence is explained away by both upside and downside volatilities. The PME is positively
related to the upside volatility and negatively related to the downside volatility. The different
sign of coefficients is consistent with the definition of upside and downside volatility used in our
analysis. Performance persistence is therefore related to both fund upside and downside
volatility.
[Please insert Table 6 about here]
To investigate whether PME persistence is specific to the US (and thus connects our
analysis with existing studies that focus on the US), we examine performance persistence for US
funds only (Table 6, Panel B). The results show that PME is persistent for US funds (Model 1b);
this finding holds even when we control for fund size (Model 2b). Nonetheless, performance
persistence is explained away by the intra-fund volatility, as shown in Models 3b. Model 4b
shows that the persistence in PME is again explained away by both upside and downside
volatility. Finally, Panel C shows the results for non-US funds. The results from Models 1c to 4c
show no persistence in the PME in general, but the impact of volatility and the split between
upside and down side volatilities are important determinants of the PME. The effects of upside
and downside volatilities on PME are again statistically significant.
We next investigate performance persistence for VC funds. Typically, VC deals are
smaller than buyout deals, and it is possible that the persistence in PME is restricted to buyout
19
because opportunities arise from technological changes. Thus, expertise may not be as
long-lived as for buyouts, making performance persistence less likely. Table 7 replicates Table 6 but
for VC funds. Panel A shows results for all VC funds, Panel B for US VC funds and Panel C for
non-US VC funds. Similar to buyout funds, the results show that PME is persistent among VC
funds even after we control for fund size (Models 1a and 2a). Furthermore, intra-fund volatility
(Model 3a) and upside or downside volatilities (Model 4a) are related to performance but do
not explain away performance persistence. This finding contrasts with the case of buyout funds
in Table 6. The results of Panel A show that performance is persistent among the VC funds.
Panels B and C indicate that PME is persistent for US VC funds, but not for VC funds located
elsewhere. A reason for this might be the lack of development of VC markets outside the US, so
expertise, an important ingredient of performance persistence (Korteweg and Sorensen, 2014),
is lower. Moreover, intra-fund volatility explains away only a small fraction of performance
persistence. The results remain qualitatively the same when we separate the intra-fund
volatility into upside and downside volatilities. Thus, PME performance is persistent for VC
funds in the US. We find no evidence of PME performance persistence for non-US VC funds,
though the PME is influenced positively by the upside volatility and negatively by the downside
volatility in both subsamples. Overall, the results show that PME performance is persistent for
the VC funds especially the US VC, in contrast with the buyout funds, for which the performance
persistence is explained away by the upside and downside fund volatilities.
20
3.3. Risk Persistence
The findings in Section 3.2 raise follow-up questions about persistence in risk itself. In other
words, if risk helps explain performance and affects the impact of performance persistence, it is
likely that funds exhibit persistence in risk over time. We expect this to hold especially for US
funds, for which performance persistence is strongest. To examine this prediction empirically,
we estimate the same regressions as for performance persistence but now use our risk
measure. Thus, we regress fund volatility (standard deviation of IRRs) on the lag of
intra-fund volatility using the same set of control variables and fixed effects as for performance
persistence.
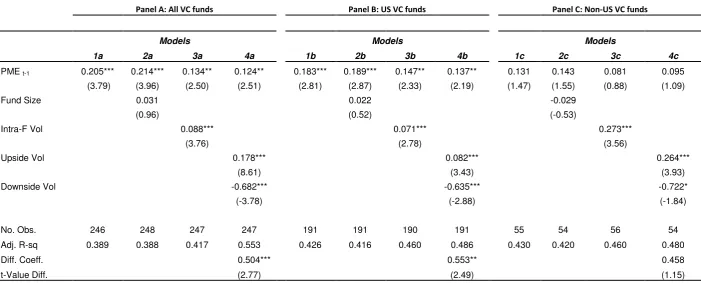
Table 8 reports the results on risk persistence. Panel A shows the results for buyout
funds, and Panel B shows the results for VC funds. For buyout funds (Panel A), we find that risk
is persistent. This result is statistically significant at all conventional levels, even after we control
for fund size (Model 2). In economic terms, we find that an increase of one standard deviation
in intra-fund volatility of a VC fund increases volatility of the next VC fund by 34.2 percentage
units; and 17.7 percentage units for buyout funds. When separating the sample by US and
non-US buyout funds, we find that the risk is persistent for non-US buyout funds (Models 3 and 4) but not
for non-US funds. The lack of significant findings for non-US funds is consistent with the lack of
findings of performance persistence for non-US funds. For VC funds (Panel B), we find similar
results to buyout, as we observe risk persistence, but it is mostly driven by US funds. For non-US
VC funds, we find no risk persistence after controlling for fund size (Model 6). Therefore, fund
size captures the effect of the previous fund's risk. Larger funds also appear to have lower risk
21
Overall, our results show that risk is persistent in buyout and VC funds. Nonetheless, the
persistence in risk is limited to US funds, while non-US funds show persistence only for the VC
funds, which is explained away by fund size. These results suggest that performance persistence
in VC or buyout funds, as documented in the literature, is due to risk persistence.
[Please insert Table 8 about here]
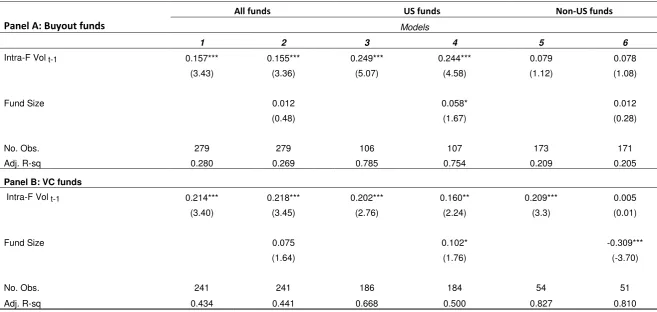
As mentioned previously, risk persistence could be due to upside or downside volatility,
or both. Thus, in Tables 9 and 10 we examine risk persistence in upside and downside intra-fund
volatility separately. In both tables, Panel A shows the results for buyout funds and Panel B for
VC funds. We further separate samples by US and non-US funds. Model 1 of Panel A shows that
downside volatility is persistent for buyout funds after we control for fund size. However, for
the US buyout funds, we do not find evidence of downside volatility, while for non-US funds, the
downside volatility is persistent even after we control for fund size (Models 5 and 6). In Panel B,
we investigate risk persistence for VC funds. Models 1 and 2 show risk persistence in VC funds
for the full sample. In terms of economic significance, we find that an increase of one standard
deviation in downside volatility of a VC fund increases downside volatility of the next VC fund
by 8.8 percentage units; and 6.4 percentage units for buyout funds. However, US funds exhibit
higher persistence in the VC funds than non-US funds (Models 3 and 4 as compared with Models
5 and 6). This difference is consistent with the view that the risk appetite for the US funds is
different between VC and buyout. It is also true that VC funds take on more risk than buyout
22
difference between US and non-US buyout funds suggests that the US market is more
competitive, which may explain the lack of persistence in the first place. Indeed, in a more
competitive market, managers with loss-making funds may not be able to stay in the market in
the first place, so persistence is not observed.
[Please insert Table 9 about here]
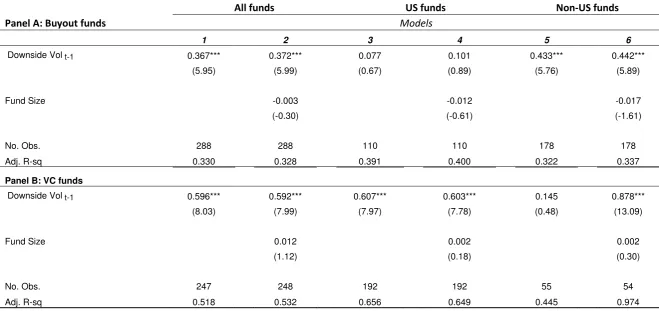
We also examine whether the risk persistence is due to upside volatility. Table 10 reports
the results. Panel A shows that upside volatility is not persistent in buyout investments.
Separating the buyout funds into US and non-US samples, we find that only US funds show
persistence in the upside volatility (Models 3 and 4 as compared with Models 5 and 6). For the
VC funds (Panel B), we find no persistence in the upside volatility for VC funds in the full sample.
However, non-US funds show persistence in the upside volatility (Model 5). In Model 6, we
control for fund size, and the results show that risk persistence in the upside volatility is
explained away by fund size. Thus, fund size drives persistence in the upside volatility for the
non-US VC funds. Overall, these results suggest that there is no persistence in upside risk in any
of the subsamples based on asset class (buyout or VC) or geography, with the sole exception of
US VC funds. As previously, this result may be because the US VC market is more mature and
thus populated by more experienced fund managers who have the skills to select
top-performing companies more often over time.
23
Finally, we use the Sharpe and Sortino ratios as measures of risk-adjusted performance
to explore further performance persistence. The Sharpe ratio is generally defined as the return
earned in excess of the risk-free rate per unit of total risk. In order to calculate the Sharpe ratio
of the funds in our sample, we use the fund IRRs and proxy total risk by using the intra-fund
volatility. The Sortino ratio differs from the Sharpe ratio in that it divides excess returns by the
downside volatility. Hence, we calculate Sortino ratios using our measure of downside volatility.
In general, the Sortino ratio is a more reasonable measure of risk-adjusted performance when
analyzing assets that have highly skewed returns. In Table 11, we examine the persistence of
these two measures for all buyout funds, US funds and non-US funds. Model 1a (Panel A) shows
persistence in the Sharpe ratio for all funds even after we control for fund size (Model 2a).
Models 3a and 3b in Panel A show no evidence of persistence in risk-adjusted performance
using the Sortino ratio. For the US funds (Panel B), we find no evidence of persistence using the
Sharpe ratio; however, we find weak evidence (significant at 10%) of persistence using the
Sortino ratio. For the non-US funds, we find strong evidence of persistence using the Sharpe
ratio but again no evidence using the Sortino ratio (Panel C). The Sharpe ratio exhibits
persistence because of the non-US funds, while the US funds do not exhibit any persistence
based on the Sharpe or Sortino ratio.
24
Table 12 reports persistence results for the VC funds again using the Sharpe and Sortino
ratios. Panel A shows the results for all VC funds, Panel B shows the results for the US funds and
Panel C shows the results for non-US funds. Models 1a and 2a in Panel A show the results of the
Sharpe ratio, and Models 3a and 4a show the results of the Sortino ratio. For all funds, we find
no evidence of persistence using either the Sharpe or Sortino ratio. Panel B shows the results for
the US funds and clearly indicates that the Sortino ratio exhibits significant persistence, even
after we control for fund size (Models 3b and 4b). Nonetheless, there is no evidence of
persistence using the Sharpe ratio. For non-US VC funds, we find weak evidence of persistence
using the Sortino ratio but not the Sharpe ratio.
[Please insert Table 12 about here]
3.4. Is Performance Driven by Outperformers or Cost Minimization?
In this section, we investigate which type of risk helps explain outperformance, that is, whether
performance is driven by picking outperformers (higher upside volatility) or minimizing losses
(lower downside volatility). To do so, we focus on the IRR as a measure of performance. The IRR
is the most appropriate measure here because we want to measure absolute returns, not
risk-adjusted returns as done with PME.
In Table 13, we first examine the relationship between IRR and risk as measured by
intra-fund volatility and then show the results for alternative measures of risk: skewness, downside
volatility and upside volatility. These three measures help test for the direction of the
25
(separately for buyout and VC), US funds and non-US funds. For the full sample, we find that the
IRR is positively related to intra-fund volatility (Model 1 for buyout and Model 4 for VC). The
coefficients are significant at the 1% level. In Models 2 and 5, we control for skewness and find
that the results on volatility remain.
[Please insert Table 13 about here]
However, these results reveal that intra-fund volatility is not always a good proxy for
fund risk. For example, for the US buyout funds, the coefficient on intra-fund volatility turns out
to be non-significant. This is most likely because private equity returns tend to deviate
significantly from a normal distribution, in which case the volatility does not adequately
represent risk. Therefore, we also split the intra-fund volatility into downside and upside
volatility in the regressions (see Models 3 and 6). As expected, we find that the IRR is negatively
related to downside and positively related to upside volatility. The regression coefficients are
highly significant (mostly at the 1% level), regardless of the sample and asset class, with the
exception of non-US VC funds. It is worthwhile here to compare the absolute values of the
coefficients to separate the effect of out- and underperforming investments on the fund IRR.
The results show that in absolute terms, the coefficients for the downside volatility are much
larger than the coefficients for the upside volatility. The impact of downside volatility is 7.3
times larger than upside volatility for buyout funds, and 1.5 times larger for VC funds. These
differences in coefficients are highly significant, except for the non-US VC funds. That is, fund
26
choosing outperforming investments. This finding holds for both the buyout and the VC funds.
However, in line with expectations, selecting outperforming deals typically has a stronger effect
on the performance of VC funds than for buyout funds, as indicated by the larger coefficients on
the upside volatility for all funds and US VC funds only.
3.5. Impact of Legal Factors and Fund Management Characteristics
In this section, we consider alternative factors that might affect performance and risk
persistence. First, we examine the impact of legal factors. Cumming, Dai, Hass, and Schweizer
(2012) show that legal conditions affect performance persistence in the hedge fund industry.
Similar effects may occur in private equity. Better investor and creditor protection may increase
performance of investors and thereby also private equity funds. Further, Cumming and Knill
-director rights have
positive impact on VC performance. A recent study by Cao, Cumming, Qian and Wang (2015)
find that strong creditor rights influence LBO investments. Since legal conditions influence
performance, they could also impact performance persistence. In order to examine the impact
of legal conditions, we use a number of country characteristics similar to the previous studies
and that we match with the country of the PE fund. First, we collect information of the legal
origin of the fund's country. We construct a dummy variable to capture English legal origin.
Second, we use more precise measures of investor and creditor rights commonly used in the
"law and finance" literature (following La Porta, Lopez-de-Silanes, Shleifer and Vishny, 1998),
including in the studies cited above. These are the Anti-director Rights, Creditor Rights, Public
27
Proof. All these variables are defined in Table 14 and taken from La Porta, Lopez-de-Silanes,
Shleifer and Vishny (1998) and La Porta, Lopez-de-Silanes and Shleifer (2006).
[Please insert Table 14 about here]
Our results show that country characteristics do not fully explain performance
persistence in buyout investments as shown in Panel A of Table 14 (Models 1 to 4). None of the
variables is statistically significant at the commonly used 5% level, while the result on
performance persistence (the variable PMEt-1) still holds. In Models 5 to 8, we further include
risk measures (upside and downside volatility) as additional control variables. The results
indicate that risk continues to explain performance persistence in buyout funds and not legal
conditions. Panel B shows results of the same specifications but for the subsample of VC funds.
We conclude similarly. Therefore, our conclusions on the impact of risk on performance
persistence are robust to the inclusion of controls for legal conditions in the country of the fund.
Second, we examine whether performance and risk persistence is driven by managerial
style and other fund-specific characteristics (see Cumming, Siegel and Wright, 2007, for an
overview of the literature on factors affecting the risk profile of funds). Cumming and Dai (2010)
show that the propensity to syndicate, to stage, and to sit on boards, and the distance between
investee and investor are critical factors to explain VC investments. Cumming and Dai (2011)
further document that fund size affects performance and risk of private equity funds. Cao,
Cumming, Qian and Wang (2015) find that whether investors are domestic or international
28
interest in taking risk. All these characteristics could influence the risk profile of VC or buyout
funds and thereby performance and risk persistence. It may further control for changes in the
composition of the managerial team over time, since such changes may also lead to changes in
managerial styles. It is also documented in the literature that experienced PE firms tend to
invest more in early stage rounds than less experienced ones. This investment behavior reflects
their willingness to take more risk and hence might impact performance and risk persistence. To
control for the impact of these different factors on persistence, we use different fund-level
measures of PE firm experience, the propensity to do cross-border deals, to sit on boards, to
syndicate and to stage investments. The results are provided in Table 15, where these additional
variables are also defined.4
[Please insert Table 15 about here]
Models 1 to 3 of Table 15 show the results for the subsample of buyout funds, while Models 4
to 6 for the subsample of VC funds. Again, we find that fund risk dominates in explaining
performance persistence. In contrast, firm characteristics have no significant impact on risk
persistence of buyout (Models 1 to 3 and VC (Models 4 to 6) funds. These results indicate
robustness of our previous conclusions on the importance of fund risk in explaining persistence.
4
29
3.6. Additional Tests
We performed several robustness checks and additional tests that are not reported in any table.
Our main finding on persistence in risk is also confirmed when treating Loss Rate (as defined in
Section 2.3) as a measure of fund risk. Fund managers who have achieved a low loss rate in one
fund will also largely have a lower loss rate in the next fund.
Other tests performed pertain to the question whether the relationship we find is due to
other underlying relationships for which we did not control. For example, the relationship may
be due to the strong specialization in private equity, especially in VC, in specific stages of
development. That is, the consistently high loss rate across funds of a same manager could be
due to this manager raising only early-stage funds, which tend to be riskier that other funds.
However, adding dummies for stage focus of funds to the specification does not eliminate our
result on risk persistence, nor does adding dummies for industry and regional focus of funds.
These extra robustness checks confirm that risk persistence also holds within usual risk
classifications (e.g., stage of development, geography, industry) of private equity funds. In this
case, the underlying rationale for the persistence in risk could be due to the strong
specialization need among fund managers.
Further, we examine the possible impact of differences in industries (such as high-tech
versus non-high-tech), differences in vintage years and the effect of outliers. To examine the
effect of industries on performance persistence, we include a dummy variable that equals one if
the fund's industry focus is high-tech and 0 otherwise. Our definition of hi-tech industries is
similar to Cumming and Dai (2010).5 Our results are robust to the inclusion of this additional
5
30
control variable and high-tech industries do not explain the performance persistence in PE.
Next, we consider the effects of different vintage years by examining the post-1999 subsample
only. Our choice of using the post-1999 period is motivated by study of Harris, Jenkinson, Kaplan
and Stucke (2014), who takes a similar approach. They find only weak evidence of performance
persistence post-2000 for buyout investments, while persistence for VC funds remain the same
between pre- and post-2000. Our results for the VC funds are consistent with their findings.
However, for the buyout investments, we find performance persistence also post-1999. Possibly
this difference is because our sample includes both US and non-US funds, while their sample
only considers US funds. Overall, our subsample analysis indicates our conclusions hold across a
long time period for buyout and VC funds. Further, we winsorize the returns at the 1% and 5%
levels to test the effect of outliers. We find that our results are robust controlling for the
outliers.
Finally, we examine the possible impact of survivorship bias. Indeed, our sample is restricted to
PE firms that have raised multiple funds, since persistence can only be tested for subsequent
funds. Other PE firms may have failed to do so (most likely due to poor performance) and hence
our results might be subject to survivorship bias. To address this concern, we use a two-stage
Heckman estimation model for buyout and VC funds separately. In the first stage, we estimate
the probability of raising a subsequent fund. In the second stage, we then estimate the
performance persistence based on our restricted sample as done so far but include the Inverse
Mills' Ratio as additional control variable. We find no evidence that survivorship bias impacts
31
4. CONCLUSION
This study examines the impact of fund-level risk on performance persistence as well as risk
persistence in private equity. Consistent with Kaplan and Schoar (2005), we find that returns are
persistent for VC and buyout funds for US funds. We further extend the analysis by providing
evidence for non-US funds, for which persistence tends to be weaker. Our study extends the
results of Kaplan and Schoar and related studies, by showing that risk as measured by the
standard deviation of IRR is persistent for VC and buyout funds regardless of whether these
funds are based in the US or outside the US. We interpret these results of performance
persistence in private equity to be due largely to persistence in risk. In other words, private
equity funds tend to invest persistently in deals with similar risk-return levels, which in turn
leads to persistence in both risk and return.
We believe our conclusions can be extended to other types of financial intermediaries, in
particular to hedge funds for which Cumming, Dai, Hass, and Schweizer (2012) has also
documented performance persistence. These authors have shown that regulation may affect
the extent of performance persistence, while our study indicates that such persistence may also
be related to persistence in risk. Unlike other studies, our data allow us to directly control for
fund risk. Since the economic arguments proposed in our study are not specific to private
equity, fund risk is likely to be a driver of persistence also in other fund industries where
performance persistence can be observed.
Our analysis has some limitations, which also offer opportunities for future research if
32
management firm may change over time. Such changes in the composition of the managerial
team may affect performance persistence if the latter is attributed to specific, non-transferable
expertise of managers. Tracking changes in the composition of managerial teams may offer
further insights into what drives performance and risk persistence. Similarly, persistence may be
stronger in certain industries for which specific expertise may be more important than in other
industries. Along similar vein, persistence may be lost if investments are made in other
industries, which may happen when investment opportunities shift to new industries over time.
Finally, performance and risk persistence may evolve over time, notably during bubble years in
33
REFERENCES
Ang, A., J. Chen and Y. Xing (2006), "Downside Risk", Review of Financial Studies 19, 1191-1239.
Braun, R., T. Jenkinson and I. Stoff (2013), "How Persistent is Private Equity Performance?
Evidence from Deal-level Data", working paper. Available on SSRN:
http://ssrn.com/abstract=2314400.
Cao, J.X., D. Cumming, M. Qian and X. Wang (2015), "Cross-border LBOs", Journal of Banking
and Finance 50, 69-80.
Cumming, D., and N D L J E
Finance 17, 362-380.
Cumming, D., N. Dai, L.H. Hass and D. Schweizer (2012), "Regulatory Induced Performance
Persistence: Evidence from Hedge Funds", Journal of Corporate Finance 18, 1005-1022.
Cumming, D. and A. Knill (2012), "Disclosure, Venture Capital and Entrepreneurial Spawning",
Journal of International Business Studies 43, 563-590.
Cumming, D., D. Schmidt and U. Walz (2010), "Legality and Venture Capital Governance Around
of World", Journal of Business Venturing 25, 54-72.
Cumming, D., and U. Walz (2010), "Private Equity Returns and Disclosure Around of World",
Journal of International Business Studies 41, 727-754.
Ewens, M., C.M. Jones and M. Rhodes-Kropf (2013), "The Price of Diversifiable Risk in Venture
Capital and Private Equity", Review of Financial Studies 26 (8), 1854-1889.
Franzoni, F., E. Nowak and L. Phalippou (2012), "Private Equity Performance and Liquidity Risk",
34
Harris, R.S., T. Jenkinson and S.N. Kaplan (2014), "Private Equity Performance: What Do We
Know?" Journal of Finance 69 (5), 1851-1882.
Harris, R.S., T. Jenkinson, S.N. Kaplan and R. Stucke (2014), "Has Persistence Persisted in Private
Equity? Evidence from Buyout and Venture Capital Funds", Darden Business School Working
Paper No. 2304808.
Kaplan, S.N., and A. Schoar (2005), "Private Equity Returns: Persistence and Capital Flows",
Journal of Finance 60, 1791-1823.
Korteweg, A.G., and S. Nagel (2015), "Risk-adjusting the Returns to Venture Capital",
forthcoming, Journal of Finance.
Korteweg, A.G., and M. Sorensen (2014), "Skill and Luck in Private Equity Performance", Rock
Center for Corporate Governance Working Paper Series No. 179.
Krohmer, P., R. Lauterbach and V. Calanog (2009), "The Bright and Dark Side of Staging:
Investment Performance and the Varying Motivations of Private Equity Firms", Journal of
Banking and Finance 3(9), 1597-1609.
La Porta, R., F. Lopez-de-Silanes, A. Shleifer and R. Vishny (1998), " Law and Finance", Journal of
Political Economy 106(6), 1113-1155.
La Porta, R., F. Lopez-de-S A S W W S L
Journal of Finance 61(1), 1-32.
Markowitz, H. (1991), "Portfolio Selection: Efficient Diversification of Investments", 2nd ed.,
Cambridge, MA, Basil Blackwell.
Marquez, R., V.K. Nanda and M.D. Yavuz (2014), "Private Equity Fund Returns and Performance
35
Phalippou, L., and O. Gottschalg (2009), "The Performance of Private Equity Funds", Review of
Financial Studies 22, 1747-1776.
Sorensen, M., and R. Jagannathan (2015), "The Public Market Equivalent and Private Equity
36
Figure 1: VC and buyout funds by vintage year
This figure shows the number of buyout and VC funds in our sample by vintage year from 1980 to 2008.
0 10 20 30 40 50 60 70 80 90 100 110 120 130
1980 1982 1984 1986 1988 1990 1992 1994 1996 1998 2000 2002 2004 2006 2008
N
o
o
f
F
u
n
d
s
Vintage Year
37
Table 1: Sample distribution of VC and buyout investments
This table shows the distribution of VC and buyout investments by investment year. The buyout and VC deals are divided into deals made by US and non-US funds. The table also indicates the number of these deals that are realized (i.e., exited). At the end, the table shows the total number of deals as well as the subsample of deals in the 1980s, 1990s and 2000s, respectively.
Buyout investments VC investments
Full sample US Non-US Full sample US Non-US
Investment year All deals Realized Deals All deals Realized deals All deals Realized deals All Deals Realized deals
1980 1 0 0 1 1 0 0 0 0 0
1981 5 0 0 5 5 8 8 7 0 0
1982 2 0 0 2 1 18 18 14 0 0
1983 5 1 1 4 4 19 19 16 0 0
1984 10 8 6 2 1 32 32 27 0 0
1985 17 12 9 5 5 48 48 47 0 0
1986 25 22 16 3 3 70 64 59 6 5
1987 56 28 23 28 24 73 51 44 22 19
1988 72 48 44 24 24 97 83 76 14 14
1989 97 73 72 24 24 130 122 118 8 7
1990 173 94 90 79 73 125 97 94 28 25
1991 178 85 83 93 89 143 95 79 48 43
1992 177 91 86 86 82 153 126 123 27 24
1993 182 106 101 76 70 219 154 142 65 60
1994 294 141 131 153 135 256 187 168 69 56
1995 271 113 97 158 141 314 236 212 78 64
1996 326 136 117 190 161 475 332 289 143 95
1997 400 144 111 256 208 584 440 354 144 92
1998 447 172 112 275 169 804 616 471 188 128
1999 539 192 117 347 218 1241 951 648 290 192
2000 702 249 132 453 244 1817 1253 715 564 292
2001 344 97 55 247 126 925 652 288 273 119
2002 366 113 46 253 132 680 514 177 166 46
2003 341 132 45 209 87 693 548 176 145 40
2004 385 155 36 230 53 773 603 138 170 41
2005 432 166 38 266 44 640 455 63 185 38
2006 438 156 7 282 25 614 467 35 147 6
2007 320 119 1 201 3 399 310 12 89 3
2008 91 38 1 53 0 178 152 2 26 1
2009 6 0 0 6 0 26 3 0 23 1
Total 6702 2691 1577 4011 2152 11554 8636 4594 2918 1411
1980s 290 192 171 98 92 495 445 408 50 45
1990s 2987 1274 1045 1713 1346 4314 3234 2580 1080 779
38
Table 2: Summary statistics of different risk measures of funds
This table shows the mean and median values for Loss Rate, Intra-Fund Volatility of IRRs, Intra-Fund Downside and Upside Volatility of IRRs and Intra-Fund Skewness of IRRs, based on deal-level cash flow data. The table shows the statistics for the full sample, buyout and VC deals and for all quartiles, first quartile and fourth quartile, respectively.
All quartiles First quartiles Fourth quartiles
Full
sample Buyout VC
Full
sample Buyout VC
Full
sample Buyout VC Loss Rate
Mean 8.46% 6.06% 14.82% 11.97% 8.57% 16.61% 9.04% 4.59% 16.33% Median 3.85% 0.00% 13.04% 7.02% 0.00% 14.73% 4.55% 0.00% 15.00%
Intra-Fund Volatility of IRRs
Mean 101.22% 92.20% 123.10% 60.94% 46.32% 78.46% 174.62% 144.47% 214.23% Median 58.18% 57.99% 69.76% 44.82% 42.29% 50.42% 107.81% 82.13% 150.58%
Intra-Fund Downside Volatility of IRRs
Mean 27.50% 22.38% 40.21% 35.72% 29.17% 44.01% 25.66% 14.79% 41.04% Median 27.96% 23.21% 43.25% 39.12% 31.99% 47.66% 25.87% 3.39% 44.95%
Intra-Fund Upside Volatility of IRRs
Mean 97.21% 94.00% 111.15% 43.59% 30.33% 57.58% 186.69% 167.17% 213.48% Median 50.18% 56.10% 55.49% 19.22% 17.38% 21.47% 114.28% 96.67% 145.98%
Intra-Fund Skewness of IRRs
Mean 1.12 0.89 1.62 0.59 0.48 1.07 1.75 0.96 1.95
39
Table 3: Summary statistics on deal-level performance
This table shows the mean and median IRR, investment multiple and PME based on the full sample of fully realized deals. The table shows IRR investment multiple and PME statistics by investment year and by buyout and VC subsamples. IRR, multiples and PME are gross of fees and carried interest payments.
Buyout VC
Investment year
IRR Multiple PME IRR Multiple PME
No.
deals Mean Median Mean Median Mean Median No.
Deals Mean Median Mean Median Mean Median
1980 1 0.044 0.044 1.384 1.384 0.380 0.380 — — — — — — —
1981 5 0.194 0.092 7.474 1.958 2.422 0.670 7 -0.167 -0.545 1.510 0.135 0.933 0.070
1982 1 -0.212 -0.212 0.171 0.171 0.040 0.040 14 0.262 0.256 8.497 3.414 3.284 1.320
1983 5 0.152 0.056 2.358 1.558 1.132 0.490 16 -0.346 -0.640 3.365 0.049 1.479 0.025
1984 7 0.794 0.471 9.303 9.506 4.359 3.330 27 0.042 -0.030 3.334 0.782 1.545 0.180
1985 14 0.248 0.304 4.487 2.797 2.181 1.400 47 -0.161 0.016 2.402 1.166 0.990 0.580
1986 19 0.303 0.250 3.142 2.839 1.953 1.820 64 0.061 0.091 3.332 1.700 1.762 0.795
1987 47 0.029 0.066 2.741 1.413 1.711 0.660 63 0.003 0.073 2.465 1.272 1.487 0.800
1988 68 0.045 0.104 2.169 1.723 1.178 0.800 90 -0.067 0.004 3.279 1.022 1.659 0.570
1989 96 0.001 0.144 2.410 1.620 1.442 1.070 125 0.130 0.099 3.016 1.682 1.767 0.790
1990 163 0.197 0.171 2.946 2.000 1.727 1.060 119 0.093 0.101 2.609 1.655 1.552 0.930
1991 172 0.349 0.343 3.313 2.551 1.993 1.515 122 0.055 0.124 2.631 1.432 1.505 0.855
1992 168 0.369 0.268 3.138 2.133 1.867 1.445 147 0.273 0.130 4.174 1.652 2.489 0.920
1993 171 0.563 0.424 5.048 3.025 2.716 1.780 202 0.209 0.108 3.542 1.597 1.876 0.770
1994 266 0.320 0.300 3.128 2.338 1.474 1.130 224 0.225 0.101 4.122 1.404 2.094 0.680
1995 238 0.300 0.237 2.741 1.866 1.467 0.980 276 0.385 0.214 3.922 1.650 2.068 0.880
1996 278 0.208 0.163 2.825 1.694 1.540 1.020 384 0.387 0.108 4.436 1.391 2.527 0.845
1997 319 0.159 0.185 2.577 1.785 1.815 1.260 446 0.359 0.040 4.122 1.128 2.901 0.820
1998 281 0.052 0.123 2.128 1.608 1.857 1.330 599 1.166 -0.026 5.115 0.946 4.217 0.750
1999 335 -0.056 0.056 1.624 1.252 1.783 1.230 840 0.714 -0.451 2.092 0.205 2.117 0.225
2000 376 -0.138 -0.005 1.549 0.990 1.818 1.075 1007 -0.384 -0.611 0.646 0.067 0.688 0.080
2001 181 0.123 0.223 2.265 1.907 2.121 1.770 407 -0.368 -0.448 1.043 0.170 0.923 0.130
2002 178 0.358 0.393 3.189 2.390 2.317 1.795 223 0.105 -0.299 1.627 0.440 1.301 0.340
2003 132 0.565 0.569 3.020 2.731 2.241 2.005 216 0.015 -0.122 2.018 0.759 1.501 0.570
2004 89 0.512 0.590 2.680 2.633 2.174 2.110 179 0.202 -0.045 2.220 0.927 1.864 0.730
2005 82 0.447 0.551 2.141 1.808 1.879 1.475 101 0.010 -0.131 1.283 0.762 1.127 0.660
2006 32 0.564 0.677 2.032 2.025 1.803 1.835 41 0.263 -0.941 1.387 0.004 1.268 0.000
2007 4 -0.714 -0.999 0.310 0.023 0.535 0.025 15 0.929 -0.962 1.213 0.059 1.220 0.060
2008 1 -1.000 -1.000 0.000 0.000 0.000 0.000 3 -0.639 -1.000 0.347 0.000 0.377 0.000
Total 3729 0.198 0.205 2.644 1.874 1.842 1.310 6004 0.236 -0.137 2.703 0.574 1.942 0.440
1980s 263 0.079 0.135 2.836 1.732 1.579 0.930 453 0.011 0.063 3.150 1.284 1.636 0.660
1990s 2391 0.214 0.199 2.791 1.892 1.786 1.210 3359 0.555 0.003 3.671 1.015 2.597 0.690