This is a repository copy of Identifying Knowledge Anchors in a Data Graph.
White Rose Research Online URL for this paper:
http://eprints.whiterose.ac.uk/102856/
Version: Accepted Version
Proceedings Paper:
Al-Tawil, M, Dimitrova, VG, Thakker, D et al. (1 more author) (2016) Identifying Knowledge
Anchors in a Data Graph. In: Proceedings of the 27th ACM Conference on Hypertext and
Social Media. 27th ACM Conference on Hypertext and Social Media, 10-13 Jul 2016,
Halifax, Canada. ACM , pp. 189-194. ISBN 978-1-4503-4247-6
https://doi.org/10.1145/2914586.2914637
© 2016 ACM. This is an author produced version of a paper published in Proceedings of
the 27th ACM Conference on Hypertext and Social Media.
[email protected]
https://eprints.whiterose.ac.uk/
Reuse
Unless indicated otherwise, fulltext items are protected by copyright with all rights reserved. The copyright
exception in section 29 of the Copyright, Designs and Patents Act 1988 allows the making of a single copy
solely for the purpose of non-commercial research or private study within the limits of fair dealing. The
publisher or other rights-holder may allow further reproduction and re-use of this version - refer to the White
Rose Research Online record for this item. Where records identify the publisher as the copyright holder,
users can verify any specific terms of use on the publisher’s website.
Takedown
If you consider content in White Rose Research Online to be in breach of UK law, please notify us by
Identifying Knowledge Anchors
in a Data Graph
Marwan Al-Tawil
1, Vania Dimitrova
1, Dhavalkumar Thakker
2, Brandon Bennett
11
School of Computing, University of Leeds, UK
2
School of Electrical Engineering and Computer Science, University of Bradford, UK
{scmata
1, V.G.Dimitrova
1, B.Bennett
1}@leeds.ac.uk , D.Thakker
2@bradford.ac.uk
ABSTRACT
The recent growth of the Web of Data has brought to the fore the need to develop intelligent means to support user exploration through big data graphs. To be effective, approaches for data graph exploration should take into account the utility from a user’s point of view. We have been investigating knowledge utility – how useful the trajectories in a data graph are for expanding users’ knowledge. Following the theory for meaningful learning, according to which new knowledge is developed starting from familiar entities (anchors) and expanding to new and unfamiliar entities, we propose here an approach to identify knowledge anchors in a data graph. Our approach is underpinned by the Cognitive Science notion of basic level objects in domain taxonomies. Several metrics for extracting knowledge anchors in a data graph, and the corresponding algorithms, are presented. The metrics performance is examined, and a hybridization approach that combines the strengths of each metric is proposed.
Keywords
Data graphs; exploratory search; knowledge utility; basic level objects.
1.
INTRODUCTION
Data graphs (in the form of RDF Linked Data) have become widely available on the Web and are being used in a myriad of applications [1, 2, 17]. Gradually, data graphs are also being exposed to users, taking advantage of the exploration of the rich knowledge encoded in the graph. In many cases, users exploring data graphs will have no (or limited) familiarity with the specific domain and little (or no) awareness of the encoded knowledge in the graph. In other words, the users’ cognitive structures about the domain may not match the semantic structure of the data graph. This can hinder graph exploration, as the users may not be able to identify which paths are most useful, leading to confusion, high cognitive load, and frustration.
Our research deals with supporting navigation in data graphs through intelligent nudging, directing people to trajectories with high utility. Specifically, we consider knowledge utility – how useful a trajectory in a graph is to expand one’s knowledge in the domain. Our earlier research has shown that while exploring data graphs in unfamiliar (or partially familiar) domains, users serendipitously learn new things [5, 15]. To make the
serendipitous learning ‘morelikely’, we seek to identify ‘good’ trajectories which are helpful for expanding one’s knowledge.
It is critical to identify anchoring entities in the data graph that serve as knowledge bridges to learn new concepts. Such anchors can also be used to facilitate adaptation and personalization [29]. Our earlier observations, in a controlled user study investigating nudging strategies for exploration [15], have suggested that paths which start with familiar and highly inclusive entities and bring something new are likely to have good knowledge utility. This directed us to adopt the subsumption theory for meaningful learning [6], where familiar and inclusive entities are used as knowledge anchors to subsume new knowledge into users’ cognitive structure. Hence, the key challenge is:
How to develop automatic ways to identify data graph entities that provide knowledge anchors for navigation paths.
We utilize the Cognitive Science notion of basic level objects1
[7], to develop algorithms for identifying knowledge anchors in a data graph (KADG). These anchors will refer to the most inclusive categories at which objects are easily identified; and hence can provide good anchors for knowledge exploration. We will present two groups of metrics for identifying KADG together with algorithms for applying these metrics:
distinctiveness metrics which identify differentiated categories whose attributes are shared amongst the category members and not associated to members of other categories; and
homogeneity metrics which identify basic categories whose members share many attributes together.
The main contribution of the research presented in this paper is: Formal description and implementation of metrics and the
corresponding algorithms for identifying KADG.
Analysis of the performance of the algorithms using a benchmarking set of knowledge anchors identified by humans.
2.
RELATED WORK
The growth of data graphs, including Linked Data, has opened a new avenue of research in developing computational models to facilitate data exploration by layman users. One of the key challenges in supporting exploration over data graphs is ensuring that the interaction brings some benefit (utility) for the user [12, 19]. Our work focuses on knowledge expansion.
Earlier research on exploration through data graphs examines different ways to provide intelligent support for users’ navigation. Personalized exploration based on user interests has been presented in [23]. Extracting semantic patterns from linked data sources to improve diversity in recommendation results to users has been proposed in [18, 24]. The concept of utility of statement has been presented in [13] to rank RDF statements. A related strand of research focuses on improving search efficiency by considering user interests [8, 9, 17] or diversifying user's exploration paths with recommendations based on the navigation history [10]. There is also a wealth of research in developing semantic data browsers, that lay out exploration paths using relationships in the underpinning ontologies [3, 4, 21, 34]. A survey of semantic data browsers is provided in [12].
We add to this research stream by opening a new avenue with the introduction of the concept of ‘knowledge utility’ of exploration paths. Our work has broad implication for maximizing the learning effect for the users navigating through data graphs that often come from heterogeneous sources. We follow the subsumption theory for meaningful learning [6], according to which to incorporate new knowledge, the most familiar and inclusive entities in the user’s cognition can be used as knowledge anchors for introducing new knowledge. Anchors in data graphs are similar to notion of basic level objects in domain taxonomies. It states that category objects in a taxonomy are structured such that there is a level of abstraction at which most basic level categories selections are made. We operationalize this notion for automating the search for knowledge anchors in data graphs. The technical approaches that are most relevant to the research presented in this paper refer to the adoption of basic level objects in ontology summarization [11, 24, 27] and in Formal Concept Analysis (FCA) [14, 25, and 26]. Ontology summarization has been seen as an important technology to help ontology engineers quickly make sense of an ontology, in order to understand, reuse and build new ontologies [28]. Measures for ranking and re-ranking using centrality, distance, similarity and coherence have been used to generate good explanations. The notion of relevance has been used in [27] to produce graph summaries. The closest work to the context in this paper is the summarization approach presented in [11], which highlighted the value of cognitive science (natural categories) for identifying key concepts in an ontology to aid ontology engineers to better understand the ontology and quickly judge it suitability.
Formal Concept Analysis is a method for analysis of object-attribute data tables [14]. The psychological approaches to basic level objects have been formally defined for selecting important formal concepts in a concept lattice by considering the cohesion of a formal concept [25]. More recently, the work in [26] has reviewed and formalized the main existing psychological approaches to basic level concepts. The approaches utilized the validity of formal concepts to produce informative concepts capable of reducing the user’s overload.
These works on ontology summarization and FCA utilize basic level objects with the aim of identifying key concepts in an ontology to help experts to examine and reengineer the ontology. In our work, we apply the notion of basic level objects in a data graph to identify concepts which are likely to be familiar to users who are not domain experts. Further, we are unique in our use for these concepts to support users’ exploration in order to expand her domain knowledge. This brings forth various research challenges,
including: dealing with larger number of entities, from 100s of entities in a typical ontology versus millions of entities in a typical data graph, and the need to exploit large number of data instances available in the data graphs compared to schematic ontologies. Our work is the first of its kind in utilizing Rosch’s seminal cognitive science work [7] in the context of data exploration of data graphs. The formal framework that maps Rosch’s definition of basic level objects and cue validity to data graphs is the key contribution of the work presented in this paper.
3.
BASIC LEVEL OBJECTS IN
COGNITIVE SCIENCE
The notion of basic level objects was introduced in Cognitive Science research illustrating that domain taxonomies include category objects which are at the basic level of abstraction [7, 20]. These category objects are commonly used in our daily life and people are usually able to recognize them quickly. For example, considering the Music domain, most people are likely to recognize objects in the category Guitar (basic level). However, layman users who are not experts in the music domain are unlikely to be able to recognize objects from the category
Resonator Guitar (subordinate level) and may consider
such objects as equivalent to their parent Guitar (closest basic level) rather than String Instrument (superordinate level). Basic level categories “carry the most information, possess the highest category cue validity, and are, thus, the most differentiated from one another” [7]. Crucial for identifying basic level categories is calculating cue validity: “the validity of a given cue x as a predictor of a given category y (the conditional probability of y/x) increases as the frequency with which cue x is associated with category y increases and decreases as the frequency with which cue x is associated with categories other than y increases” [7]. Consequently, to identify basic level categories in a domain taxonomy, we will explore two avenues:
Distinctiveness (highest cue validity) identifies most differentiated category objects. A differentiated category object has most (or all) of its cues (i.e. attributes) linked to the category members (i.e. subclasses) only, and not linked to other category objects in the taxonomy. Each entity that is linked through a relationship to members of the category will have a single validity value used as a predictor of the distinctiveness of the category object. The aggregation of all validity values will indicate the distinctiveness of the category object.
Homogeneity (highest commonality between category members) identifies category objects whose members have high similarity values. The higher the similarity between category members, the more likely it is that the category object is at the basic level of abstraction. This is complementary to the distinctiveness feature. A category object with high cue validity will usually have high number of entities common to its members.
4.
ALGORITHMS FOR IDENTIFYING
KNOWLEDGE ANCHORS
4.1
Preliminaries
Subject and Predicate denote entities in the graph. An Object is either a URI or a string. Each Predicate URI denotes a directed attribute which has a Subject as a source and an Object as a target. Formally, we define a data graph as:
Definition 1 [Data graph] A Data Graph DG is a labeled directed graph DGV,E,P, depicting a set of RDF triples where: - V{v1,v2,...,vn}is a finite set of vertices.
- E{e1,e2,...,em}is a finite set of edge types, where
1
e = rdfs:subClassOf is the subsumption relationship, and
m
e
e2,..., can correspond to any other semantic relationships. - P{p1,p2,...,pk} where each
i
p is a proposition in the form of a triple vs,ei,vo with vs,voV, where vs is the Subject
(source) andvois the Object(target); andeiE is the edge type.
Using the subsumption relationship rdfs:subClassOf and following its transitivity, for each entity vV we can derive the entitiesvthat are subclasses of v, we denote this as vv. The entities set
V
in the data graph is divided into the following:Category entities: C V is the set of all entities that have at least one subclass and at least one superclass, other than the abstract domain entity d which is the superclass for all entities.
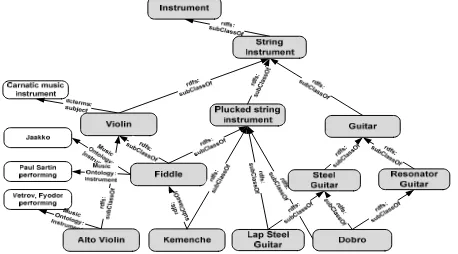
[image:4.612.58.287.358.485.2]Leaf entities: LV is a set of entities that have no subclasses. Figure 1 shows entities extracted from a data graph in the Music domain starting from the abstract domain entity Instrument.
Figure 1. Extract from the MusicPinta data graph [5] showing category and leaf entities (in shaded shapes) and relationships. Hierarchical relationships are subsumption rdfs:subClassOf
and dcterms:subject that links an entity to its DBpedia category. MusicOntology:instrument a the domain-specific relationship that links a musical instrument to a performance.
Definition 2 [Normal Graph] Anormal graph is a data graph where no entity is both a category entity and a leaf entity (in other words, every category entity has at least one subclass). We assume that we are always dealing with normal graphs. Our algorithms may not give sensible results for non-normal graphs.
Definition 3 [Hierarchical relationships EH] Hierarchical relationships are the edge types {e1,e2,..}EH of the data graph that denote category membership between the Subject and
Object entities in the corresponding triples.
E
H always includes the subsumption relationship rdfs:subclassOf but may also contain other relationships showing membership inclusion (e.g.,dcterms:subject as shown in Figure 1).
Definition 4 [Domain-specific relationships
E
D] Domain specific relationships are the edge types other than the hierarchical relationships, i.e.D H
E
E
E
(e.g., Figure 1 shows the relationship MusicOntology:instrument).4.2
Algorithms for Identifying KADG
Any entity vV in a data graph DG, except the abstract domain entity d and the set of leaf entities L, i.e.
v
{
C
}
, could potentiallybe identified as a knowledge anchor in DG. The set of all knowledge anchors in DG is denoted as KADG. We follow thedistinctiveness and homogeneity approaches described in Section 3 to define metrics and corresponding algorithms for discovering
KADG in a given data graph DG. The definitions follow the formal
concept analysis approach in [26], and adapt the suggested metrics in the context of finding knowledge anchors in a data graph. In addition, we describe algorithms for identifying KADG.
4.2.1
Distinctiveness Metrics
This group of algorithms aims to identify the most differentiated basic categories whose attributes are shared amongst the category members but are not associated to members of other categories.
Attribute Validity (AV)
The attribute validity definition here corresponds to the cue validity definition in [7] and adapts the formula from [26]. We use ‘attribute validity’ to indicate the association with data graphs - ‘cues’ in data graphs are attributes of the entities and are represented as relationships in terms of triples.
The attribute validity value of an entity
v
{
C
}
is calculated with regard to a relationship type e, as the aggregation of the attribute validity values for all entitiesv
e
linked to subclassesv:vv. In other words, the validity of eachv
e
acts as a predictor for the validity ofv
. The attribute validity value ofe
v
increases, as the number of relationships of typee
betweene
v and the subclasses v:vvincreases; whereas the attribute validity value of
v
e
decreases as the number of relationships of typee
betweenv
e
and all entities in the data graph increases. We define the set of verticesW
(
v
,
e
)
related as Subjects to thesubclasses v:vv, via relationship of type
e
:W
(
v
,
e
)
{
v
:
v
v
v
v
,
e
,
v
P
}
e e
(1)The following formula defines the attribute validity metric for a given entity
v
with regard to a relationship typee
.
) ,
(
|
{
,
,
:
}
|
|
}
:
,
,
{
|
)
,
(
e v W
v e a a
e
e
v
e
v
v
V
v
v
v
e
v
e
v
AV
(2)For example (see Figure 1), the attribute validity value for
Guitar will aggregate attribute validity values of its members,
one of which is Dobro. The attribute validity value for Dobro
with regard to the rdfs:subclassOf relationship type and the given category entity Guitar equals the number of
rdfs:subclassOf relationships between Dobro and the
subclasses of Guitar (2 relationships), divided by the number of rdfs:subclassOf relationships between Dobro
Category-Attribute Collocation (CAC):
This approach was used in [33] to improve the cue validity metric by adding the so called category-feature collocation measure which takes into account the frequency of the attribute within the members of the category. This gives preference to ‘good’ categories that have many attributes shared by their members. In our case, a good category will be an entity
v
{
C
}
with high number of relationships of type e betweene
v and the subclassesv:vv, relative to the number of its subclasses. The following formula defines the category-attribute collocation metric for a given entity
v
with regard to a relationship typee
.| | | } : , , { | | } : , , { | | } : , , { | ) , ( ) , ( V v v v e v V v v e v v v v e v e v CAC e e v W
v e a a
e e
(3)For example (see Figure 1), the category entity Violin has three performances (attributes) linked to its subclasses Fiddle and
Alto Violin via MusicOntology:instrument. This
will add a weight of 2/3 to the AV of Violin.
Category Utility (CU):
This approach was presented in [30] as an alternative metric for obtaining categories at the basic level. The metric takes into account that a category is useful if it can improve the ability to predict the attributes for members of the category, i.e. a good category will have many attributes shared by its members (as mentioned in the category-attribute collocation metric). At the same time, it should possess ‘unique’ attributes that are not related to many other categories (efficiency of category recognition). We adapt the formula in [26] for a data graph:
2 2 ) , ( ) | | | } : , , { | ( ) | | | } : , , { | ( | | | | ) , ( V V v v e v V v v v e v V V e v
CU e a a
e v W v e e
(4)For example (see Figure 1), considering again Violin. In addition to the proportion of performances divided by number of subclasses for Violin, the category utility will also include the proportion of all performances linking Violin (3 in this case) over the total number of entities in the graph (12).
The algorithm for calculating the metrics is given in Algorithm I.
Algorithm I: Distinctiveness Metrics
Input: DGV,E,P,eE
1. for all do
2. V := the set of all
v
:
v
v
3. forall do 4. := set of all 5. := set of all 6. :=7. := 8. :=
9. := + 10. := + 11. := + 12. end for
13. := 14. end for
Output: , , for all
The algorithm takes a data graph and a relationship type (hierarchical or domain-specific relationship) as input and returns values for the three distinctiveness metrics for each entityv{C}. For an entity
v
, all subclasses are retrieved using the subsumption relationship (line 2). Then, for each entityv
e
linked to one or more subclass entities v via triples ve,e,v (line 3), several stepsare conducted: retrieving all triples with Subject
v
e
and Objectany subclass v (line 4); retrieving all triples with Subject
v
e
andObject any graph entity
v
(line 5); applying the formulas for calculating the AV, CAC, and CU metrics forv
e
(lines 6-8); and aggregating values forv
e
to the overall values forv
(lines 9-11).4.2.2
Homogeneity Metrics
As outlined in Section 3, knowledge anchors will be more homogeneous because their members will be similar to each other. We utilize three set-based similarity metrics: Common Neighbours (CN), Jaccard (Jac), and Cosine (Cos) [31, 32]. For example (see Figure 1), consider the entity Guitar and the hierarchical relationship rdfs:subClassOf. Guitar has two subclasses which share one common entity (Dobro) and have all together two entities (Dobro and Lap Steal Guitar). The Jaccard similarity for Guitar will be 1/2.
The algorithm for calculating the metrics is given in Algorithm II.
Algorithm II: Homogeneity Metrics Input:DG V,E,P,eE
1. for all do
2. V := the set of all
v
:
v
v
3. forall do 4. 5. 6. 7. 8. 9. 10. 11. 12. 13. 14. end for
15. 16.
17.
18. end for
Output: , , for all
The algorithm takes a data graph and a relationship type (hierarchical or domain-specific relationship) as input and returns values for the three homogeneity metrics for each entity v{C}. For an entity
v
, all subclasses are retrieved using the subsumption relationship (line 2). For each pair of subclass entitiesv
andv
(line 3), several steps are conducted: retrieving all entities linked via triples withv
andv
(lines 4-5); calculating their intersection and union (lines 6-7); applying the formulas for calculating the similarity metrics CN, Jac, and Cos (lines 8-10); and aggregatingv
e
v
v
e
:
e
,
,
e N e M | | / | |Ne Me|) | / | (| |) | / |
(|Ne Me Ne V
2 2 |) | / | (| |) | / |
(|Ne V Me V e v AV e v CAC v AV v CAC e v CAC v CU e v CU e v CU v AV v CAC v
AV CACv CUv
} {C v v v v
v CN CN
CN ,
v
CN Jacv Cosv
V v v e
ve, , :
e v AV v CU V v v e
ve, , a : a
} {C v
V
v
V
v
v
v
,
)
:
(
} {C v}
,
,
:
{
:
v
v
e
v
V
e
e
e
}
,
,
:
{
:
v
v
e
v
V
e
e
e
e e
V
V
I
:
e e
V
V
U
:
| | :
, I
CNvv
|
|
/
|
|
:
,
I
U
Jac
vv
|)
|
|
|
/(
|
|
:
,v e e
v
I
V
V
Cos
v v v
v Jac Jac
Jac ,
v v v
v Cos Cos
Cos ,
) 2 / ) 1 | .(| | /(|
CN V V
CNv v
) 2 / ) 1 | .(| | /(|
Cos V V
Cosv v
) 2 / ) 1 | .(| | /(|
Jac V V
Jacv v
} {C v
v
CU CUv
V
V
| |
these values to the overall values for
v
(lines 11-13); and normalizing the aggregated values (lines 15-17).Each KADG metric was implemented by running SPARQL queries
over the MusicPinta data graph [5] stored in a triple store. This implementation allowed examining the performance of the KADG
metrics over a specific data graph, as presented next.
5.
EXPERIMENTAL STUDY
In order to evaluate the KADG metrics, we compared the outputs of
the implementation of the two algorithms over the MusicPinta data graph versus a benchmarking set of basic level objects from the categories in the data graph, as identified by humans.
Ten online surveys2 were run adopting two strategies.
Strategy1 – leaf instruments. Eight surveys presented the 256 leaf entities: each survey showed 32 MusicPinta leaf entities and 8 additional images minimizing bias.
Strategy2 – category instruments. Two surveys presented the 108 category entities: each survey showed 54 category entities plus 14 images minimizing bias.
The image allocation in surveys was random. Every survey had four respondents from the study participants. Each participant was allocated only to one survey. Each image was shown for 10 seconds on the participant's screen and he/she was asked to type the name of the given object (for Strategty1) or the category of objects (in Strategy2) as quickly as possible. Following Cognitive Science studies to identify basic objects, we extracted the benchmarking lists of knowledge anchors using accuracy and frequency [16]. Two benchmarking sets of KADG were obtained:
Set1 [resulting from Strategy1]. We consider accurate naming of a category entity (parent) when a leaf entity is seen.
Set2 [resulting from Strategy 2]. We consider naming a category entity with its exact name, or its superclass (parent), or its subclass (member). Entities with frequency equal or above two (i.e. named by two different users) were identified as KADG. From
the two strategies, two groups of benchmarking sets are identified:
StrongAnchors [intersection of Set1 and Set2] = {Accordion, Bell, Bouzouki, Clarinet, Drum, Flute, Guitar, Harmonica, Harp, Saxophone, String instrument, Trumpet, Violin, Xylophone}.
WeakAnchors[union of Set1 and Set2] = {Accordion, Banjo, Bell, Bouzouki, Cello, Clarinet, Drum, Electric piano, Flute, Gong, Guitar, Harmonica, Harp, Lute, Lyre,Organ,Recorder, Saxophone, String Instrument, Trombone, Trumpet, Tuba, Violin, Xylophone}.
6.
EXPERIMENTAL RESULTS
The two benchmarking sets – StrongAnchors and WeakAnchors - are used to examine the performance of the KADG metrics. For
each KADG metric, we aggregate (using union) the KADG entities
identified using the two hierarchical relationships (rdfs:subclassOf and dcterms:subject). Since the three homogeneity metrics returned the same values, we choose one metric when reporting the results, namely Jaccard similarity3. A
cut-off threshold point for the result lists with potential KADG
entities was identified by normalizing the output values from each metric and taking the mean value for the 60th percentile of the
2 The study was conducted with Qualtrics (www.qualtrics.com).
3 The Jaccard similarity metric is widely used, and was used in identifying
basic formal concepts in the context of formal concept analysis [25].
lists. Each KADG metric (the three distinctiveness metrics and the
Jaccard metric), was applied over both families of relationships – hierarchical and domain-specific. Precision and Recall values were calculated using the two benchmarking sets.
The precision values were poor (ranging from 0.16 to 0.26 for
StrongAnchors and from 0.21 to 0.35 for the WeakAnchors). Recall values for the StrongAnchors were better (ranging from 0.46 to 0.77), while for the WeakAnchors recall values were very mixed (ranging from 0.18 to 0.73). Inspecting the False Positive (FP) entities, we noticed two main reasons for the poor precision. Firstly, the algorithms were selecting entities with a low number of subclasses (e.g. Zurna). To take into account the number of subclasses for the entities, we multiply the metrics values by SNv:
SNv1(1/|{v:vv}|) (5)
Secondly, the algorithms returned FP entities which had long label names (e.g. Pluckedstring-instrument). We adopt a name simplicity approach which is based on the data graph: it filters out all entities whose name length is higher than the
weighted median for the length of labels of all entities. For the MusicPinta data graph, the weighted median is 1.2. Precision results were improved noticeably (lowest value 0.36 to highest value 0.62), especially for the WeakAnchors set. Our baseline is calculated using all entities whose name length is less than weighted median (0.25 for WeakAnchors and 0.41 for StrogAnchors). Further analysis of FP and FN indicated that the algorithms had different performance on the different taxonomical levels, which is formulated in two heuristics for hybridization:
Heuristic 1: Use hierarchical Jaccard metric for the most specific categories in the graph.
Heuristic 2: Take majority voting for other taxonomical levels. Applying these heuristics improved precision values (lowest value 0.48 to highest value 0.65), especially for the WeakAnchors set.
7.
CONCLUSION
The knowledge anchors can be also used to solve the key problem of ‘cold start' in personalization and adaptation. The immediate future work is to apply the metrics in another domain (e.g. data graph with career options which will be used to generate career paths). In the long run, we aim to utilize the metrics to generate navigation paths using subsumption strategies for meaningful learning while taking into account user's domain familiarity.
8.
REFERENCES
[1] Schraefel, MC. What does it look like, really? Imagining how citizens might effectively, usefully and easily find, explore, query and re-present open/linked data. In Proc. ISWC 2010.
[2] Waitelonis, J., Knuth, M., Wolf, L., Hercher, J. and Sack, H. The Path is the Destination-Enabling a New Search Paradigm with Linked Data. In LD in the Future Internet @ Future Internet Assembly, 2010.
[3] Popov, I.O., Schraefel, M., Hall, W., Shadbolt, N. Connecting the Dots: A Multi-pivot approach to data exploration. In ISWC, 2011.
[4] Thellmann, K., Galkin, M., Orlandi, F., and Auer, S. LinkDaViz – Automatic Binding of Linked Data to Visualizations. In ISWC, 2015.
[5] Thakker, D., Dimitrova, V., Lau, L., Yang-Turner, F. & Despotakis, D. Assisting User Browsing over Linked Data: Requirements Elicitation with a User Study. In ICWE 2013
[6] Ausubel, D. A Subsumption Theory of Meaningful Verbal Learning and Retention. In Journal of General Psychology. Volume 66, Issue 2, 1962, pp. 213-224.
[7] Rosch, E., Mervis, C. B., Gray, W. D., Johnson, D. M., &Boyes-Braem, P. Basic objects in natural categories. Cognitive Psychology, 1976, 8, 382-439.
[8] Sah, M. & Wade, V. Personalized Concept-based Search and Exploration on the Web of Data using Results
Categorization. In ESWC 2013.
[9] Rossel,O. Implemention of a “search and browse” scenario for the LinkedData. In IESD, 2014.
[10]Vocht1, et, al. A Visual Exploration Workflow as Enablerfor the Exploitation of Linked Open Data. In IESD, 2014. [11]Peroni, S., Motta, E., d'Aquin, M. Identifying key concepts
in an ontology through the integration of cognitive principles with statistical and topological measures. In ASWC, 2008. [12]Marie, N., Gandon, F. Survey of linked data based
exploration. In IESD@ISWC2014.
[13]Dean, M., Basu, P., Carterette, B., Partridge, C. and Hendler, J. What to Send First? A Study of Utility in the Semantic Web. In (LHD+SemQuant), 2012, @ ISWC2012..
[14]Wille, R. Formal Concept Analysis as Mathematical Theory of Concepts and Concept Hierarchies. In Formal Concept Analysis: Foundations and Applications, Springer 2005. [15]Al-Tawil, M., Thakker, D. and Dimitrova, V. Nudging to
Expand User’s Domain Knowledge while Exploring Linked Data. In (IESD), 2014, @ ISWC2014.
[16]Tanaka, J., & Taylor, M. Object Categories and Expertise: Is the Basic Level in the Eye of the Beholder? Cognitive Psychology, 1991, 23, pp 457-482.
[17]Marie, N., Corby, O., Gandon, F. and Ribiere, M. Composite interests’ exploration thanks to on-the-fly linked data spreading activation. In Hypertext 2013.
[18]Maccatrozzo , V., Aroyo , L., Robert , R. Crowdsourced Evaluation of Semantic Patterns for Recommen-dations. In UMAP 2013. LBR.
[19]Nunes, T., Schwabe, D. Exploration of Semi-Structured Data Sources. In (IESD), 2014, @ ISWC2014.
[20]Rosen, E. Principles of categorization. In E. Rosch & B. B. Lloyd (Eds.), 1978. Cognition and categorization. pp. 27-48. [21]Thakker, D., Despotakis, D., Dimitrova, V., Lau, L., Brna, P.
(2012). Taming digital traces for informal learning: A semantic-driven approach. In Proceedings of EC-TEL 2012. [22]Bizer, C., Heath, T., and Berners-Lee, T. Linked Data - the
story so far. International Journal on Semantic Web and Information Systems, 5, (3), pp 1-22.
[23]Ruotsalo, T., et al. Supporting Exploratory Search Tasks with Interactive User Modeling. In ASIST, 2013. [24]Zhang, X., Cheng, G. and Qu, Y. Ontology Summarization
Based on RDF Sentence Graph. In WWW, 2007. [25]Belohlavek, R., Trnecka, M. Basic level of concepts in
formal concept analysis. In ICFCA, 2012, pp 28-44. [26]Belohlavek, R., Trnecka, M. Basic Level in Formal Concept
Analysis: Interesting Concepts and Psychological Ramifications. In IJCAI 2013.
[27]Troullinou, G., Kondylakis, H., Daskalaki , E., Plexousakis , D. RDF Digest: Efficient Summarization of RDF/S KBs. In ESWC, 2015.
[28]Li, N., Motta, E. Evaluations of user-driven ontology summarization. In EKAW 2010. pp 544-553.
[29]Al-Tawil, M., Dimitrova, V., Thakker, D. Using Basic Level Concepts in a Linked Data Graph to Detect User's Domain Familiarity. In UMAP2015, Dublin, Ireland.
[30]Corter, J. E., Gluck, M. A. Explaining basic categories: Feature predictability and information. Psychological Bulletin, 111(2):291–303, 1992.
[31]David Liben-Nowell and Jon Kleinberg. The link-prediction problem for social networks. In Journal of the American Society for Information Science and Technology, 2007. [32]U Kang, et al. Axiomatic Analysis of Co-occurrence
Similarity Functions. Microsoft Research, WA, USA, 2012 [33]Jones, G. V. Identifyingbasic categories. Psychological
Bulletin, 94:423–428, 1983.